Research Article | | Peer-Reviewed

Financial Inclusion in Northeast India: A Multidimensional State-Level Analysis Using Sarma’s Distance Method

Received: 3 April 2026     Accepted: 15 April 2026     Published: 24 April 2026
Views:       Downloads:
Abstract

Financial inclusion particularly in regions with socio-economic challenges such as Northeast India, is a critical primary driver of social development and economic growth. This study seeks to analyses the financial inclusion across eight North-Eastern states of India- Arunachal Pradesh, Assam, Manipur, Meghalaya, Mizoram, Nagaland, Tripura, Sikkim- by using a multidimensional approach which comprises three key dimensions of financial inclusion: Banking penetration, availability, and usage. Data were collected from secondary sources, including Database on Indian Economy (RBI), NABARD State Focus Papers and Census data. As the sample size is small and low correlation among variables, Principal Component Analysis (PCA) was not suited. Therefore, the study uses Sarma’s distance method (2008) to construct Financial Inclusion Index (FII) for eight states. The result of the study reveals significant disparities across states: Sikkim (FII= 0.58) and Mizoram (FII= 0.523) show high financial inclusion among the eight states and fall in medium inclusion category, because of robust banking access and penetration, while Nagaland (FII= 0.16), and Arunachal Pradesh (FII= 0.273), and Meghalaya (FII=0.192) display low financial inclusion, which reflects limited banking infrastructure and usage. Assam, Manipur, and Tripura fall in medium financial inclusion. The findings of the study underline the need of effective policy in lagging states to improve access and usage of financial services. The study contributes to the existing knowledge by providing a comparative state-level analysis of financial inclusion in North-East India, which helps policymakers, financial institutions and researchers in designing financial inclusion strategies.

Published in Innovation Management (Volume 1, Issue 2)
DOI 10.11648/j.im.20260102.12
Page(s) 85-94
Creative Commons

This is an Open Access article, distributed under the terms of the Creative Commons Attribution 4.0 International License (http://creativecommons.org/licenses/by/4.0/), which permits unrestricted use, distribution and reproduction in any medium or format, provided the original work is properly cited.

Copyright

Copyright © The Author(s), 2026. Published by Science Publishing Group

Keywords

Financial Inclusion, Northeast India, Banking Penetration, Usage, Sarma Distance Method
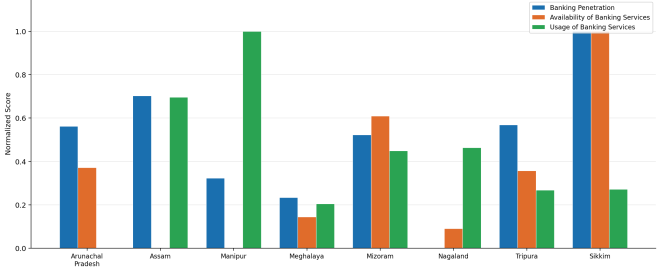
1. Introduction
India is unique among developing countries in terms of its socioeconomic, political, cultural, and geographic conditions. Thus, it requires an array of service providers, products which are customized to the needs of the unbanked, and the use of technology to reach the unbanked . Financial inclusion ensures that an array of financial products and services are accessible and affordable for all individuals and businesses, irrespective of their financial situation . Financial inclusion has come up as one of the cornerstones of economic development, largely recognized by agencies, policymakers, and academic researchers as an important precondition for alleviation of poverty, equitable growth, and economic empowerment . Financial inclusion ensures that all segments of society-particularly the vulnerable and low-income groups- have affordable and timely access to a broad range of formal financial services, which comprises savings, insurance, credit, and payments. A well-functioning financial system serves as a stimulus for capital formation, productive investments and sustained economic growth. Poverty and Income inequalities can be reduced by improved access to financial services, particularly among disadvantaged social groups . As a result, financial inclusion has been awarded a central place in United Nations Sustainable Development Goals (SDGs), especially in SDG 1-No poverty, SDG 8- Decent Work and Economic Growth, and SDG 10- Reduced Inequalities.
Despite growing concerns of financial inclusion, the challenge of measuring it adequately continues to be an issue in the literature. Early approaches used only single indicators- such as bank density or numbers of banks accounts- which fails to capture the multi-dimensional nature of financial access . To overcome this shortcoming, Sarma (2008) proposed the Index of Financial Inclusion (FII), a composite score which integrates information on the three core dimensions- Banking Penetration, Availability of banking services, and Usage of banking system- into a single index between 0 (Exclusion) and 1 (Inclusion).
Financial inclusion in India stated has been a policy priority since at least 2005, when the RBI introduced no-frills account initiative, and scaled up by landmark Pradhan Mantri Jan Dhan Yojana (PMJDY) launched in 2014. According to the Global Findex Database 2021, indicate one of the rapid expansions of formal financial access, as India’s account holder has risen to over 77 percent of adults. In India, states like Kerala, Goa and Tamil Nadu rank consistently among the most financially included, while several states in Central and Eastern India, and particularly states of North-East rank at the lower end of financial inclusion . This geographic division reflects differences in urbanization, income level, literacy, infrastructure, and demographic structure which emphasizes the need for region-specific analysis that go the beyond national average.
The North-Eastern region of India which comprises eight states of Assam, Arunachal Pradesh, Mizoram, Nagaland, Manipur, Meghalaya, Sikkim and Tripura. It covers about 2.62 lakhs square kilometers and home of more than 3.7 percent of Indian population, the region is marked by rugged hill terrain, geographic isolation, and predominance by Schedule Tribe populations who face structural barriers of formal financial access . The North-East imposes high transaction cost on financial institutions, which make conventional branch-led banking less attractive, while geographic barriers like erratic power supply, limited road connectivity, and poor telecommunication infrastructure raise the cost of delivering financial services . While past studied examined financial inclusion in India at the national and State level , a multidimensional analysis of North-East states remains scares and studies in North-East states applying Sarma distance method are limited. The present study undertakes a systematic assessment of financial inclusion across eight states of North-East India by using Sarma’s Distance-based Index of Financial Inclusion. Banking penetration, availability of banking services, and usage of banking services are taken as three core dimensions, data drawn from Database on Indian Economy (RBI), NABARD State Focus Papers and Census data.
2. Literature Review
Conducted a bibliometric analysis on financial inclusion by extracting 436 Scopus indexed articles published between 2001 and 2020. The result of the bibliometric analyzed revealed, research on financial inclusion gained significant momentum only after 2013, growth of publications observed from 2014 onwards, with 125 documents alone in 2019. India emerged as the most productive, accounting of 133 document- 37% of top ten countries. The keyword cluster analysis identified six clusters which emerge as most dominant research themes, namely financial services, microfinance, social inclusion, and poverty allegation, while areas like women’s status, household income distribution, insurance system, and policy making remained underexplored . Paramasivan and Ganeshkumar studied the concepts, regional patterns, status, and policy recommendations surrounding financial inclusion in India. Started with the formal introduction of financial inclusion in India back to 2005, which began with a pilot project in Pondicherry, and key initiatives by the RBI including relaxed KYC, no-frills accounts, business correspondents, and General Credit Cards . The paper plot India at a moderate level globally- noting bank deposits as a percentage of GDP (60.11%) which placed India at 3rd. NSSO (2012) regional data revealed disparities, with south India holds highest share of bank accounts, while the Northeast held mere 2.3%. A progressive pattern observes from March 2012 data, shows 1,20,355 BC outlets operational, 103.21 million no-frills accounts opened, and ICT-based transactions rising. examined financial inclusion in India, highlight the gap between formal financial system and rural/poor population, study examines the financial inclusion in India. The study describe financial inclusion is the process of delivering low cost and affordable financial services to disadvantaged and low-income groups. It reviewed key RBI policy initiatives to promote financial inclusion, which included relaxed KYC norms, basic savings bank deposits, simplified branch authorization, financial literacy centers, financial inclusion plans, and the use of ICT-based business correspondent models. The study identified several opportunities that financial inclusion offers, such as facilitating electronic benefit transfers, enabling savings among the poor, boosting national GDP, and attracting global market players. On the other hand-poverty, financial illiteracy, language barriers, physical distance from banks, and institutional reluctance to serve low-income customers were major challenges. The paper recommended expanding ATM networks in rural areas, simplifying banking procedures, training banking staff, and leveraging post offices as business correspondents to increase financial inclusion. made a comprehensive review of literature to examine the concepts, approaches, extent, and measurable progress of financial inclusion in India up to 2013. They established the scale of financial inclusion- 65% of Indian adults remain outside the formal financial system, severe disparities with states of Bihar and Odisha reporting below 30% account penetration- simply a lack of sufficient money was most common barrier as cited by 63% unbanked adults . The study classified India’s financial inclusion approaches into six streams: Bank-led, Product based, regulatory, knowledge-based, technology-based, and government initiatives. Financial Inclusion Plans (2010-13) showed significant improvement, although called for stronger regulatory framework, leveraging ICT, profitability assurance of banks and Postal network. suggested that for inclusive growth, especially when 67% of Indian population resided in rural areas with limited access to financial services, financial inclusion is critical. The study aimed to construct Financial Inclusion Index (FII) for India for the period 2004 to 2015, based on three dimensions: banking penetration, availability of banking services, and access to insurance. The study followed, same methodology as use by UNDP for computing Human Development Index, Euclidean distance calculations. Data were sourced from IMF and IRDAI database and equal weights were assigned to all three dimensions. Based on their scores, financial inclusion was classified into three categories: low (0-0.4), medium (0.4-0.6), and high (0.6-1.0). The results of the study show India remained in low financial inclusion category from 2005 to 2012, improved to medium financial inclusion in 2013, and achieved high financial inclusion in 2014-2015. Examined financial inclusion across three dimensions- Access, Quality, and Usage constructed two financial inclusion indices (index 1 and index 2) for Indian states – using 12 parameters in index 1 and 8 parameters in index 2. Used total habitable area (excluding forested regions) instead to total geographical area, and registered electorate as proxy for adult population. Additionally, incorporated post office saving bank facilities and microfinance institution as variables, which largely overlooked in previous research. The result indicated Karnataka, Andhra Pradesh, West Bengal, and Tamil Nadu as top performer in Index 1 and in Index 2, which covered union territories as well, ranked Chandigarh, Delhi, and Goa at the top, while Bihar, Madhya Pradesh, Rajasthan, and Uttar Pradesh- along with north eastern states ranked at bottom. used 2017-18 data across three dimensions: Banking penetration, Availability of banking services, and usages (credit-deposit ratio) construct a state-wise Financial Inclusion (FII) for India by using Principal Component Analysis (PCA) on SPSS. The results revealed, Delhi and Goa fell in the high inclusion category, while eight states including Kerala, Tamil Nadu, Karnataka and Punjab fell in middle inclusion levels. The majority of states, including Eastern, North-Eastern states and Central states, fell in the low inclusion category. Across all three-dimension Assam performed consistently poorly, ranking 26th overall, while Manipur (rank 29) and Nagaland (rank 31) were among the worst performers nationally. An anomaly pattern was noted in Goa, despite topping availability and penetration, in case of usages it ranked among the worst due to low credit-deposit ratio. used PMJDY data of 2022 to construct a Financial Inclusion Index (FII) for all 37 Indian States, by using three dimensions- banking penetration, banking services and banking disbursement, calculated by normalized inverse Euclidean Distance Method. The study especially focused on working-age population (18-59 years) as denominator. The results of the study revealed Chhattisgarh as the top performer, followed by Assam, Rajasthan, West Bengal, Jharkhand, and Bihar fell in high-inclusion category, while traditionally high performing states like Kerala, Goa, and Tamil Nadu ranked near bottom because their already-established banking system leaving limited room for PMJDY. Out of 37 states of India, 6 achieved high inclusion, 14 fell in middle inclusion, and 17 in low inclusion. utilized PCA-weighted Financial Inclusion Index (FII) based on three dimensions: banking penetration, Availability, and usage of banking services to examine interstate financial inclusion (FI) across India, period from 2001-19 and inter-district from 2011-2021 of West Bengal. The results showed, at the national level, states like Chandigarh, Delhi, and Goa consistently ranked high, while low ranking observed in central states and northeastern states. Andaman & Nicobar, Andhra Pradesh, Nagaland and Chandigarh showed overall worsening over the study period. In West Bengal, Kolkata alone maintained high FI throughout the period, while most other districts remained in the category of low financial inclusion. Using Paned data regression reveals higher secondary enrolment, social expenditure, per capita GDP, telephone penetration, numbers of factories, and internet connectivity as significant positive determinants of Financial Inclusion (FI). The study concludes that achieving high financial inclusion requires equally attention to digital infrastructure, literacy, and industrialization. used three dimensions of financial inclusion: banking penetration, availability of banking services, and credit-deposit ratio (usages), measure the financial inclusion across India from period 2019 to 2024 using composite Financial Inclusion Index (FII). The study found that bank accounts per 1000 people rose from 5.98 to 8.22 over the period. Due to stronger digital adoption and infrastructure, southern states like Kerala, Tamil Nadu, Karnataka and Maharashtra performed well, while low-income states like Uttar Pradesh and Bihar and north-east states lagged significantly. The turning point was noted due to COVID-19 which accelerate the adoption of digital transaction-based inclusion through UPI, Mobile banking and PMJDY. By 2024, Andhra Pradesh toped the FII ranking (0.793). employed two-stage Principal Component Analysis (PCA) constructs a Financial Inclusion Index (FII) for 28 Indian states over two decades (2000-2020) by using three dimensions of financial inclusion: Availability, Penetration and Usages. Results of the study showed that Goa, Tamil Nadu, and Kerala ranked highest in financial inclusion throughout the study period, owing to higher literacy rates, superior banking infrastructure, and better income levels, while states like Manipur, Mizoram, Nagaland, and Meghalaya remained at the bottom, reflecting socio-cultural barriers, deficit in banking access and low financial literacy. The noted how landmarks policies like branch licensing and PMJDY in 2014 brought gradual improvements in FII across most states of India, though large rural states and northeast states continued to lag. Similarly, using panel techniques conformed southern/western states such as Goa, Kerala, Tamil Nadu, Maharashtra, and Telangana outperforming others, with literacy, per capita GDP, industrialization, and digital infrastructure as significant drivers; despite, usage remained the weakest linked. Extending the macroeconomic perspective, By considering PMJDY constructed a specific FII using per capita saving account, deposits, and RuPay debit card across Indian states and union territories. Employed regression analyzed, demonstrated a positive and significant relationship between FII and stat level economic growth (GDP), underscoring PMJDY’s role in driving macroeconomics outcomes, particularly through enhanced digital access post 2014. Developed a multidimensional FII for 27 Indian states by constructing separate demand and supply indices, and revealed significant interstate variation, with southern and western stater performing better in both dimensions, while northeastern and eastern states lagged, which emphasized the need of regional specific policies.
3. Research Gap
Despite the growing attention of financial inclusion literature in national level, an unexplored area remains the state-wise analysis of the Northeast Indian region. While various studies have examined financial inclusion at the national level, the Northeast states- Arunachal Pradesh, Assam, Manipur, Mizoram, Meghalaya, Nagaland, Sikkim, and Tripura- have received limited response. Moreover, most of the existing studies treat Northeast states as marginal data points within broader all-India rankings or within a single regional category, thereby hiding the significant heterogeneity that exist across these states in terms of literacy level, banking infrastructure, tribal population, economic development, and geographic terrain.
4. Objectives of the Study
1) To assess the level of financial inclusion across the eight North-Eastern states of India using Sarma's Distance-based Index of Financial Inclusion (FII).
2) To compare banking penetration, availability, and usage of banking services across the eight North-Eastern states.
3) To rank the North-Eastern states based on their Financial Inclusion Index (FII) scores.
5. Research Methodology
The research employs descriptive and analytical research design, as it describes and compares the financial inclusion across eight Northeastern states of India- Assam, Arunachal Pradesh, Mizoram, Nagaland, Manipur, Meghalaya, Sikkim and Tripura. The study adopts a census-based approach, eliminating the need of sample, since all eight states of Northeast India are included in analysis. The study uses secondary data for the construction of Financial Inclusion Index (FII) which have been sourced from the Database on Indian Economy (RBI) 2025, NABARD state focus papers and the Census of India 2011.
5.1. Dimension of the Index
For construction of Financial Inclusion Index (FII) the study follows Sarma’s model (2008) which comprises of three core dimensions:
1) Banking Penetration (d1)- measures numbers of banks account per 1000 population;
2) Availability of Banking Services (d2)- measures numbers of bank branches and ATMs per 1000 population; and
3) Usage of Banking Services (d3)- measures credit-deposit ratio.
5.2. Index Construction
Sarma’s (2008) Distance-based Index of Financial Inclusion is adopted because the sample size is small which consist of eight Northeast state of India, and low inter-variable correlation which violate the assumption of Principal Component Analysis (PCA). The Financial Inclusion Index (FII) is constructed in two stages:
First, each three dimensions: Banking penetration, Availability, and Usages is normalized by using min-max formula. This approach is similar to that which UNDP employs to calculate some well-known development indexes such as HDI, HPI, and GDI (Sarma, 2008).
di=Ai-miMi-mi
Where:
Ai=Actual value of dimenson i
mi=Minimum value of dimenson i
Mi=Manimum value of dimenson i
Second, the Financial Inclusion Index (FII) is computed as:
FIIi=1-(1-d1)2+(1-d2)2+...+(1-dn)2n
Where:
1) d1 = Banking penetration dimension
2) d2 = Availability of banking services
3) d3 = Usage of banking services
The resulting of Financial Inclusion Index (FII) is categorized into three categories;
0.0 to 0.4- Low Financial Inclusion
0.4 to 0.6- Medium Financial Inclusion
0.6 to 1.0- High Financial Inclusion
6. Data Analysis and Findings
6.1. Dimension-wise Analysis
Below tables present the normalized score of all three financial inclusion dimensions of eight Northeast states. The normalization is done between 0 and 1, where 0 represent the lowest performer and 1 represent the best performer by using min-max formula.
Table 1. Banking Penetration Dimension (d1) — North-Eastern States of India.

State

Total Number of Accounts

Population

Bank Accounts as Proportion of Population

Bank Penetration Dimension (d1)

Arunachal Pradesh

22,91,000

13,83,727

1.6557

0.5626

Assam

5,67,23,000

3,12,05,576

1.8177

0.7035

Manipur

35,47,000

25,70,390

1.3799

0.3228

Meghalaya

37,89,000

29,66,889

1.2771

0.2333

Mizoram

17,67,000

10,97,206

1.6105

0.5232

Nagaland

19,96,000

19,78,502

1.0088

0.0000

Tripura

61,08,000

36,73,917

1.6625

0.5685

Sikkim

13,18,000

6,10,577

2.1586

1.0000

Source: Authors Compilation
Table 2. Availability of Banking Services Dimension (d2) — North-Eastern States of India.

State

Total Offices

Population

Branch per 1000 Population

Availability Dimension (d2)

Arunachal Pradesh

257

13,83,727

0.185730

0.371893

Assam

3,393

3,12,05,576

0.108731

0.000900

Manipur

279

25,70,390

0.108544

0.000000

Meghalaya

411

29,66,889

0.138529

0.144472

Mizoram

258

10,97,206

0.235143

0.609968

Nagaland

252

19,78,502

0.127369

0.090702

Tripura

671

36,73,917

0.182639

0.356998

Sikkim

193

6,10,577

0.316094

1.000003

Source: Authors Compilation
Table 3. Usage of Banking Services Dimension (d3) — North-Eastern States of India.

State

Deposits (₹ Crore)

Credit (₹ Crore)

Credit-Deposit Ratio

Usage Dimension (d3)

Arunachal Pradesh

33,114

10,273

0.310231

0.000000

Assam

2,34,070

1,46,867

0.627449

0.696679

Manipur

16,806

12,866

0.765560

1.000000

Meghalaya

37,779

15,241

0.403425

0.204674

Mizoram

17,462

8,987

0.514660

0.448970

Nagaland

18,789

9,792

0.521156

0.463236

Tripura

42,140

18,224

0.432463

0.268448

Sikkim

16,290

7,067

0.433824

0.271437

Source: Authors Compilation
Figure 1. Dimension-wise Financial Inclusion Score North- Eastern States of India.
Banking Penetration (d1): In terms of banking penetration, Sikkim achieves a score of 1.000, which reflect highest rate of bank account per 1000 population (2.1586), Nagaland scores the lowest 0.000. Tripura (0.5685) and Assam (0.7035) perform well in penetration dimension.
Availability of Services (d2): In term of second dimension, Sikkim again leads with perfect score of 1.000 (0.316094 branch per 1000 population). Lowest score in Availability dimension is recorded by Manipur. Mizoram with (0.60997) performs satisfactorily, while Assam score is near (0.0009), indicates a severely low branch-to-population ratio based on its large population size.
Usage of Services (d3): Manipur leads the third dimension with score of 1.000 (highest Credit-Deposit ratio of 0.765560), followed by Assam with (0.69668). Lowest scores in usages dimension are recorded by Arunachal Pradesh (0.000) which indicate the lowest Credit-Deposit ratio in the region.
6.2. FII Ranking and Classification
Table 4 presents the composite FII score, rank, and inclusion category for each North-Eastern state.
Table 4. State-wise Ranking Based on Index of Financial Inclusion (IFI).

Rank

State

IFI Score

Inclusion Level

Category

1

Sikkim

0.58

Medium

0.4–0.6

2

Mizoram

0.523

Medium

0.4–0.6

3

Tripura

0.384

Low

0.0–0.4

4

Assam

0.374

Low

0.0–0.4

5

Manipur

0.303

Low

0.0–0.4

6

Arunachal Pradesh

0.273

Low

0.0–0.4

7

Meghalaya

0.192

Low

0.0–0.4

8

Nagaland

0.16

Low

0.0–0.4

Source: Authors Compilation
Figure 2. Index of Financial Inclusion (IFI)- North-Eastern States of India.
6.3. Descriptive Statistics
Table 5 presents descriptive statistics for the three dimensions and the composite IFI across the eight North-Eastern states of India.
Table 5. Descriptive Statistics — Financial Inclusion Dimensions (North-Eastern States).

Dimension

Minimum

Maximum

Mean

Std. Dev.

Banking Penetration (d1)

0.000

1.000

0.489

0.305

Availability (d2)

0.000

1.000

0.322

0.346

Usage (d3)

0.000

1.000

0.419

0.312

FII

0.160

0.580

0.349

0.148

Source: Authors Compilation
The mean value of the Financial Inclusion Index (IFI) is 0.349 which, confirms that the Northeast region of India falls in category of low financial inclusion.
7. Discussion
High Inclusion States Among Eight States: Sikkim and Mizoram,
Top performers in the region are Sikkim (IFI=0.580) and Mizoram (IFI=0.523), Sikkim achieves a perfect normalized score in terms of both banking penetration and availability of banking services, driven by its small population of (610,577) yielding the highest branch-to-population ratio (0.316094 per 1000) and account-to-population ratio (2.1586) in the Northeast region. While Sikkim’s usage score is moderate (0.271437), which indicates despite the infrastructure and accounts are available but not fully utilized, probably due to limited awareness or preference for informal credit channels.
Likewise, Mizoram demonstrates strong banking penetration (0.5232) and second highest availability (0.6099) in the northeast region. The usage dimension is (0.448970), suggest a more balance inclusion profile.
Medium Inclusion States Among Eight States
An interesting pattern in noticed: all three dimensions do not move uniformly across the states.
Assam indicates a paradox- it has moderate banking penetration (0.7035) and strong usage (0.696679), while its availability score is nearly zero (0.00900). This is because Assam has a very large population size (about 31.2 million), although it has the highest numbers of bank offices in the Northeast (3,393), but becomes very low when it measured with per 1000 population. Hence, Assam simply does not need more branches but a better and more balanced distribution of bank branches.
In Manipur, the opposite pattern is observed; despite having the highest usage score (1.0000), it has the lowest availability score (0.000) and below average banking penetration (0.3228). which suggesting that credit facilities are efficiently utilized but infrastructure remains underdeveloped.
While Tripura achieves a balance score all three dimensions of financial inclusion (0.5685, 0.3569, 0.26844), which makes it structurally a consistent performer in the middle category.
Low Inclusion States
Nagaland has the lowest banking penetration in the region (d1=0.000), which is the primary driver for last-place ranking in financial inclusion. It has moderate usage score (0.463236), the lack of banks accounts demonstrates that most of the population are outside the formal banking system.
Meghalaya scores below average across all three dimensions of financial inclusion. Its scattered rural settlements, large tribal population, and lack of financial literacy restrict both the supply and demand sides of financial inclusion.
Arunachal Pradesh has zero usage score (d3=0.000), despite moderate availability and banking penetration, the zero-usage utilization indicates people are not actively using banking services, which suggests that most bank accounts may be inactive or used for government benefits, rather than real usage like loans and business transactions.
In this section, authors are advised to provide a thorough analysis of the results and make comparisons with relevant literature, not a short summary or conclusion. Any future research directions could also be stated in the discussion.
8. Limitations
Despite of significant contributions, this study possesses certain limitations that should be acknowledge. First, the study entirely based on secondary data sourced from the official website of Reserve Bank of India’s Database on Indian Economy, NABARD State Focus Papers, and Census of India 2011. As the Census 2011 population figure become outdated, which may lead to an overestimation of per-capita financial inclusion scores, specially in states with high population growth rates.
Second, the study measure Financial Inclusion Index (FII) by using only three dimensions: banking penetration, availability of banking services, and usages (credit-deposit ratio) and follow well-established Sarma (2008) framework, the study fails to covers others equally important dimensions to measure financial inclusion, such as pension and social security schemes, access to insurance product, digital and mobile banking adoption, and the quality of financial services.
Third, the study uses a cross-sectional research design, analyzing financial inclusion of North-East India states at a single point of time rather that tracking its evolution over multiple years. The study also unable to covers impact of major policy interventions such as Pradhan Mantri Jan Dhan Yojana (PMJDY), rapid growth of digital payment infrastructure through UPI, and Demonetization (2016).
Forth, the study analyzes the state level of financial inclusion and does not examine intra-state variation across block or districts. Financial inclusion in Northeast India is highly uneven within states- urban districts and state capitals are likely to have higher inclusion then remote hills districts.
Fifth, assigning equal weightage to all three dimensions for constructing FII is assumption inherent to Sarma’s (2008) methodology. In practice, relative importance may vary across states depending on the specific infrastructure and socio-econimic context.
9. Policy Implication
The findings of this study carry several important policy implications for government authorities, regulatory bodies, and financial institutions operating in Northeast India.
1) For Nagaland, Meghalaya, and Arunachal Pradesh: Expansion of Business Correspondent (BC) and Targeted financial literacy campaigns are urgently needed. Digital payment incentives and PMJDY account activation drives, can enable to convert dormant account to active one.
2) For Assam: Priority should to given to efficient redistribution of existing branch network, rather than opening new branches.
3) For Manipur: Investment in branch and ATM infrastructure is critical. The state's strong usage scores indicate a demand for credit that is not being met by adequate supply-side infrastructure.
4) Region-wide: Strengthening digital infrastructure (internet connectivity, mobile penetration), aligning financial inclusion with SHG-bank linkage programmers, and leveraging the postal network as financial service delivery channels could significantly improve regional inclusion scores.
10. Conclusions
This study provides a multidimensional assessment of financial inclusion across eight North-Eastern states of India by using Sarma’s (2008) Distance-Based Index of Financial Inclusion. The result of the study indicates significant inter-state disparities in financial inclusion: Sikkim and Mizoram emerge has the superior, benefiting from higher banking infrastructure relative to small populations. Tripura, Manipur, and Assam occupy the middle financial inclusion band, while Nagaland, Meghalaya, and Arunachal Pradesh remain in the low financial inclusion category, back by low account penetration, limited infrastructure, and restrained credit usage.
The key findings of the study are that a high financial inclusion does not depends on high performance on one dimension. States like Assam (strong banking penetration and usage, near zero availability) and Arunachal Pradesh (Strong banking penetration, zero usage) indicate that a balanced development across all three dimensions of financial inclusion- penetration, availability, and usage- is essential to achieve meaningful financial inclusion.
Abbreviations

RBI

Reserve Bank of India

NABARD

National Bank for Agriculture and Rural Development

FII

Financial Inclusion Index

SDG

Sustainable Development Goal

PMJDY

Pradhan Mantri Jan Dhan Yojana

UPI

Unified Payments Interface

KYC

Know Your Customer

GDP

Gross Domestic Product

ATM

Automated Teller Machine

PCA

Principal Component Analysis

BC

Business Correspondent

SHG

Self Help Group

Author Contributions
Ritesh Sahani: Conceptualization, Data curation, Methodology, Writing – original draft
Rajat Sharmacharjee: Supervision, Writing – review & editing
Data Availability Statement
The data that support the findings of this study can be found at: https://censusindia.gov.in/census.website/
https://www.rbi.org.in/scripts/Statistics.aspx
Conflicts of Interest
The authors declare no conflicts of interest.
References
[1] Annemalla, R., & Kasturi, A. (2025). Financial inclusion among Indian States: An analysis through financial inclusion index. Global Business Review, 09721509251356954.
[2] Aggarwal, R. (2014). Financial inclusion in India: Challenges and opportunities. International Journal of Research, 1(4), 557-567.
[3] Beck, T., Demirgüç-Kunt, A., & Levine, R. (2007). Finance, inequality and the poor. Journal of Economic Growth, 12(1), 27-49.
[4] Behera, D., & Mishra, S. (2019). The extent of financial inclusion in the north-eastern states of India. Indian Journal of Social Research, 60(3).
[5] Chhatoi, B. P., Sahoo, S. P., & Nayak, D. P. (2021). Assessing the Academic Journey of ‘Financial Inclusion’ from 2000 to 2020 through Bibliometric Analysis. Journal of Scientometric Research, 10(2), 148–159.
[6] Dhar, P., & Barua, N. A. (2020). Financial Inclusion in India-A State-wise analysis. International Journal of Management (IJM), 11(10), 5.
[7] Garg, S., & Agarwal, P. (2014). Financial inclusion in India–a Review of initiatives and achievements. IOSR journal of business and Management, 16(6), 52-61.
[8] Goel, S., & Sharma, R. (2017). Developing a financial inclusion index for India. Procedia computer science, 122, 949-956.
[9] Gupta, S., Kumar, K., Mahajan, S., Narang, S., & Marwaha, P. (2025). A Comparative Analysis of Financial Inclusion Disparities Across Indian States and Union Territories. Exploresearch, 02(04), 114–126.
[10] Honohan, P. (2008). Cross-country variation in household access to financial services. Journal of Banking & Finance, 32(11), 2493–2500.
[11] Harithaa, ms. S., & alamelu, dr. K. (2026). Progress of financial inclusion in india’s aspirational districts: a zone-wise evaluation (2018-2025). International Journal of Research in Commerce and Management Studies, 08(02), 166–185.
[12] Kapoor, S., & Mohandas, V. (2023). Measuring Financial Inclusion in India: An Approach. Indian Journal of Finance, 17(1), 27.
[13] Kapoor, R. (2022). Enabling financial inclusion in North-East India. Retrieved from
[14] Kaur, R., Singh, A. P., & Mishra, S. (2025). Predicting Economic Development Through the PMJDY Index for Financial Inclusion: Evidence from India. Indian Journal of Research in Capital Markets, 8–26.
[15] Kodan, A. S., Garg, N. K., & Kaidan, S. (2011). Financial inclusion: Status, issues, challenges and policy in northeastern region. The IUP Journal of Financial Economics, IX (2), 27-40.
[16] Maity, S., & Majumder, A. (2024). A Nationwide Comparative Study on Financial Inclusion through PMJDY. SSRN Electronic Journal.
[17] Panja, G. (2024) Financial Inclusion and its Determinants: A Comparative Analysis in India and West Bengal.
[18] Prasuna, A., Kasturi, A., & Annemalla, R. (2024). Unveiling the factors influencing financial inclusion in India: a comprehensive analysis. Cogent Economics & Finance, 12(1).
[19] Paramasivan, C., & Ganeshkumar, V. (2013). Overview of financial inclusion in India. International Journal of Management and Development Studies, Volume, (2).
[20] Rangarajan, C. (2008). Report of the Committee on Financial Inclusion. Government of India, ministry of Finance.
[21] Sethy, S. K., & Goyari, P. (2018). Measuring Financial Inclusion of Indian States: An Empirical Study. Indian Journal of Economics and Development, 14(1), 111.
[22] Sarma, M., & Pais, J. (2010). Financial Inclusion and Development. Journal of International Development, 23(5), 613–628.
[23] Sarma, M. (2008). Index of financial inclusion (No. 215). Working paper.
[24] Yadav, V., Singh, B. P., & Velan, N. (2020). Multidimensional financial inclusion index for Indian states. Journal of Public Affairs, 21(3). Portico.
Cite This Article
  • APA Style

    Sahani, R., Sharmacharjee, R. (2026). Financial Inclusion in Northeast India: A Multidimensional State-Level Analysis Using Sarma’s Distance Method. Innovation Management, 1(2), 85-94. https://doi.org/10.11648/j.im.20260102.12

    Copy | Download

    ACS Style

    Sahani, R.; Sharmacharjee, R. Financial Inclusion in Northeast India: A Multidimensional State-Level Analysis Using Sarma’s Distance Method. Innov. Manag. 2026, 1(2), 85-94. doi: 10.11648/j.im.20260102.12

    Copy | Download

    AMA Style

    Sahani R, Sharmacharjee R. Financial Inclusion in Northeast India: A Multidimensional State-Level Analysis Using Sarma’s Distance Method. Innov Manag. 2026;1(2):85-94. doi: 10.11648/j.im.20260102.12

    Copy | Download

  • @article{10.11648/j.im.20260102.12,
      author = {Ritesh Sahani and Rajat Sharmacharjee},
      title = {Financial Inclusion in Northeast India: A Multidimensional State-Level Analysis Using Sarma’s Distance Method},
      journal = {Innovation Management},
      volume = {1},
      number = {2},
      pages = {85-94},
      doi = {10.11648/j.im.20260102.12},
      url = {https://doi.org/10.11648/j.im.20260102.12},
      eprint = {https://article.sciencepublishinggroup.com/pdf/10.11648.j.im.20260102.12},
      abstract = {Financial inclusion particularly in regions with socio-economic challenges such as Northeast India, is a critical primary driver of social development and economic growth. This study seeks to analyses the financial inclusion across eight North-Eastern states of India- Arunachal Pradesh, Assam, Manipur, Meghalaya, Mizoram, Nagaland, Tripura, Sikkim- by using a multidimensional approach which comprises three key dimensions of financial inclusion: Banking penetration, availability, and usage. Data were collected from secondary sources, including Database on Indian Economy (RBI), NABARD State Focus Papers and Census data. As the sample size is small and low correlation among variables, Principal Component Analysis (PCA) was not suited. Therefore, the study uses Sarma’s distance method (2008) to construct Financial Inclusion Index (FII) for eight states. The result of the study reveals significant disparities across states: Sikkim (FII= 0.58) and Mizoram (FII= 0.523) show high financial inclusion among the eight states and fall in medium inclusion category, because of robust banking access and penetration, while Nagaland (FII= 0.16), and Arunachal Pradesh (FII= 0.273), and Meghalaya (FII=0.192) display low financial inclusion, which reflects limited banking infrastructure and usage. Assam, Manipur, and Tripura fall in medium financial inclusion. The findings of the study underline the need of effective policy in lagging states to improve access and usage of financial services. The study contributes to the existing knowledge by providing a comparative state-level analysis of financial inclusion in North-East India, which helps policymakers, financial institutions and researchers in designing financial inclusion strategies.},
     year = {2026}
    }
    

    Copy | Download

  • TY  - JOUR
    T1  - Financial Inclusion in Northeast India: A Multidimensional State-Level Analysis Using Sarma’s Distance Method
    AU  - Ritesh Sahani
    AU  - Rajat Sharmacharjee
    Y1  - 2026/04/24
    PY  - 2026
    N1  - https://doi.org/10.11648/j.im.20260102.12
    DO  - 10.11648/j.im.20260102.12
    T2  - Innovation Management
    JF  - Innovation Management
    JO  - Innovation Management
    SP  - 85
    EP  - 94
    PB  - Science Publishing Group
    SN  - 3071-5377
    UR  - https://doi.org/10.11648/j.im.20260102.12
    AB  - Financial inclusion particularly in regions with socio-economic challenges such as Northeast India, is a critical primary driver of social development and economic growth. This study seeks to analyses the financial inclusion across eight North-Eastern states of India- Arunachal Pradesh, Assam, Manipur, Meghalaya, Mizoram, Nagaland, Tripura, Sikkim- by using a multidimensional approach which comprises three key dimensions of financial inclusion: Banking penetration, availability, and usage. Data were collected from secondary sources, including Database on Indian Economy (RBI), NABARD State Focus Papers and Census data. As the sample size is small and low correlation among variables, Principal Component Analysis (PCA) was not suited. Therefore, the study uses Sarma’s distance method (2008) to construct Financial Inclusion Index (FII) for eight states. The result of the study reveals significant disparities across states: Sikkim (FII= 0.58) and Mizoram (FII= 0.523) show high financial inclusion among the eight states and fall in medium inclusion category, because of robust banking access and penetration, while Nagaland (FII= 0.16), and Arunachal Pradesh (FII= 0.273), and Meghalaya (FII=0.192) display low financial inclusion, which reflects limited banking infrastructure and usage. Assam, Manipur, and Tripura fall in medium financial inclusion. The findings of the study underline the need of effective policy in lagging states to improve access and usage of financial services. The study contributes to the existing knowledge by providing a comparative state-level analysis of financial inclusion in North-East India, which helps policymakers, financial institutions and researchers in designing financial inclusion strategies.
    VL  - 1
    IS  - 2
    ER  - 

    Copy | Download

Author Information