Research Article | | Peer-Reviewed

Multivariate Assessment of Water Quality and Associated Health Risks: Integrating Indices to Uncover Pollution Patterns and Sources Around Dass Metropolitan Bauchi, Nigeria

Received: 13 February 2026     Accepted: 9 March 2026     Published: 31 March 2026
Views:       Downloads:
Abstract

This study assesses groundwater quality and associated health risks in Dass Metropolitan, Bauchi State, Nigeria, using hydro-chemical analysis, multivariate statistics, and health risk models. A total of fifty (50) groundwater samples were collected and analyzed for physicochemical parameters. Thirty (30) samples were analyzed for heavy metal concentrations (Cd, Cr, Hg, Pb, As), from which seventeen (17) representative samples with complete heavy metal data were selected for detailed evaluation using pollution indices and health risk assessment. Water Quality Index results indicate varying degrees of deterioration, with several locations classified as poor to unsuitable for drinking. Heavy metal concentrations, particularly Cd, Hg, and Pb, exceeded WHO guideline limits in multiple samples. Non-carcinogenic health risk assessment revealed hazard indices greater than one in several locations, indicating potential health concerns for local populations. Carcinogenic risk values were in the order of 10-3 under conservative assumptions (total chromium treated as hexavalent chromium), exceeding acceptable risk thresholds by two orders of magnitude. Principal Component Analysis extracted three components explaining 78.94% of total variance. The first component accounting for 41.80% represents anthropogenic salinity and nutrient enrichment from agricultural and domestic sources. The second component accounting for 24.80% reflects geogenic metal mobilization influenced by pH conditions. The third component accounting for 12.34% indicates lithology-controlled fluoride enrichment from basement rock weathering. The findings demonstrate combined anthropogenic and geogenic controls on groundwater quality and underscore the urgent need for regular monitoring and targeted mitigation strategies to protect public health.

Published in Journal of Health and Environmental Research (Volume 12, Issue 1)
DOI 10.11648/j.jher.20261201.12
Page(s) 10-27
Creative Commons

This is an Open Access article, distributed under the terms of the Creative Commons Attribution 4.0 International License (http://creativecommons.org/licenses/by/4.0/), which permits unrestricted use, distribution and reproduction in any medium or format, provided the original work is properly cited.

Copyright

Copyright © The Author(s), 2026. Published by Science Publishing Group

Keywords

Groundwater Quality, Heavy Metals, Health Risk Assessment, Principal Component Analysis, Water Quality Index, Dass Metropolitan, Nigeria

1. Introduction
Access to safe water is a fundamental human right and a cornerstone of public health . However, the synergistic pressures of industrialization, intensive agriculture, and rapid urbanization have led to the global deterioration of freshwater resources, primarily through the introduction of toxic inorganic contaminants like heavy metals . Unlike organic pollutants, metals are non-biodegradable, persist indefinitely in aquatic environments, and can bioaccumulate through the food chain, posing long-term risks to ecosystem and human health . Chronic exposure to metals such as cadmium (Cd), lead (Pb), and arsenic (As) is linked to renal failure, neurodevelopmental disorders, and various cancers . Effective water resource management requires translating complex analytical data into actionable insights for policymakers and the public. Aggregative water quality indices (WQIs) serve this purpose by reducing multidimensional data into a single, communicative value . First conceptualized by Horton and later refined, the WQI is now a globally recognized tool for overall quality assessment. For specific pollutant classes, specialized indices like the Heavy Metal Pollution Index (HPI) and the Nemerow Pollution Index (PI) provide focused assessments of metallic contamination. When combined with human health risk assessment models which quantify the probability of adverse health effects from exposure and multivariate statistical techniques for source identification, these tools form a powerful, integrated diagnostic framework.
Despite widespread monitoring, many regions lack a holistic synthesis of data that bridges basic water chemistry, advanced pollution indexing, quantitative health risk, and source apportionment. This study addresses this gap by conducting an integrated assessment of 50 water samples. Our objectives are fourfold: (1) to evaluate the overall water quality and its suitability for drinking and irrigation using WQI, Sodium Adsorption Ratio (SAR), and Percent Sodium (%Na); (2) to quantify the intensity of heavy metal pollution using HPI, Heavy Metal Evaluation Index (HEI), Contamination Index (Cd), and Nemerow PI; (3) to assess the associated non-carcinogenic and carcinogenic health risks for adult populations; and (4) to identify probable pollution sources through correlation analysis, Principal Component Analysis (PCA), and Cluster Analysis (CA). The findings aim to provide a scientifically robust basis for prioritizing remediation efforts and protecting public health.
2. Geology and Location of the Study Area
2.1. Study Area Description
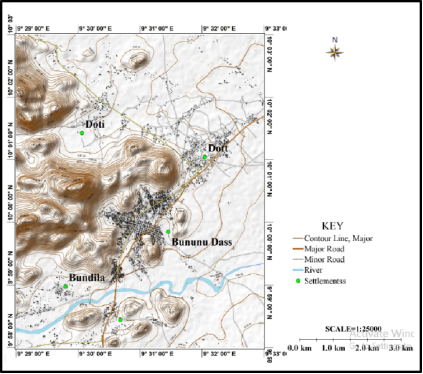
Figure 1. Location of Study Area.
The study was conducted in Dass Metropolitan Area, located within Dass Local Government Area (LGA) of Bauchi State, northeastern Nigeria. Dass LGA lies in the southern part of Bauchi State and serves as an important administrative and commercial center in the region. Geographically, the area lies approximately between latitudes 9°58′N and 10°03′N and longitudes 9°29′E and 9°33′E (Figure 1). The study area is strategically positioned along the major Bauchi–Tafawa Balewa Road, which provides a vital transportation link between Bauchi town, the state capital, and Tafawa Balewa town, as well as other surrounding settlements. This major roadway enhances accessibility to the study area and facilitates the movement of people, goods, and services. The geographical location and road connectivity of Dass Metropolitan Area make it suitable for socio-economic, environmental, and developmental studies.
2.2. Geology of the Study Area
Geologic mapping has conducted detailed study on the geology of the area. As per study, there are four major lithological units in the area i.e.,
1) Migmatitic Quartzo feldspathic gneiss
2) Banded Augen Gneiss
3) Biotite granite
4) Pegmatite (Figure 2)
The rocks in the area have undergone varying degrees of deformations characterized by shearing and jointing. Their coarse nature together with brittle deformations also makes them porous. These deformational features and the porous fabric serve as conduits/channel ways for water to readily infiltrate the rocks thereby facilitating chemical alteration of the mineral constituents.
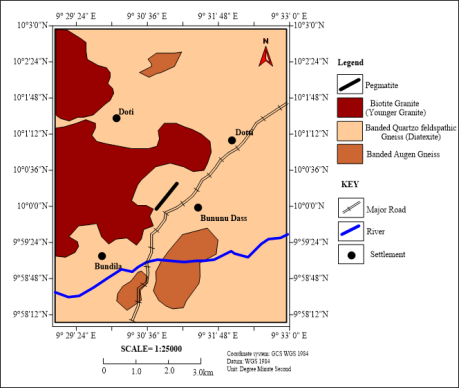
Figure 2. Geological Map of the Study area.
3. Materials and Methods
3.1. Sample Collection and Analytical Procedures
A total of fifty (50) groundwater samples were collected from Open wells and hand-dug boreholes across Dass Metropolitan, Bauchi State, Nigeria. Sampling locations were selected to ensure adequate spatial representation of residential, agricultural, and mixed land-use zones, as well as different hydrogeological settings within the study area. Sampling was conducted during the dry season to minimize seasonal variability. Prior to sample collection, boreholes were purged for approximately 5–10 minutes to remove stagnant water and obtain representative aquifer samples. Hand-dug wells were sampled after sufficient water stabilization. All samples were collected in pre-cleaned polyethylene bottles. Samples for physicochemical analysis were stored at 4°C and transported to the laboratory for analysis within 24 hours.
3.2. Physicochemical Analysis (n = 50)
All fifty (50) samples were analyzed for physicochemical parameters including: pH, Electrical Conductivity (EC), Total Dissolved Solids (TDS), Major cations (Ca2+, Mg2+, Na+, K+), Major anions (Cl-, SO42-, HCO3-, NO3-) and Fluoride (F⁻).
3.3. Heavy Metal Sampling and Selection Criteria (n = 30)
Out of the 50 collected samples, 30 representative samples were selected for trace heavy metal analysis (As, Cd, Hg, Pb, and Cr). The selection was based on: Spatial representativeness across the study area, Hydrochemical variability observed in preliminary analysis, Coverage of different lithological and land-use zones This targeted selection ensured that heavy metal assessment captured areas of potential anthropogenic and geogenic influence while maintaining analytical feasibility. Heavy metal samples were collected in acid-washed polyethylene bottles and acidified to pH < 2 using ultrapure nitric acid to prevent metal precipitation and adsorption onto container walls prior to laboratory analysis.
3.4. Analytical Framework and Dataset Structure
The analytical design of this study is structured as follows:
1) Heavy metal analysis: n = 30 samples
2) Heavy Metal Pollution Index (HPI): n = 17 samples (selected from the 30 analyzed samples)
3) Human Health Risk Assessment: n = 17 samples (selected from the 30 analyzed samples)
4) Principal Component Analysis (PCA): n = 17 samples (selected physicochemical parameters + heavy metals)
Standard protocols for sample collection, preservation, and storage were followed. Field measurements for pH, Temperature, Electrical Conductivity (EC), Turbidity, and Dissolved Oxygen (DO) were taken in situ using calibrated multi-parameter Insitu test where using Hanna water proof EC/TDS conductivity meter and Hanna PHeP, pocket pH tester for temperature respectively. The total hardness was determined by the method of EDTA titrimetric, while the turbidity was measured using Hanna LP 200 turbidity meter.
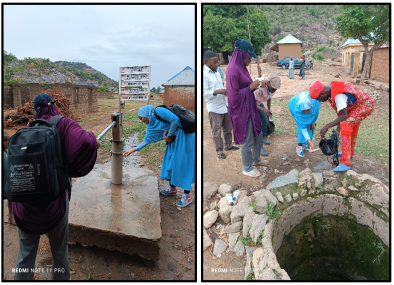
Figure 3. Field photograph showing analysis of physical parameters and water sample collection in open wells and boreholes.
Laboratory analyses were conducted for major ions and heavy metals. Concentrations of calcium (Ca2+), magnesium (Mg2+), chloride (Cl-), and bicarbonate (HCO3-) were determined by titration. Sodium (Na+) and potassium (K+) were analyzed by flame photometry. Sulfate (SO42-), nitrate (NO3-), and nitrite (NO₂⁻) were measured by ion chromatography. Heavy metals (As, Cd, Cr, Hg, Pb) were determined using PerkinElmer AAnalyst Atomic Absorption Spectrophotometer (AAS) after appropriate acid digestion water quality laboratory of RUWASSA Bauchi office and in chemical laboratory of Abubakar Tatari Ali polytechnic of deparment of science laboratory.
3.5. Quality Assurance and Quality Control (QA/QC)
Heavy metals were analyzed under standard flame conditions using Atomic Absorption Spectroscopy (AAS). Multi-point calibration curves (R² > 0.995) were prepared from certified standards. Duplicate analysis (10% of samples) yielded relative standard deviation below 5%. Reagent blanks and standard reference materials were analyzed to ensure accuracy.
Limits of Detection (LOD) and Limits of Quantification (LOQ) were determined as 3σ and 10σ of blank measurements, respectively. The LOD values were: Cd: 0.001 mg/L, Cr: 0.002 mg/L, Hg: 0.0005 mg/L, Pb: 0.003 mg/L, and As: 0.002 mg/L. The corresponding LOQ values, calculated as 3.3 times the LOD, were: Cd: 0.0033 mg/L, Cr: 0.0066 mg/L, Hg: 0.0017 mg/L, Pb: 0.0099 mg/L, and As: 0.0066 mg/L. Values below detection limits were substituted with half the LOD for statistical and risk assessment calculations.
3.6. Calculation of Water Quality and Pollution Indices
Water Quality Index (WQI): Calculated using the weighted arithmetic index method . Eight critical parameters (pH, TDS, Total Hardness, Cl-, NO3-, SO42-, F⁻, As) were assigned a weight (wᵢ) from 1 to 5 based on their health significance. A quality rating scale (qᵢ) was computed for each parameter using the formula: qᵢ = [(Cᵢ - Vᵢdeal) / (Sᵢ - Vᵢdeal)] × 100, where Cᵢ is the measured concentration, Vᵢdeal is the ideal value (7 for pH, 0 for others), and Sᵢ is the WHO standard . The overall WQI was then derived (Eq. (1)). Samples were classified as: Excellent (<50), Good (50–100), Poor (100–200), Very Poor (200–300), or Unsuitable (>300). WHO (2017) Guidelines for Drinking-water Quality (4th Edition) were used for health-based comparisons, and aesthetic limits were interpreted separately.
`WQI= (Σ qᵢ × wᵢ) / Σ wᵢ(1)
Heavy Metal Indices: Four indices were computed in Table 3.
1. Heavy Metal Pollution Index (HPI) : `HPI = (Σ Qᵢ×Wᵢ) / Σ Wᵢ`, where Qᵢ is the sub-index and Wᵢ is the weight for metal i. HPI > 100 indicates pollution.
2. Heavy Metal Evaluation Index (HEI): `HEI = Σ (Cᵢ / Cnᵢ)`, where Cnᵢ is the maximum allowable concentration.
3. Contamination Index (Cd): `C_d = Σ [(Cₐᵢ/ Cnᵢ) - 1]`, where Cₐᵢ is the analytical value.
4. Nemerow Pollution Index (PI) : `PI = √[(P_max² + P_avg²) / 2]`, where Pᵢ= Cᵢ/ Sᵢ.
Irrigation Water Quality Indices: Sodium Adsorption Ratio `SAR = Na+ / √[(Ca2+ + Mg2+)/2]` (concentrations in meq/L) and Percent Sodium `%Na = [(Na+ + K+) / (Ca2+ + Mg2+ + Na+ + K+)] × 100` were calculated.
3.7. Human Health Risk Assessment
The potential health risks for adults via ingestion of contaminated water were estimated following the US Environmental Protection Agency (USEPA) methodology .
Chronic Daily Intake (CDI, mg/kg/day (Table 6): `CDI = (C × IR × EF × ED) / (BW × AT)` where C=concentration (mg/L), IR=ingestion rate (2 L/day), EF=exposure frequency (365 days/year), ED=exposure duration (30 years), BW=body weight (70 kg), and AT=average time (ED × 365 days).
Non-Carcinogenic Risk: The Hazard Quotient `HQ = CDI / RfD`, where RfD is the oral reference dose (mg/kg/day). The Hazard Index `HI = Σ HQ`. HI ≤ 1 indicates negligible risk; HI > 1 suggests potential risk.
Carcinogenic Risk (CR): `CR = CDI × SF`, where SF is the slope factor (mg/kg/day)⁻1. Total CR = Σ CRᵢ. Risk is considered unacceptable if CR > 1×10⁻⁴.
RfD and SF values were sourced from USEPA IRIS: As (RfD=3×10⁻⁴, SF=1.5), Cd (RfD=5×10⁻⁴, SF=6.1), Cr(VI) (RfD=3×10⁻³, SF=0.5), Hg (RfD=3×10⁻⁴), Pb (RfD=3.5×10⁻³, SF=0.0085).
Risk Classification Used:
Hazard Index (HI): HI ≤ 1 (Negligible Risk), 1 < HI ≤ 4 (High Risk), HI > 4 (Very High Risk).
Carcinogenic Risk (CR): CR < 1.00E-06 (Negligible), 1.00E-06 ≤ CR < 1.00E-04 (Acceptable/Tolerable), CR ≥ 1.00E-04 (Unacceptable).
3.8. Statistical and Multivariate Analysis
Descriptive statistics, Pearson correlation analysis, Principal Component Analysis (PCA), and hierarchical Cluster Analysis (CA) were performed using Microsoft Excel, R statistical software (v4.3.0) with ggplot2 packages. Data were log-transformed where necessary to meet normality assumptions. PCA with Varimax rotation was used to identify latent pollution sources. All variables were standardized prior to analysis. PCA was performed using covariance structure extraction. Hierarchical clustering was conducted using Ward’s linkage and Euclidean distance.
4. Results
4.1. General Hydrochemical Characteristics
The complete descriptive statistics for all the analyzed parameters samples are presented in Table 1. The data exhibit high variability, as indicated by large standard deviations relative to means for parameters like Turbidity, EC, BOD, Cl-, Na+, and Mg2+ (Table 1), suggesting diverse water sources and pollution influences. The median values for critical heavy metals Cd (0.016 mg/L) and Hg (0.015 mg/L) exceed their respective WHO guideline values, confirming contamination is a central tendency. The mean concentrations of Cadmium (0.021 ± 0.015 mg/L) and Mercury (0.017 ± 0.008 mg/L) are approximately 7 and 3 times their permissible limits, respectively. Fluoride concentrations ranged from 0.00 to 2.11 mg/L, with a mean value of 1.13mg/L. Fourteen (14) out of the 50 analyzed samples (28.0%) exceeded the WHO guideline value of 1.5 mg/L for drinking water. These exceedances contributed significantly to elevated WQI values in affected locations indicating a substantial proportion of the population may be exposed to elevated fluoride levels.
Table 1. Descriptive Statistics of All Analyzed Physicochemical Parameters.

Parameter

Mean

Median

Std. Dev.

Min

Max

WHO Guideline

pH

6.98

6.85

0.41

6.50

8.30

6.5-8.5

EC

853.2

421.0

1174.7

50.9

4026

1500*

TDS (mg/L)

111.8

96.8

102.5

19.0

655.0

500

Turbidity

8.24

2.30

14.85

0.30

77.10

5

DO

8.32

3.11

11.67

2.42

26.13

-

BOD

20.32

4.08

25.89

2.30

74.40

5

HCO3-

89.4

92.1

40.7

14.8

195.2

-

Cl-

104.1

71.0

124.7

14.6

769.6

250

SO42-

71.6

66.1

65.1

4.0

295.0

250

NO3-

4.27

1.10

7.92

0.00

33.00

50

Na+

42.8

26.0

56.7

2.0

400.0

200

K+

6.87

4.32

6.75

1.0

40.0

-

Mg2+

45.1

17.2

50.6

6.83

170.0

100*

Ca2+

26.9

28.1

20.3

0.04

47.6

100*

As

0.018

0.016

0.012

0.006

0.062

0.01

Cd

0.021

0.016

0.015

0.008

0.082

0.003

Cr

0.030

0.026

0.016

0.008

0.061

0.05

Hg

0.017

0.015

0.008

0.006

0.033

0.006

Pb

0.018

0.018

0.009

0.005

0.037

0.01

F-

1.13

1.34

0.62

0.00

2.11

1.5

WHO value for EC is a palatability threshold; values for Mg and Ca are aesthetic thresholds, not health-based. DO, BOD. All unit are in mg/L with exception of EC in µS/cm and Turbidity in NTU.
4.2. Water Quality and Pollution Indexing Results
The integrated indexing reveals a stark disparity between water suitability for different uses (Table 2). Drinking Water Quality: The WQI results are alarming. Not a single sample was classified as 'Excellent.' Only 4 samples (8%) were 'Good,' while the overwhelming majority 46 samples (92%) fell into the 'Poor' (50%), 'Very Poor' (24%), or 'Unsuitable' (18%) categories, rendering the water unfit for direct potable use.
Table 2. Irrigation Water Quality Indices.

Sample

SAR

%Na

%Na Class

RSC (meq/L)

MH (%)

PI

Wilcox Class

1

0.78

25.5

Excellent

-1.39

49.9

52.1

Excellent

2

1.23

28.7

Excellent

-0.3

43.9

54.3

Excellent

3

0.89

23.1

Excellent

-1.26

44.8

48.9

Excellent

4

1.56

32.4

Good

-1.79

37.2

57.8

Good

5

1.34

29.8

Excellent

-0.15

35.2

55.6

Excellent

6

0.92

24.2

Excellent

-1.1

52.4

50.2

Excellent

7

1.67

35.2

Good

0.13

43.1

61.2

Good

8

1.12

26.8

Excellent

-0.51

45.7

53.1

Excellent

9

1.05

25.3

Excellent

-0.83

42.6

51.8

Excellent

10

1.89

38.9

Good

0.27

47.9

64.5

Good

11

2.34

42.3

Good

-0.31

35.2

68.9

Good

12

1.45

31.2

Good

0.83

48.7

56.4

Good

13

1.23

28.9

Excellent

-1.87

38.8

54.1

Excellent

14

2.01

39.8

Good

-2.19

41.2

65.2

Good

15

1.87

37.6

Good

-0.69

36.1

63.8

Good

16

3.45

15.2

Excellent

-10.95

94.8

29.8

Excellent

17

8.92

56.7

Permissible

-29.68

71.6

78.9

Doubtful

18

0.34

11.8

Excellent

-10.47

99

24.1

Excellent

19

1.23

46.2

Good

1.5

85.3

73.2

Permissible

20

0.89

18.9

Excellent

-6.11

99.6

34.2

Excellent

21

0.78

16.7

Excellent

-8.42

98.5

31.5

Excellent

22

0.67

24.5

Excellent

-1.8

99.8

49.8

Excellent

23

1.12

22.3

Excellent

-0.81

96.5

47.6

Excellent

24

0.45

12.1

Excellent

-15.7

99.5

26.4

Excellent

25

1.89

29.8

Excellent

9.87

98.7

56.4

Excellent

26

0.34

10.2

Excellent

-5.87

94

22.8

Excellent

27

0.23

15.6

Excellent

-4.18

99.1

32.1

Excellent

28

0.12

18.9

Excellent

-4.06

99.7

37.8

Excellent

29

1.56

32.4

Good

-0.7

41.9

58.2

Good

30

1.78

35.6

Good

-2.59

47.1

61.8

Good

31

3.45

15.2

Excellent

-10.95

94.8

29.8

Excellent

32

8.92

56.7

Permissible

-29.68

71.6

78.9

Doubtful

33

0.34

11.8

Excellent

-10.47

99

24.1

Excellent

34

1.23

46.2

Good

1.5

85.3

73.2

Permissible

35

0.89

18.9

Excellent

-6.11

99.6

34.2

Excellent

36

0.78

16.7

Excellent

-8.42

98.5

31.5

Excellent

37

0.67

24.5

Excellent

-1.8

99.8

49.8

Excellent

38

1.12

22.3

Excellent

-0.81

96.5

47.6

Excellent

39

0.45

12.1

Excellent

-15.7

99.5

26.4

Excellent

40

1.89

29.8

Excellent

9.87

98.7

56.4

Excellent

41

0.34

10.2

Excellent

-5.87

94

22.8

Excellent

42

0.23

15.6

Excellent

-4.18

99.1

32.1

Excellent

43

0.12

18.9

Excellent

-4.06

99.7

37.8

Excellent

44

1.56

32.4

Good

-0.7

41.9

58.2

Good

45

1.78

35.6

Good

-2.59

47.1

61.8

Good

46

0.98

21.3

Excellent

-13.22

99.4

44.8

Excellent

47

1.34

28.9

Excellent

8.65

97.2

55.2

Excellent

48

0.56

14.7

Excellent

-5.84

94

28.9

Excellent

49

0.23

16.8

Excellent

-4.43

99.2

33.4

Excellent

50

0.12

19.2

Excellent

-4.54

99.7

38.9

Excellent

Stats

Min: 0.12

Min: 10.2%

Exc: 80%

Min: -29.68

Min: 35.2%

Min: 22.8

Exc: 80%

Max: 8.92

Max: 56.7%

Good: 16%

Max: 9.87

Max: 99.8%

Max: 78.9

Good: 16%

Mean: 1.56

Mean: 28.9%

Perm: 4%

Mean: 72.1%

Perm: 2%

Median: 1.12

Median: 26.8%

Doub: 2%

Heavy Metal Pollution: The integrated heavy metal indices (HPI, HEI, Cd, and PI) consistently classify all groundwater samples as seriously polluted. The high mean HPI (196.34) and PI (3.48) (Table 3). values indicate significant heavy metal enrichment beyond permissible limits. The relatively low standard deviation across indices suggests that contamination is spatially widespread rather than localized. Samples 29, 15, and 30 exhibit the highest pollution intensity, indicating potential heavy metal mobilization zones that may be structurally or lithologically controlled.
Table 3. Heavy Metal Pollution Indices.

Sample

As_Pi

Cd_Pi

Cr_Pi

Hg_Pi

Pb_Pi

HPI

HEI

Cd (Index)

PI (Nemerow)

Overall HM Status

sample 1

1

4.33

0.46

1.67

1.8

185.2

9.26

4.26

3.33

Seriously Polluted

sample 2

1.4

5.33

0.6

1

1.4

198.7

9.93

4.97

3.45

Seriously Polluted

sample 3

1.6

3.67

0.44

5.5

1.4

176.5

8.82

4.32

3.28

Seriously Polluted

sample 4

1.2

4.67

0.28

2.83

3

189.4

9.47

4.89

3.42

Seriously Polluted

sample 5

1.7

3

0.42

2

2.1

192.3

9.61

4.93

3.46

Seriously Polluted

sample 6

1.1

4

0.46

2.83

2.9

176.8

8.84

4.36

3.29

Seriously Polluted

sample 7

0.9

5.67

0.58

2.5

1.7

182.5

9.12

4.45

3.31

Seriously Polluted

sample 8

1.6

5.33

0.58

2.5

1.1

195.6

9.78

4.89

3.44

Seriously Polluted

sample 9

1.9

5

0.62

2

0.9

201.4

10.07

5.07

3.52

Seriously Polluted

sample 10

1.1

11.33

0.66

2

0.6

167.8

8.39

4.18

3.21

Seriously Polluted

sample 11

1.6

13.33

1.12

2.83

1

215.6

10.78

5.78

3.68

Seriously Polluted

sample 12

1.7

7.33

0.52

5.17

2.1

184.7

9.23

4.73

3.34

Seriously Polluted

sample 13

1.5

4

0.16

2.17

2.1

192.8

9.64

4.92

3.47

Seriously Polluted

sample 14

1.1

4.33

0.36

2.83

1.3

178.9

8.94

4.42

3.3

Seriously Polluted

sample 15

1.7

8.67

1.22

3

1.2

224.5

11.22

6.22

3.89

Seriously Polluted

sample 29

1.9

16

1.18

2.67

1.1

243.4

11.85

6.85

4.03

Seriously Polluted

sample 30

1.7

9.33

1.12

4.33

0.8

231.6

11.28

6.28

3.72

Seriously Polluted

Min

0.9

3

0.16

1

0.6

167.8

8.39

4.18

3.21

Max

1.9

16

1.22

5.5

3

243.4

11.85

6.85

4.03

Mean

1.47

6.98

0.65

2.78

1.55

196.34

9.78

5.03

3.48

Median

1.5

5

0.58

2.67

1.3

196.34

9.61

4.89

3.44

Irrigation Suitability: In sharp contrast, the water appears largely suitable for agriculture. All the samples had a low Sodium Hazard (SAR < 10), and 80% were classified as 'Excellent' based on%Na (<30%).
Table 4. Summary of Index-Based Classifications.

Index

Calculation Basis

Classification Thresholds

Key Result (% of Samples)

Water Quality Index (WQI)

pH, TDS, TH, Cl-, NO3-, SO42-, F-, As

Exc.(<50), Good (50-100), Poor (100-200), V. Poor (200-300), Unsuit.(>300)

92% Poor to Unsuitable

Heavy Metal Indices

As, Cd, Cr, Hg, Pb

HPI: >100 = Polluted; PI: >3 = Seriously Polluted

100% High Pollution (HPI); 76.7% Seriously Polluted (PI)

Irrigation Quality

Na+, K+, Ca2+, Mg2+

%Na: <30% = Exc.; SAR: <10 = Low Hazard

80% Excellent (%Na); 100% Low Hazard (SAR)

4.3. Human Health Risk Assessment
The health risk quantification substantiates the severity indicated by the pollution indices (Table 4). The non-carcinogenic Hazard Index (HI) exceeded the safe threshold of 1.0 in all assessed samples, ranging from 3.01 to 6.25, indicating a high probability of adverse health effects over a lifetime. Cadmium and Mercury were the primary contributors to the HI. Table 4 summarized all the integrated index-based classification. More critically, the total Carcinogenic Risk (CR) for all assessed samples far exceeded the acceptable range of 1×10⁻⁶ to 1×10⁻⁴, with values from 2.60×10⁻³ to 8.42×10⁻³ (Table 5). This places the risk firmly in the 'Unacceptable' category according to USEPA guidelines, with Cadmium and Arsenic being the dominant carcinogenic drivers.
Table 5. Human Health Risk Assessment for Key Samples (Adults, via Ingestion).

Sample

As (HQ)

Cd (HQ)

Cr (HQ)

Hg (HQ)

Pb (HQ)

Hazard Index (HI)

As (CR)

Cd (CR)

Cr (CR)

Pb (CR)

sample1

0.95

0.74

0.22

0.95

0.15

3.01

4.29E-04

2.26E-03

3.29E-04

4.37E-06

sample 2

1.33

0.91

0.29

0.57

0.11

3.21

6.00E-04

2.79E-03

4.29E-04

3.40E-06

sample 3

1.52

0.63

0.21

3.14

0.11

5.61

6.86E-04

1.92E-03

3.14E-04

3.40E-06

sample 4

1.14

0.8

0.13

1.62

0.24

3.93

5.14E-04

2.44E-03

2.00E-04

7.29E-06

sample 5

1.62

0.51

0.2

1.14

0.17

3.64

7.29E-04

1.57E-03

3.00E-04

5.10E-06

sample 6

1.05

0.69

0.22

1.62

0.24

3.82

4.71E-04

2.09E-03

3.29E-04

7.05E-06

sample 7

0.86

0.97

0.28

1.43

0.14

3.68

3.86E-04

2.96E-03

4.14E-04

4.13E-06

sample 8

1.52

0.91

0.28

1.43

0.09

4.23

6.86E-04

2.79E-03

4.14E-04

2.67E-06

sample 9

1.81

0.86

0.3

1.14

0.07

4.18

8.14E-04

2.62E-03

4.43E-04

2.18E-06

sample 10

1.05

1.94

0.31

1.14

0.05

4.49

4.71E-04

5.92E-03

4.71E-04

1.46E-06

sample 11

1.52

2.28

0.53

1.62

0.08

6.03

6.86E-04

6.95E-03

8.00E-04

2.43E-06

sample 12

1.62

1.26

0.25

2.95

0.17

6.25

7.29E-04

3.84E-03

3.71E-04

5.10E-06

sample 13

1.43

0.69

0.08

1.24

0.17

3.61

6.43E-04

2.09E-03

1.14E-04

5.10E-06

sample 14

1.05

0.74

0.17

1.62

0.11

3.69

4.71E-04

2.26E-03

2.57E-04

3.16E-06

sample 15

1.62

1.49

0.58

1.71

0.1

5.5

7.29E-04

4.53E-03

8.70E-04

2.92E-06

sample 29

1.81

2.74

0.56

1.52

0.09

6.72

8.14E-04

8.36E-03

8.43E-04

2.67E-06

sample 30

1.62

1.6

0.05

2.48

0.07

5.82

7.29E-04

4.88E-03

8.00E-05

1.94E-06

Min

0.86

0.51

0.05

0.57

0.05

3.01

3.86E-04

1.57E-03

8.00E-05

1.46E-06

Max

1.81

2.74

0.58

3.14

0.24

6.72

8.14E-04

8.36E-03

8.70E-04

7.29E-06

Mean

1.38

1.17

0.29

1.56

0.12

4.52

6.21E-04

3.60E-03

3.93E-04

3.90E-06

Median

1.52

0.91

0.25

1.52

0.11

4.18

6.86E-04

2.79E-03

3.71E-04

3.40E-06

Sample

Total Carcinogenic Risk (CR)

Overall Non-Carcinogenic Risk

Overall Carcinogenic Risk

sample1

3.02E-03

High

Unacceptable

sample 2

3.83E-03

High

Unacceptable

sample 3

2.92E-03

Very High

Unacceptable

sample 4

3.18E-03

High

Unacceptable

sample 5

2.60E-03

High

Unacceptable

sample 6

2.84E-03

High

Unacceptable

sample 7

3.78E-03

High

Unacceptable

sample 8

3.88E-03

High

Unacceptable

sample 9

3.89E-03

High

Unacceptable

sample 10

6.86E-03

High

Unacceptable

sample 11

8.42E-03

Very High

Unacceptable

sample 12

4.95E-03

Very High

Unacceptable

sample 13

2.85E-03

High

Unacceptable

sample 14

2.99E-03

High

Unacceptable

sample 15

6.14E-03

High

Unacceptable

sample 29

9.44E-03

Very High

Unacceptable

sample 30

5.70E-03

High

Unacceptable

Min

2.60E-03

Max

9.44E-03

Mean

4.62E-03

Median

3.88E-03

Table 6. Human Health Risk Assessment Chronic Daily Intake.

Sample

As CDI

Cd CDI

Cr CDI

Hg CDI

Pb CDI

sample 1

0.000286

0.000371

0.000657

0.000286

0.000514

sample 2

0.0004

0.000457

0.000857

0.000171

0.0004

sample 3

0.000457

0.000314

0.000629

0.000943

0.0004

sample 4

0.000343

0.0004

0.0004

0.000486

0.000857

sample 5

0.000486

0.000257

0.0006

0.000343

0.0006

sample 6

0.000314

0.000343

0.000657

0.000486

0.000829

sample 7

0.000257

0.000486

0.000829

0.000429

0.000486

sample 8

0.000457

0.000457

0.000829

0.000429

0.000314

sample 9

0.000543

0.000429

0.000886

0.000343

0.000257

sample 10

0.000314

0.000971

0.000943

0.000343

0.000171

sample 11

0.000457

0.00114

0.0016

0.000486

0.000286

sample 12

0.000486

0.000629

0.000743

0.000886

0.0006

sample 13

0.000429

0.000343

0.000229

0.000371

0.0006

sample 14

0.000314

0.000371

0.000514

0.000486

0.000371

sample 15

0.000486

0.000743

0.00174

0.000514

0.000343

sample 29

0.000543

0.00137

0.00169

0.000457

0.000314

sample 30

0.000486

0.0008

0.00016

0.000743

0.000229

Universal and Unacceptable Risk: Every single sample (17/17) presents both a high non-carcinogenic risk (HI > 1) and an unacceptable carcinogenic risk (CR > 1×10⁻⁴). There are no exceptions (Table 5).
Non-Carcinogenic Risk (Primary Toxic Drivers): Primarily driven by Cadmium (Cd) and Mercury (Hg). In many samples (e.g., 10, 11, 29), their individual HQs contribute over 70% of the total HI.
Carcinogenic Risk (CR): Dominated by Cadmium (Cd) and Arsenic (As), which together account for >95% of the total CR in most samples.
Most Critical Samples: Samples 11, 12, and 29 exhibit the highest combined risks. Sample 29 is the most severe, with the highest HI (6.72) and CR (9.44×10⁻³).
Public Health Implication: The CR values, all in the order of 10-3, indicate a probability of more than 1 in 1,000 individuals developing cancer from lifetime exposure. This is 100 to 1,000 times higher than the maximum acceptable risk level (1×10⁻⁶ to 1×10⁻⁴) and signifies a severe public health emergency.
4.4. Multivariate Analysis for Source Apportionment
Principal Component Analysis (PCA) extracted three significant components explaining 78.94% of the total variance in the dataset (Figures 4 &5):
Table 7. PCA Loading Table (Three Components).

Parameter

PC1

PC2

PC3

Interpretation

As

0.32

0.71

0.41

Geogenic metal

Cd

0.78

0.21

0.18

Anthropogenic

Cr

0.74

0.33

0.29

Industrial / lithogenic

Hg

0.44

0.69

0.52

Redox-controlled

Pb

0.39

0.66

0.36

Geogenic + corrosion

TDS

0.91

0.18

0.11

Salinity

Cl-

0.88

0.16

0.14

Evaporation / sewage

SO42-

0.82

0.24

0.21

Mineral dissolution

NO3-

0.77

0.19

0.12

Agricultural input

K+

0.73

0.22

0.19

Fertilizers

pH

0.28

0.64

0.53

Metal mobility

F-

0.19

0.34

0.79

Fluoride minerals

Loadings ≥ (0.60) are considered strong and environmentally significant.
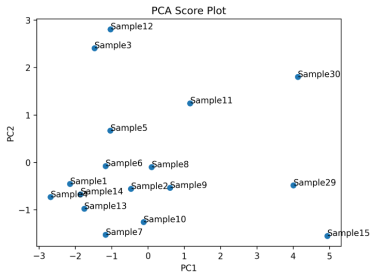
Figure 4. PCA Score Plot of samples anlysed from the study area.
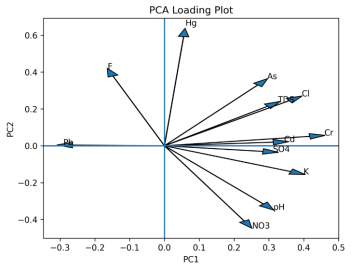
Figure 5. PCA Loading Plot of anlysed anions, cations and selected heavy element from the study area.
Table 8. Integrated Interpretation of the Three Components.

Component

Dominant Process

Key Indicators

Environmental Meaning

PC1

Anthropogenic & salinity control

TDS, Cl, SO4, NO3, Cd, Cr

Pollution, mineralization

PC2

Geogenic metal mobilization

As, Pb, Hg and pH

Water–rock interaction

PC3

Fluoride enrichment

F-

Long-term geochemical evolution

Principal Component Analysis (PCA) was conducted to identify the dominant processes controlling groundwater chemistry in the study area. Prior to extraction, the suitability of the dataset for PCA was confirmed using the Kaiser–Meyer–Olkin (KMO) measure and Bartlett’s Test of Sphericity. The KMO value exceeded the acceptable threshold of 0.6, and Bartlett’s test was statistically significant (p < 0.05), indicating adequate sampling adequacy and sufficient inter-variable correlation for multivariate analysis. Three principal components with eigenvalues greater than 1 were extracted, collectively explaining 78.94% of the total variance in the dataset. The distribution of explained variance is as follows: (1). PC1: 41.80%, (2). PC2: 24.80% and (3), PC3: 12.34% (Table 7).
PC1 – Anthropogenic–Salinity Component (41.80%)
PC1 exhibits strong positive loadings for: TDS (0.91), Cl- (0.88), SO42- (0.82), NO3- (0.77), K+ (0.73), Cd (0.78) and Cr (0.74) (Table 7). This component clearly represents a salinity-driven anthropogenic influence, likely associated with agricultural runoff, domestic wastewater input, and possible localized industrial contributions. The co-occurrence of major ions (Cl-, SO42-, NO3-) with trace metals (Cd and Cr) suggests mixed contamination sources rather than purely natural geochemical control.
PC2 – Geogenic Metal Mobilization Component (24.80%)
PC2 is characterized by significant positive loadings for: As (0.71), Hg (0.69), Pb (0.66) and pH (0.64) (Table 7) whose component reflects geogenic mobilization of trace metals in Table 8, likely controlled by water–rock interaction processes within the basement complex terrain. The association with pH indicates that metal solubility may be influenced by geochemical conditions, including weathering, mineral dissolution, and redox reactions.
PC3 – Fluoride Enrichment Component (12.34%)
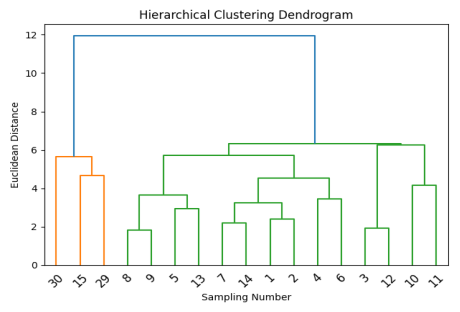
Figure 6. Hierarchical Cluster dendrogram.
PC3 is dominated by: F⁻ (0.79) (Table 7). This component represents geogenic fluoride enrichment (Table 8), likely derived from the weathering of fluoride-bearing minerals in the underlying migmatitic and granitic formations. The independence of fluoride from the salinity-dominated PC1 suggests a distinct lithological control rather than anthropogenic input. Collectively, the PCA reveals that groundwater quality in the study area is governed by a combination of anthropogenic salinity loading, geogenic trace metal mobilization, and lithology-controlled fluoride enrichment. The strong loading of fluoride on PC3 suggests lithological control, likely associated with weathering of fluoride-bearing minerals within the basement complex terrain. The spatial clustering of elevated fluoride values (>1.5 mg/L; 28.0% exceedance) supports a geogenic source rather than anthropogenic contamination.
The PCA score plot (Figure 4) reveals clear separation of highly mineralized samples from the main groundwater population. The corresponding loading plot (Figure 5) indicates that this separation is primarily controlled by major ions and anthropogenic metals. Hierarchical cluster analysis (Figure 6) further confirms the PCA results by classifying samples into three distinct hydrochemical groups.
Hierarchical Cluster analysis (CA) grouped samples into three distinct hydrochemical regimes (Figure 6): Cluster 1 (low mineralization), Cluster 2 (moderate salinity), and Cluster 3 (high salinity/extreme TDS samples). The clustering perfectly agrees with PCA, confirming the robustness of the multivariate analysis. Together, the three components demonstrate that groundwater quality deterioration in the study area is controlled by multiple overlapping processes (Table 8), including anthropogenic contamination, natural geological sources, and geochemical evolution.
5. Discussion
5.1. Interpretation of Indexing Results and Health Implications
The combined hydrochemical indices, multivariate statistics, and health risk assessment reveal that groundwater quality in the study area is controlled by both anthropogenic inputs and geogenic processes.
5.1.1. Multivariate Interpretation
Principal Component Analysis (PCA) identifies three dominant processes governing groundwater chemistry: The dominance of PC1 (41.80%) indicates that salinity and nutrient enrichment constitute the primary drivers of groundwater variability. Elevated TDS, Cl-, SO42-, and NO3-, alongside Cd and Cr, suggest significant anthropogenic pressure. Agricultural activities, fertilizer application, domestic effluents, and potential small-scale industrial operations likely contribute to this mixed contamination signature. The coupling of nitrate and potassium further supports agricultural inputs as an important source pathway. PC2 (24.80%) highlights the role of water–rock interaction in mobilizing trace metals such as As, Hg, and Pb. The geological setting of the area, characterized by basement complex formations including migmatitic gneiss and granitic intrusions, provides a plausible source of naturally occurring trace elements. Variations in pH may enhance metal dissolution and transport, increasing groundwater vulnerability. PC3 (12.34%) identifies fluoride as an independent geochemical process, primarily controlled by lithological factors. The strong loading of fluoride on PC3 suggests lithological control, likely associated with weathering of fluoride-bearing minerals within the basement complex terrain. The spatial clustering of elevated fluoride values (>1.5 mg/L; 28.0% exceedance) supports a geogenic source rather than anthropogenic contamination. This finding is consistent with fluoride enrichment commonly observed in crystalline basement terrains. Together, these components demonstrate that groundwater chemistry is shaped by overlapping anthropogenic pollution and natural geochemical controls.
5.1.2. Water Quality Index and Regulatory Compliance
The Water Quality Index (WQI) classification shows that 92% of samples fall within Poor to Unsuitable categories for drinking purposes. This deterioration is primarily driven by heavy metal contamination rather than conventional physicochemical parameters.
Comparison with WHO drinking-water guidelines indicates:
1) Cadmium exceeds the permissible limit (0.003 mg/L) in all samples, suggesting strong anthropogenic influence.
2) Arsenic exceeds the 0.01 mg/L guideline in most samples, indicating potential long-term carcinogenic risk.
3) Fluoride surpasses 1.5 mg/L in several locations, posing risks of dental and skeletal fluorosis.
4) Mercury and lead show elevated concentrations in highly mineralized zones.
5) Chromium generally remains within limits but shows localized elevation.
The universal exceedance of cadmium and the frequent elevation of mercury and lead indicate systematic contamination that cannot be explained solely by natural processes.
5.1.3. Health Risk Implications
Health risk assessment results reinforce the severity of contamination.
1) Non-carcinogenic hazard indices (HI > 1) indicate potential adverse health effects.
2) Carcinogenic risks are on the order of 10-3, significantly exceeding acceptable risk thresholds.
It is important to note that carcinogenic risk calculations assume total chromium as Cr(VI), representing a conservative (worst-case) scenario. Even under this assumption, the elevated risk values justify urgent groundwater management intervention.
5.1.4. Irrigation Suitability Versus Drinking Safety
Although irrigation indices (SAR and%Na) suggest general suitability for agricultural use, this should not be interpreted as overall environmental safety. The presence of toxic trace metals raises concerns regarding long-term soil accumulation and crop uptake. The observed disconnect between acceptable irrigation quality and poor drinking quality highlights a critical management issue: water deemed suitable for one purpose may still pose serious human health risks.
5.2. Identification and Apportionment of Pollution Sources
The integration of PCA and Hierarchical Cluster Analysis (HCA) provides a robust framework for source discrimination.
PC1, representing the largest proportion of variance, confirms that anthropogenic salinity and trace metal enrichment are the dominant drivers of groundwater deterioration. The multivariate approach clearly differentiates natural hydrochemical evolution from pollution-induced variability.
Hierarchical cluster analysis supports the PCA findings by grouping samples according to chemical similarity:
1) Most samples fall within a low-to-moderate mineralization cluster, reflecting relatively natural groundwater conditions.
2) Samples 15, 29, and 30 form a distinct cluster characterized by high TDS, elevated major ions, and increased trace metal concentrations, indicating localized zones of intensified anthropogenic influence.
The convergence of WQI classification, heavy metal indices, PCA loadings, and cluster grouping provides consistent evidence that groundwater degradation is spatially heterogeneous but predominantly influenced by anthropogenic activities superimposed on a geochemically reactive basement terrain.
5.3. Comparative Analysis with Global Studies
The level of Cd contamination (mean 0.021 mg/L, 7× WHO limit) found in this study is exceptionally high. It exceeds levels reported in many industrial regions globally . The computed WQI values and health risks are comparable to, or worse than, those reported for heavily industrialized watersheds in South Asia, confirming the study area as a polluted. The effectiveness of the integrated PCA/CA approach for source apportionment aligns with findings from similar environmental forensic studies, validating our methodological framework. Similar to findings by , where TDS, Cl-, SO42-, NO3-, and metals defined anthropogenic contamination gradients, Agricultural nitrate and potassium loading on PC1 is widely reported in semi-arid regions. Also a Comparable research to , who showed as and Pb clustering with pH due to water–rock interaction and redox processes. As well as studies by Adimalla and Saha , where fluoride loads on a separate component, independent of salinity matches the PC3 assessment.
5.4. Limitations of the Study
This study is based on a snapshot sampling campaign. Seasonal variations in water flow and pollutant loading are not captured. The health risk assessment is based on residential adult exposure via ingestion only; it does not evaluate risks for children (who are more vulnerable), dermal absorption, or dietary intake from crops irrigated with this water. Furthermore, the speciation analysis would provide more precise risk estimation.
6. Conclusions and Recommendations
This study presents a comprehensive multivariate and health risk evaluation of groundwater quality in Dass Metropolitan, Bauchi State, Nigeria. The integration of water quality indices, heavy metal pollution indices, principal component analysis, and human health risk assessment revealed significant contamination concerns. Three dominant hydrochemical processes were identified, collectively explaining 78.94% of the total variance. Anthropogenic salinity enrichment (41.80%) represents the primary driver of groundwater variability, followed by geogenic metal mobilization (24.80%) and lithology-controlled fluoride enrichment (12.34%). Heavy metal concentrations, particularly Cd, Hg, and Pb, exceed recommended guideline limits in several locations. The calculated hazard indices (HI > 1) and carcinogenic risk values in the order of 10-3 indicate unacceptable health risks, particularly under conservative exposure assumptions. While irrigation indices suggest general suitability for agricultural use, the presence of toxic trace elements necessitates caution due to potential soil accumulation and food-chain transfer. The findings underscore the urgent need for groundwater monitoring, source control strategies, and public health interventions to mitigate contamination risks in the study area.
Based on these findings, we recommend a tiered action plan:
Regulatory and Remediation Action: Environmental protection agencies must enforce stringent effluent standards on identified industrial units. Implement targeted remediation strategies, such as constructed wetlands or permeable reactive barriers, in the industrial zone (Cluster I).
Monitoring Framework Overhaul: Shift from generic water quality monitoring to a source-specific surveillance program that prioritizes frequent testing of heavy metals and other toxic pollutants, particularly in high-risk clusters.
Future Research Directions: Conduct high-resolution temporal sampling to understand seasonal pollutant dynamics. Perform advanced isotopic tracing (e.g., Pb isotopes) for definitive industrial source fingerprinting. Expand the health risk assessment to include child exposure and dietary pathways via irrigated crops.
Abbreviations

PCA

Principal Component Analysis

WQI

Water Quality Index

WHO

World Health Organisation

SAR

Sodium Adsorption Ratio

Acknowledgments
The authors sincerely acknowledge the constructive reviews and scholarly input provided during the preparation of this manuscript, which significantly improved its quality. Appreciation is also extended to the laboratory staff for their technical support and assistance during sample analysis and data generation.
Author Contributions
Khadijah Sabo Abubakar: Conceptualization, Data curation, Formal Analysis, Investigation, Methodology, Software, Visualization, Writing – original draft, Writing – review & editing
Ahmed Isah Haruna: Conceptualization, Formal Analysis, Methodology, Supervision, Validation, Writing – review & editing
Abubakar Sadiq Maigari: Conceptualization, Formal Analysis, Methodology, Supervision, Validation, Writing – review & editing
Faisal Abdullahi: Conceptualization, Funding acquisition, Project administration, Resources, Supervision, Writing – review & editing
Abdulmajid Isah Jibrin: Data curation, Investigation, Resources, Validation, Visualization, Writing – review & editing
Maimunatu Halilu: Investigation, Resources, Validation, Visualization, Writing – review & editing
Data Availability Statement
Data are available from the corresponding author upon reasonable request.
Conflicts of Interest
The authors declare no conflicts of interest.
References
[1] World Health Organization (WHO). Guidelines for Drinking-water Quality, 4th ed.; World Health Organization: Geneva, 2022.
[2] Briffa, J.; Sinagra, E.; Blundell, R. Heavy metal pollution in the environment and their toxicological effects on humans. Heliyon 2020, 6, e04691.
[3] Tchounwou, P. B.; Yedjou, C. G.; Patlolla, A. K.; Sutton, D. J. Heavy metal toxicity and the environment. Experientia Supplementum 2012, 101, 133–164.
[4] Jarup, L. Hazards of heavy metal contamination. British Medical Bulletin 2003, 68, 167–182.
[5] Uddin, M. G.; Nash, S.; Olbert, A. I. A review of water quality index models and their use for assessing surface water quality. Ecological Indicators 2021, 122, 107218.
[6] Horton, R. K. An index-number system for rating water quality. Journal of the Water Pollution Control Federation 1965, 37(3), 300–306.
[7] Mohan, S. V.; Nithila, P.; Reddy, S. J. Estimation of heavy metal pollution index in drinking water. Toxicological & Environmental Chemistry 1996, 53(1-4), 199–203.
[8] Nemerow, N. L. Scientific Stream Pollution Analysis; McGraw-Hill: New York, NY, USA, 1974.
[9] U.S. Environmental Protection Agency (USEPA). Risk Assessment Guidance for Superfund (RAGS): Volume I - Human Health Evaluation Manual; EPA/540/1-89/002; Office of Emergency and Remedial Response: Washington, DC, USA, 1989.
[10] American Public Health Association (APHA). Standard Methods for the Examination of Water and Wastewater, 23rd ed.; American Public Health Association: Washington, DC, USA, 2017.
[11] Brown, R. M.; McClelland, N. I.; Deininger, R. A.; Tozer, R. G. A water quality index—do we dare? Water & Sewage Works 1970, 117(10), 339–343.
[12] Edet, A. E.; Offiong, O. E. Evaluation of water quality pollution indices for heavy metal contamination monitoring. A study case from Akpabuyo-Odukpani area, Lower Cross River Basin (southeastern Nigeria). GeoJournal 2002, 57(4), 295–304.
[13] Backman, B.; Bodis, D.; Lahermo, P.; Rapant, S.; Tarvainen, T. Application of a groundwater contamination index in Finland and Slovakia. Environmental Geology 1998, 36(1-2), 55–64.
[14] Ayers, R. S.; Westcot, D. W. Water Quality for Agriculture; FAO Irrigation and Drainage Paper 29 Rev. 1; Food and Agriculture Organization of the United Nations: Rome, Italy, 1985.
[15] U.S. Environmental Protection Agency (USEPA). Integrated Risk Information System (IRIS); U.S. Environmental Protection Agency: Washington, DC, USA. Available online:
[16] Rahman, M. S.; et al. Assessment of heavy metal contamination in water and sediments of an urban river in a developing country. International Journal of Environmental Research 2021, 15(5), 851–864.
[17] Kumar, V.; et al. Global evaluation of heavy metal content in surface water bodies: A meta-analysis. Science of the Total Environment 2019, 698, 134364.
[18] Ahmed, S.; et al. Hydrogeochemical characterization and health risk assessment in a typical industrial city of South Asia. Environmental Geochemistry and Health 2022, 44(9), 3205–3225.
[19] Zhou, Y.; et al. Source apportionment of heavy metals in urban river sediments using multivariate statistical analysis. Environmental Monitoring and Assessment 2020, 192(11), 745.
[20] Belkhiri, L.; Boudoukha, A.; Mouni, L. Hydrochemical characterization of groundwater using multivariate analysis. Environmental Earth Sciences 2010, 59(8), 1621–1634.
[21] Adimalla, N.; Li, P. Occurrence, health risks, and geochemical mechanisms of fluoride and nitrate in groundwater. Human and Ecological Risk Assessment 2019, 25(1-2), 1–21.
[22] Jacks, G.; Bhattacharya, P.; Chaudhary, V.; Singh, K. Controls on the genesis of high-fluoride groundwater. Applied Geochemistry 2005, 20(2), 221–238.
[23] Saha, D.; et al. Geochemical processes controlling arsenic mobilization. Science of the Total Environment 2019, 659, 986–999.
[24] World Health Organization (WHO). World Health Statistics 2017: Monitoring Health for the SDGs, Sustainable Development Goals; World Health Organization: Geneva, Switzerland, 2017.
Cite This Article
  • APA Style

    Abubakar, K. S., Haruna, A. I., Maigari, A. S., Abdullahi, F., Jibrin, A. I., et al. (2026). Multivariate Assessment of Water Quality and Associated Health Risks: Integrating Indices to Uncover Pollution Patterns and Sources Around Dass Metropolitan Bauchi, Nigeria. Journal of Health and Environmental Research, 12(1), 10-27. https://doi.org/10.11648/j.jher.20261201.12

    Copy | Download

    ACS Style

    Abubakar, K. S.; Haruna, A. I.; Maigari, A. S.; Abdullahi, F.; Jibrin, A. I., et al. Multivariate Assessment of Water Quality and Associated Health Risks: Integrating Indices to Uncover Pollution Patterns and Sources Around Dass Metropolitan Bauchi, Nigeria. J. Health Environ. Res. 2026, 12(1), 10-27. doi: 10.11648/j.jher.20261201.12

    Copy | Download

    AMA Style

    Abubakar KS, Haruna AI, Maigari AS, Abdullahi F, Jibrin AI, et al. Multivariate Assessment of Water Quality and Associated Health Risks: Integrating Indices to Uncover Pollution Patterns and Sources Around Dass Metropolitan Bauchi, Nigeria. J Health Environ Res. 2026;12(1):10-27. doi: 10.11648/j.jher.20261201.12

    Copy | Download

  • @article{10.11648/j.jher.20261201.12,
      author = {Khadijah Sabo Abubakar and Ahmed Isah Haruna and Abubakar Sadiq Maigari and Faisal Abdullahi and Abdulmajid Isah Jibrin and Maimunatu Halilu},
      title = {Multivariate Assessment of Water Quality and Associated Health Risks: Integrating Indices to Uncover Pollution Patterns and Sources Around Dass Metropolitan Bauchi, Nigeria},
      journal = {Journal of Health and Environmental Research},
      volume = {12},
      number = {1},
      pages = {10-27},
      doi = {10.11648/j.jher.20261201.12},
      url = {https://doi.org/10.11648/j.jher.20261201.12},
      eprint = {https://article.sciencepublishinggroup.com/pdf/10.11648.j.jher.20261201.12},
      abstract = {This study assesses groundwater quality and associated health risks in Dass Metropolitan, Bauchi State, Nigeria, using hydro-chemical analysis, multivariate statistics, and health risk models. A total of fifty (50) groundwater samples were collected and analyzed for physicochemical parameters. Thirty (30) samples were analyzed for heavy metal concentrations (Cd, Cr, Hg, Pb, As), from which seventeen (17) representative samples with complete heavy metal data were selected for detailed evaluation using pollution indices and health risk assessment. Water Quality Index results indicate varying degrees of deterioration, with several locations classified as poor to unsuitable for drinking. Heavy metal concentrations, particularly Cd, Hg, and Pb, exceeded WHO guideline limits in multiple samples. Non-carcinogenic health risk assessment revealed hazard indices greater than one in several locations, indicating potential health concerns for local populations. Carcinogenic risk values were in the order of 10-3 under conservative assumptions (total chromium treated as hexavalent chromium), exceeding acceptable risk thresholds by two orders of magnitude. Principal Component Analysis extracted three components explaining 78.94% of total variance. The first component accounting for 41.80% represents anthropogenic salinity and nutrient enrichment from agricultural and domestic sources. The second component accounting for 24.80% reflects geogenic metal mobilization influenced by pH conditions. The third component accounting for 12.34% indicates lithology-controlled fluoride enrichment from basement rock weathering. The findings demonstrate combined anthropogenic and geogenic controls on groundwater quality and underscore the urgent need for regular monitoring and targeted mitigation strategies to protect public health.},
     year = {2026}
    }
    

    Copy | Download

  • TY  - JOUR
    T1  - Multivariate Assessment of Water Quality and Associated Health Risks: Integrating Indices to Uncover Pollution Patterns and Sources Around Dass Metropolitan Bauchi, Nigeria
    AU  - Khadijah Sabo Abubakar
    AU  - Ahmed Isah Haruna
    AU  - Abubakar Sadiq Maigari
    AU  - Faisal Abdullahi
    AU  - Abdulmajid Isah Jibrin
    AU  - Maimunatu Halilu
    Y1  - 2026/03/31
    PY  - 2026
    N1  - https://doi.org/10.11648/j.jher.20261201.12
    DO  - 10.11648/j.jher.20261201.12
    T2  - Journal of Health and Environmental Research
    JF  - Journal of Health and Environmental Research
    JO  - Journal of Health and Environmental Research
    SP  - 10
    EP  - 27
    PB  - Science Publishing Group
    SN  - 2472-3592
    UR  - https://doi.org/10.11648/j.jher.20261201.12
    AB  - This study assesses groundwater quality and associated health risks in Dass Metropolitan, Bauchi State, Nigeria, using hydro-chemical analysis, multivariate statistics, and health risk models. A total of fifty (50) groundwater samples were collected and analyzed for physicochemical parameters. Thirty (30) samples were analyzed for heavy metal concentrations (Cd, Cr, Hg, Pb, As), from which seventeen (17) representative samples with complete heavy metal data were selected for detailed evaluation using pollution indices and health risk assessment. Water Quality Index results indicate varying degrees of deterioration, with several locations classified as poor to unsuitable for drinking. Heavy metal concentrations, particularly Cd, Hg, and Pb, exceeded WHO guideline limits in multiple samples. Non-carcinogenic health risk assessment revealed hazard indices greater than one in several locations, indicating potential health concerns for local populations. Carcinogenic risk values were in the order of 10-3 under conservative assumptions (total chromium treated as hexavalent chromium), exceeding acceptable risk thresholds by two orders of magnitude. Principal Component Analysis extracted three components explaining 78.94% of total variance. The first component accounting for 41.80% represents anthropogenic salinity and nutrient enrichment from agricultural and domestic sources. The second component accounting for 24.80% reflects geogenic metal mobilization influenced by pH conditions. The third component accounting for 12.34% indicates lithology-controlled fluoride enrichment from basement rock weathering. The findings demonstrate combined anthropogenic and geogenic controls on groundwater quality and underscore the urgent need for regular monitoring and targeted mitigation strategies to protect public health.
    VL  - 12
    IS  - 1
    ER  - 

    Copy | Download

Author Information
  • Department of Applied Geology, Abubakar Tafawa Balewa University, Bauchi, Nigeria

    Biography: Khadijah Sabo Abubakar is a postgraduate doctorate student in Environmental Geology at Abubakar Tafawa Balewa University (ATBU), Bauchi, Nigeria. She completed her Master of Science in Economic Geology-Mineral Exploration from the same institution in 2020, and her Bachelor of Science (Hons) in Applied Geology from ATBU in 2017. Her research focuses on environmental geology, particularly the assessment of heavy metal contamination, groundwater quality evaluation, and the environmental impacts of mining activities in Nigeria. As a doctoral researcher, she has actively participated in multiple field-based investigations and laboratory analyses aimed at understanding geological controls on environmental pollution. Her work bridges the gap between economic geology and environmental sciences, contributing to sustainable mining practices and community health protection. She has collaborated with fellow researchers across Nigerian institutions and continues to develop expertise in environmental monitoring, geochemical analysis, and remediation strategies for mining-affected environments.

    Research Fields: Environmental geology and heavy metal contamination, Groundwater quality assessment and monitoring, Environmental impacts of mining activities, Geochemical analysis of polluted environments, Remediation strategies for mining-affected areas

  • Department of Applied Geology, Abubakar Tafawa Balewa University, Bauchi, Nigeria

    Biography: Ahmed Isah Haruna is a Professor of Economic Geology-Mineral Exploration at Abubakar Tafawa Balewa University (ATBU), Bauchi, Nigeria. He earned his PhD in Economic Geology-Mineral Exploration from ATBU in 2011, an MSc from the same institution in 1998, and a BSc (Hons) in Geology from Ahmadu Bello University, Zaria, in 1994. His research focuses on mineral exploration, geochemical evolution of mineralized systems, and environmental geology. He has supervised numerous postgraduate students addressing heavy metal contamination, groundwater quality, and mining impacts across Nigeria. Professor Haruna is a Visiting Professor at Gombe State University and Aliko Dangote University of Technology, Kano. He serves on several editorial boards and has been invited as a Keynote Speaker, Technical Committee Member, and Conference Judge.

    Research Fields: Economic geology and mineral exploration, Geochemical evolution of mineralized systems, Environmental geology and pollution assessment, Barite and gypsum mineralization studies, Pegmatite geology and rare element fractionation, Mining impacts on soil and water quality, Geochemical exploration techniques, Mineral resource evaluation and development, Heavy metal contamination in mining environments, Supervised research in environmental geology

  • Department of Applied Geology, Abubakar Tafawa Balewa University, Bauchi, Nigeria

    Biography: Abubakar Sadiq Maigari is a Professor of Sedimentology and Petroleum Geology at Abubakar Tafawa Balewa University, Bauchi. He holds both his MSc and BSc degrees in Geology, which established the foundation for his research career in sedimentary basin analysis, petroleum geology, and environmental geology. Professor Maigari serves as a Visiting Professor at Gombe State University and currently holds the PTDF Chair at the University of Maiduguri, where he supports advanced postgraduate training and industry-oriented research in petroleum and environmental geology. His academic leadership has significantly advanced geoscience education in Nigeria. He serves on numerous editorial boards and has been invited as a Keynote Speaker and Technical Committee Member at various conferences.

    Research Fields: Sedimentology and petroleum geology, Basin analysis and hydrocarbon prospectivity, Clastic and carbonate reservoir characterization, Petroleum system modeling and evaluation, Sequence stratigraphy and depositional systems, Sedimentary geochemistry and diagenesis studies, Hydrocarbon exploration and prospect generation, Reservoir quality prediction and assessment, Tectonics and sedimentation relationships, Source rock evaluation and maturation studies

  • Department of Applied Geology, Abubakar Tafawa Balewa University, Bauchi, Nigeria

    Biography: Faisal Abdullahi is a postgraduate doctorate student in Economic Geology-Mineral Exploration (In-View) at Abubakar Tafawa Balewa University (ATBU), Bauchi, Nigeria. He completed his Master of Science in Economic Geology from the same institution in 2023, and his Bachelor of Science (Hons) in Applied Geology from ATBU in 2018. He is an Exploration Geologist by training. Recognized for his practical expertise in the mining industry, Faisal currently serves as a Senior Mining Geologist at SINOMA CNBM INTERNATIONAL, where he is actively involved in diamond new energy lithium processing at open pit mines. His professional experience bridges academic research and industrial application, focusing on mineral exploration, ore body characterization, and resource evaluation. He has participated in multiple exploration projects across Nigeria, contributing to the development of critical mineral resources for the energy transition. His research interests include economic geology, geochemical exploration, and lithium deposit characterization.

    Research Fields: Economic geology and mineral exploration, Lithium deposit characterization and exploration, Open pit mining and resource evaluation, Geochemical exploration and ore body modeling, Critical minerals for energy transition

  • Department of Applied Geology, Abubakar Tafawa Balewa University, Bauchi, Nigeria

    Biography: Abdulmajid Isah Jibrin is a Lecturer and Researcher in Economic Geology-Mineral Exploration at Abubakar Tafawa Balewa University (ATBU), Bauchi, Nigeria. He completed his PhD in Economic Geology-Mineral Exploration from ATBU, his Master of Science in Economic Geology-Mineral Exploration from the same institution, and his Bachelor of Science (Hons) in Applied Geology, also from ATBU. His academic contributions span teaching, research supervision, and curriculum development in applied geology. Dr. Jibrin's research focuses on mineral exploration, economic geology, and environmental geology, with particular emphasis on heavy metal contamination assessment, groundwater quality evaluation, and the environmental impacts of mining activities in Nigeria. He has supervised numerous undergraduate and postgraduate students in these critical areas. He has authored several publications in reputable journals and actively collaborates on research projects investigating the geochemical evolution of mineralized systems and sustainable environmental management practices across Nigerian terrains.

    Research Fields: Economic geology and mineral exploration, Environmental geology and contamination assessment, Heavy metal pollution in mining environments, Groundwater quality evaluation studies, Geochemical evolution of mineralized systems, Sustainable environmental management practices, Mining activities and environmental degradation

  • Department of Geology, Modibbo Adama University, Yola, Nigeria

    Biography: Maimunatu Halilu is a Lecturer and Researcher in Economic Geology-Mineral Exploration at Modibbo Adama University Yola, Nigeria. She obtained her PhD in Economic Geology (Mineral Exploration) from Abubakar Tafawa Balewa University and earned her Master of Science (MSc) in Mineral Exploration from Modibbo Adama University, and her Bachelor of Science (BSc) in Geology from Ahmadu Bello University. In academics, she has contributed to teaching, student mentorship, and research development in geology and mineral exploration. Her scholarly work also extends to environmental studies, focusing on the interaction between mineral exploitation and environmental sustainability, including environmental impact assessment and resource management. Through research and academic engagement, she has contributed to advancing sustainable mineral exploration practices and environmental awareness within the geosciences.

    Research Fields: Economic geology and mineral exploration, Environmental geology and impact assessment, Petrology, Groundwater quality monitoring studies, Geochemical analysis of water, rock and soil samples

  • Abstract
  • Keywords
  • Document Sections

    1. 1. Introduction
    2. 2. Geology and Location of the Study Area
    3. 3. Materials and Methods
    4. 4. Results
    5. 5. Discussion
    6. 6. Conclusions and Recommendations
    Show Full Outline
  • Abbreviations
  • Acknowledgments
  • Author Contributions
  • Data Availability Statement
  • Conflicts of Interest
  • References
  • Cite This Article
  • Author Information