1. Introduction
1.1. Background of Study
Supply chain management (SCM) has emerged as a critical component in the overall strategy of organizations seeking to enhance their performance and gain a competitive advantage. In an increasingly globalized market, the efficiency and effectiveness of supply chain practices can significantly influence an organization's ability to respond to customer demands, manage costs, and maintain quality. Because of the increased rivalry brought about by the growing number of competitors in the cement sector, cement companies must find strategies to maintain their competitiveness. Reducing supply chain expenses through efficient supply chain management is one method. It has been noted that in today's global battle, SCM practice has become crucial to maintaining competitiveness and expanding profitably
| [1] | Kant, D. S., Dabaso, A., &Adula, M (2022) Coffee Logistics Indigenous Implicit Learning Knowledge Effect on Cooperative Societies Sustainability in Ethiopia Journal of Multidisciplinary Cases (JMC) ISSN 2799-0990, 3(01), 8–20.
https://doi.org/10.55529/jmc31.8.20 |
| [16] | Parvizi, J., Tan, T. L., Goswami, K., Higuera, C., Della Valle, C., Chen, A. F. and Shohat, N., 2018. The 2018 definition of periprosthetic hip and knee infection: an evidence-based and validated criteria. The Journal of arthroplasty, 33(5), pp. 1309-1314. |
| [17] | Mengistu, A., Krishnan, P., Maaskant, K., Meyer, C. J. and Krkoska, E., 2020. Firms in Ethiopia’s industrial parks: Covid-19 impacts, challenges, and government response. World Bank. |
[1, 16, 17]
.
The process of managing each activity along the entire supply chain in order to gain a competitive advantage is the most basic definition of supply chain management. According to
| [4] | Ellram, L. M. & Cooper, M. C. 1993, ‘Characteristics of supply chain management and the implications for purchasing and logistics strategy’, International Journal of Logistics Management, vol. 4, no. 2, pp. 1–10. |
[4]
, supply chain management is "an integrating philosophy to manage the total flow of a distribution channel from supplier to ultimate customer.
| [5] | Porter, M. E. and Millar, V. E. (1985) ‘How information gives you competitive advantage’, Harvard Business Review, 63(4), pp. 149–160. |
[5]
, and others describe supply chain management and outline its goals. They contend that supply chain management seeks to obtain a competitive advantage by manufacturing unique value that customers want at a greater cost or by executing all activities more cheaply.
Companies began to realize that improving internal efficiencies was not enough; they also needed to make their supply chain as a whole competitive. One aspect of supply chain management is the integration of critical business processes across the supply chain
| [2] | Gobena, A. E., & Kant, S. (2022). Assessing the Effect of Endogenous Culture, Local Resources, Eco-Friendly Environment and Modern Strategy Development on Entrepreneurial Development Journal of Entrepreneurship, Management, and Innovation, 4(1), 118-135
https://doi.org/10.52633/jemi.v4i1.153 |
| [7] | Salazar, N. B., 2012. Tourism imaginaries: A conceptual approach. Annals of Tourism research, 39(2), pp. 863-882. |
[2, 7]
. This is because, instead of competing as entirely autonomous businesses, individual companies will instead do so as supply chains. Companies' supply networks become the new focus of rivalry
| [7] | Salazar, N. B., 2012. Tourism imaginaries: A conceptual approach. Annals of Tourism research, 39(2), pp. 863-882. |
[7]
. The best supply chain practices are initiatives that affect the supply chain as a whole, its elements, or key processes
| [6] | Piotrowicz, W. and Cuthbertson, R., 2012. A structured approach for assessing sustainable best practices in supply chains. In Sustainable Transport: New Trends and Business Practices (pp. 41-65). Berlin, Heidelberg: Springer Berlin Heidelberg. |
[6]
. Contextual factors such as the sector, size of the business, and supply chain location and supply chain type and length all have an impact on these practices
| [8] | Torres, C. C., 2021. Adaptation and validation of technostress creators and technostress inhibitors inventories in a Spanish-speaking Latin American country. Technology in Society, 66, p. 101660. |
[8]
.
The significance of supply chains began during the scientific revolution, which had a profound effect on management and many other facets of society. The scientific revolution and major technological breakthroughs have made the supply chain more important, and supply chain management practices are now an essential part of a company's effectiveness and efficiency. The organization's supply chain unquestionably manages the most delicate stages that have a direct impact on the product configuration; consequently, it is essential to production, sales, profit-making, and continuity through customer service, all of which support the institution's efforts to hold onto its market share
| [9] | Shoghari, R. and Abdallah, K., 2016. The impact of supply chain management on customer service (a case study of Lebanon). Management, 6(2), pp. 46-54. |
[9]
.
Organizational performance is the extent to which a company achieves its financial and market-oriented goals
| [10] | Yamin, S., Gunasekaran, A. and Mavondo, F. T., 1999. Relationship between generic strategies, competitive advantage and organizational performance: an empirical analysis. Technovation, 19(8), pp. 507-518. |
[10]
. The primary short-term objective of supply chain management (SCM) is to improve production performance, while the long-term objectives are to increase market share and earnings for all supply chain players
| [11] | Tan, K. C., Kannan, V. R. and Handfield, R. B., 1998. Supply chain management: supplier performance and firm performance. International Journal of Purchasing & Materials Management, 34(3). |
[11]
. According to
| [12] | Li, J., Zhang, G., Qi, S., Li, X. and Peng, X., 2006. Concentrations, enantiomeric compositions, and sources of HCH, DDT and chlordane in soils from the Pearl River Delta, South China. Science of the total environment, 372(1), pp. 215-224. |
[12]
, each organizational activity, including supply chain management, should ultimately lead to enhanced organizational performance. The supply chain is the full process of transferring products and services from the raw material stage to the final product that consumers can consume. This movement includes the flow of money and expertise in addition to material goods.
The network of upstream and downstream companies involved in different operations and activities that create value for end users in the form of goods or services is known as a supply chain
| [13] | Christopher, W., 1998. In the stream of history: shaping foreign policy for a new era. Stanford University Press. |
[13]
. The notion of supply chain management involves assessing the planning, implementation, and control of the flow of finished goods and raw materials all the way to the final consumers. The interconnected supply chain processes begin when a client puts an order and are completed when the customer receives the goods. For those commodities to reach end users, the network requires participation from producers, distributors, wholesalers, retailers, and raw material suppliers
| [14] | Romli, H., Febrianti, M. and Pratiwi, T. S., 2017. Faktor-faktor yang mempengaruhi volatilitas harga saham pada PT Waskita Karya Tbk. Jurnal Ilmiah Ekonomi Global Masa Kini, 8(1), pp. 1-5. |
[14]
. Given the economies of scale involved, competition policy appears to be essential in the sector; nevertheless, in another place, the (lack of) competition among cement manufacturers is a major issue. Increased imports should boost competition, according to the World Bank
| [15] | World Bank Group, 2016. World development report 2016: Digital dividends. World Bank Publications. |
[15]
, which also recommends "competition law enforcement and advocacy for pro-competition regulatory frameworks."
Ethiopia's cement manufacturing enterprises are currently unable to meet the demand for cement, which has increased by an average of 30%
. This desire has attracted rivalry from both the inside and the outside. For instance, new companies have come to invest in Ethiopia even while imports have surged. For example, the Ethiopian Ministry of Trade and Industry announced that 320 million quintals of cement will be imported during the 2013 Ethiopian fiscal year in addition to domestic production in order to overcome the cement shortage. There is a lack of empirical study on how practitioners incorporate supply chain management strategies into their overall competitive business strategy, and the Ethiopian cement industry is not widely studied.
The specific steps or problems of successful supply chain management deployments are not well documented
| [11] | Tan, K. C., Kannan, V. R. and Handfield, R. B., 1998. Supply chain management: supplier performance and firm performance. International Journal of Purchasing & Materials Management, 34(3). |
[11]
. Although the absence of successful SCM projects has been attributed to the complexity of SCM, SCM research has not been able to offer much support for SCM practice. The lack of a theoretical framework and conceptual ambiguity in SCM studies have been primarily blamed for this. Therefore, in the context of Mugher and Dangote cement manufacturing, this study used Supply Chain Performance Effectiveness analysis to investigate how supply chain management techniques impact organizational performance.
1.2. Statement of the Problem
Organizations in the fiercely competitive cement sector encounter many difficulties that have an impact on their overall performance and operational effectiveness. Even though supply chain management (SCM) is essential for increasing competitiveness and productivity, many businesses find it difficult to put SCM into practice in a way that supports their strategic objectives. In the current business climate, which is defined by globalization, specialization, innovation, and outsourcing, it is imperative that firms corporate and interact in networks. However, such networking may also have disadvantages. Thus, supply chain management is necessary. Despite being a prominent science topic in the 1990s, there aren't many studies on supply chain management in the cement industry. As a part of the process sector, cement has a big impact on the world economy. Until far, supply chain management (SCM) has primarily been used for operational purposes in enterprises, neglecting opportunities to enhance its concept and use as a tool to handle competitive challenges
.
According to a review of regional studies on supply chain management techniques,
| [17] | Mengistu, A., Krishnan, P., Maaskant, K., Meyer, C. J. and Krkoska, E., 2020. Firms in Ethiopia’s industrial parks: Covid-19 impacts, challenges, and government response. World Bank. |
[17]
looked at supply chain management concerns and how they relate to the competitiveness of Ethiopia's cement sector. The study focuses on the challenges of analyzing the relationship between the dependent variable, the competitive position of cement factories in the Ethiopian cement industry, and the independent variables, the extent of strategic supplier partnerships, effective customer relationships, managing environmental issues, and effective information communications. He found that the organization's view of general supply chain management difficulties was influenced by supply chain management challenges and their relationship to competitive position. He also looked at the degree of influence and correlation between these issues and the competitive position of Ethiopian cement plants.
The study's findings show that the countries enormous cement projections and demand do not align, and that the delayed construction boom, marketing mix strategies, and market intermediaries have all contributed to a fall in cement demand. A study on Ethiopian cement manufacturers' supply chain management performance issues was carried out by
| [18] | Kassaw, M. W., Abebe, A. M., Tlaye, K. G., Zemariam, A. B. and Abate, B. B., 2019. Prevalence and risk factors of intestinal parasitic infestations among preschool children in Sekota town, Waghimra zone, Ethiopia. BMC pediatrics, 19(1), p. 437. |
[18]
. Since it doesn't show how supply chain management techniques affect the supply chain performance effectiveness of the Ethiopian cement sector, the study's gap is different from the current situation of the Ethiopian cement market.
However, the study did not examine how supply chain management practices impacts the competitive advantage of manufacturing firms, especially in the cement industry, which is currently characterized by intense competition. Consequently, there is a knowledge gap and a dearth of research on the efficacy of supply chain management techniques in the Ethiopian cement sector.
| [19] | Asgari, S., Moslem, M., Bagheri-Lankarani, K., Pournasr, B., Miryounesi, M. and Baharvand, H., 2013. Differentiation and transplantation of human induced pluripotent stem cell-derived hepatocyte-like cells. Stem Cell Reviews and Reports, 9(4), pp. 493-504. |
[19]
examined the effects of supply chain management practices on competitive advantage in manufacturing companies in Khuzestan province (Iran) using strategic partnerships with suppliers, customer relationships, information sharing, the quality of information sharing, and internal lean practices as independent variables affecting the competitive advantage. The study's findings showed a correlation between competitive advantage and supply chain management strategies. As a result, this study filled a research gap in the cement manufacturing sector by examining how supply chain management techniques affect organizational performance.
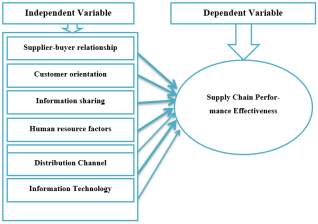
1.3. Objectives of the Study
The foremost objective of the study is to examine the impact of supply chain management practices on organizational performance the case of Mugher and Dangote cement factory. The case of Mugher and Dangote cement factory. Therefore, the subsequent specific objectives were addressed.
1) To evaluate how customer orientation affects the performance of the supply chain at Mugher and Dangote Cement factories.
2) To examine the impact of supplier-buyer relationships on the supply chain performance at Mugher and Dangote Cement factories.
3) To investigate how inventory management influences the supply chain performance of Mugher and Dangote Cement factories.
4) To analyze how the adoption of information sharing affects the performance of the supply chain at Mugher and Dangote Cement factories.
5) To examine the impact of distribution channels on the supply chain performance of Mugher and Dangote Cement factories.
6) To investigate how human resources affect the performance of the supply chain at Mugher and Dangote Cement factories.
7) To examine the role of information technology in enhancing the supply chain performance of Mugher and Dangote Cement factories.
Source: Conceptual framework developed from theoretical foundations and literature
| [20] | Burton, P., 2009. Conceptual, theoretical and practical issues in measuring the benefits of public participation. Evaluation, 15(3), pp. 263-284. |
[20]
.
According to
| [21] | Jackson, J., 2008. Globalization, internationalization, and short-term stays abroad. International journal of intercultural relations, 32(4), pp. 349-358. |
[21]
, a population is the total number of people from whom information can be obtained. The target demographic included all employees of Mugher and Dangote Cement Ethiopia PLC's production, sales, and marketing departments as well as the logistics and supply chain management divisions. About 301 individuals work at the Mugher Cement Factory, compared to 254 at the Dangote Cement Factory. 555 individuals are employed by these three divisions together.
This study, which was based on the supposition that many researchers (and research texts) advocate a minimum Confidence Level of 95% and a Margin of Error of 5%, employed the mathematical formula developed by
| [22] | Morgan, K., 1970. Sample size determination using Krejcie and Morgan table. Kenya Projects Organization (KENPRO), 38(1970), pp. 607-610. |
[22]
. Therefore, the sample size was calculated using the statistical formula below.
Where:
1) n = required sample size;
2) N = population size;
3) Z = Degree of confidence (1.962);
4) P = Probability of success (0.50);
5) Q = Probability of failure (0.50);
6) e = Tolerable error (0.052).
Table 1. Proportional sample size of departments.
Strata (departments) | Target Population of Mugher Cement factory | Target Population of Dangote Cement factory | Total Target Population of each Stratum | Sample size from each Stratum |
Logistics & Supply Chain Management department | 204 | 172 | 376 | 261=(376*385/555) |
Production departments | 69 | 58 | 127 | 88=(127*385/555) |
Marketing and sales department | 28 | 24 | 52 | 36=(52*385/555) |
Total | 301 | 254 | 555 | 385 |
Source: survey data, (2024)
Thus, the sample size of the intended study was a total of a total of 385 respondents.
Multiple regression models were employed in addition to descriptive statistics. The following specifications applied to the model:
Y= β0 + β1 X1+ β2 X2+ β3 X3+ β4 X4 + β5 X5 + β6 X6+ β7 X7+ e(1)
Where: Supply Chain Performance (SCP)
1) ei is the error term or discrepancy term.
2) β0 is the intercept - constant, which would be equal to the mean if all slope coefficients are 0.
3) β1, β2, β3, β4, β5, β6 and β7 are the coefficients related with each independent variable, which measures the change in the mean value of supply Chain Effectiveness, per unit change in their respective independent variables.
2. Descriptive Results and Discussion
In this study, interview questions were developed for both individual interviews and focus group discussions. These questions were posed to selected individuals and groups who possess extensive knowledge in the relevant area, following the methodology of purposive sampling or judgmental sampling. The questionnaire included five team factors arranged according to a five-point Likert scale.
Commitment of Suppliers to supply quality materials (Mean: 3.23) this indicates a moderately positive perception of suppliers' commitment to providing quality materials, suggesting that participants generally feel that suppliers are reliable in this regard. (Standard Deviation: 0.998) This value shows a moderate level of variation in responses, indicating that while many participants agree on supplier commitment, there are differing opinions among some. Sustainability of Training on Maintenance After Sales Service (Mean: 2.95) This mean score is slightly below the neutral midpoint of 3, indicating that participants are somewhat dissatisfied or neutral about the sustainability of training provided after sales service. There may be a perception that training is insufficient or not consistently applied. (Standard Deviation: 1.075).
Table 2. Supply chain management practices.
Descriptive Statistics |
Item | N | Minimum | Maximum | Mean | Std. Deviation |
Commitment of suppliers to supply quality materials | 296 | 1 | 5 | 3.23 | .998 |
Sustainable of training on maintenance is made after sales Service | 296 | 1 | 5 | 2.95 | 1.075 |
Availability of credit facility | 296 | 1 | 5 | 2.80 | 1.081 |
Possible to change or cancel an order when a very long lead Time occurs or happens | 296 | 1 | 5 | 2.34 | 1.153 |
Valid N (list wise) | 296 | | | | |
Source: Survey data (2025)
Availability of credit facility (Mean: 2.80) this mean score indicates a negative perception regarding the availability of credit facilities, suggesting that participants believe access to credit is limited, which could hinder operational flexibility. (Standard Deviation: 1.081) The standard deviation here also reflects considerable variability in responses, indicating differing experiences or perceptions about credit availability among participants. Ability to Change or Cancel an Order Due to Long Lead Times (Mean: 2.34) this low mean score suggests significant dissatisfaction with the ability to change or cancel orders when faced with long lead times. Participant’s likely feel that this aspect of supply chain management is poorly managed, potentially leading to operational inefficiencies. (Standard Deviation: 1.153) The relatively high standard deviation indicates that responses vary widely, suggesting that while some may have had better experiences, and many feel strongly negative about this aspect.
The data reflects a mixed perception of supply chain management practices among participants. While there is a moderate level of satisfaction regarding suppliers' commitment to quality, other areas such as training sustainability, credit availability, and order flexibility are viewed more negatively. Implications for Performance: The perceptions highlighted in the table can significantly impact organizational performance at Mugher and Dangote Cement Factory. Addressing concerns related to training, credit facilities, and order management could enhance overall supply chain effectiveness. This analysis suggests areas for improvement in supply chain management practices that could lead to better organizational performance and competitive positioning in the market.
Table 3. Customer orientation of procurement process.
Descriptive Statistics |
Item | N | Minimum | Maximum | Mean | Std. Deviation |
The quality of materials purchased | 296 | 1 | 5 | 3.11 | 1.185 |
Level of participation of technical experts during procurement | 296 | 1 | 5 | 3.38 | 1.074 |
Commitment of buyer to buy quality of materials | 296 | 1 | 32 | 3.54 | 2.273 |
Purchase orders at the right time, quality and quantity | 296 | 1 | 5 | 3.53 | 1.111 |
Valid N (listwise) | 296 | |
Source: Survey data (2025)
The quality of materials purchased (Mean: 3.11) this mean score suggests a slightly positive perception regarding the quality of materials purchased, indicating that participants generally view the materials as acceptable but not exceptional. (Standard Deviation: 1.185) The relatively high standard deviation indicates considerable variability in responses, suggesting that opinions on material quality differ among participants. Level of participation of technical experts During Procurement (Mean: 3.38) This mean score reflects a moderately positive perception of the involvement of technical experts in the procurement process. Participants believe that technical expertise is somewhat valued, which can lead to better purchasing decisions. (Standard Deviation: 1.074) The standard deviation is lower than that for material quality, indicating more consensuses among participants regarding the participation of technical experts.
Commitment of buyer to buy quality materials (Mean: 3.54) this score indicates a relatively strong perception of buyer commitment to purchasing quality materials. Participants feel that there is a solid intention to maintain quality standards in procurement. (Standard Deviation: 2.273) The high standard deviation suggests significant variability in responses, indicating that while many participants feel positively about buyer commitment, there are also contrasting views. Purchase Orders at the Right Time, Quality, and Quantity (Mean: 3.53) This mean score indicates a strong perception that purchase orders are generally placed correctly regarding timing, quality, and quantity. Participants seem to feel that procurement processes are functioning adequately in this aspect. (Standard Deviation: 1.111) The standard deviation reflects moderate variability in responses, suggesting a reasonable consensus among participants about the efficiency of order placements.
The data illustrates a generally positive perception of customer orientation in the procurement process, particularly regarding buyer commitment and timely orders. However, variability in responses suggests differing experiences among participants. The perceptions reflected in this table can influence organizational performance at Mugher and Dangote Cement Factory. Ensuring consistent quality in materials and enhancing technical involvement can further strengthen the procurement process, contributing to improved supply chain management and supply chain performance effectiveness. This analysis highlights areas of strength and potential improvement within the procurement process, which could lead to more effective supply chain practices and better organizational outcomes.
Table 4. Information sharing/reporting.
Descriptive Statistics |
| N | Minimum | Maximum | Mean | Std. Deviation |
Inventory documentations of replaced items | 296 | 1 | 5 | 3.59 | 1.034 |
Inventory documentations of new items | 296 | 1 | 5 | 3.27 | 1.149 |
The level of inventory control method | 296 | 1 | 5 | 3.41 | 1.034 |
Availability of dead stock Management system (i.e. damaged Or obsolete item) | 296 | 1 | 5 | 2.84 | 1.732 |
Valid N (listwise) | 296 | |
Source: Survey data (2025)
The Level of inventory control method (Mean: 3.41) this mean score reflects a moderately positive perception of the inventory control methods in place. Participants believe that the methods used are generally effective, although not without shortcomings. (Standard Deviation: 1.034) The low standard deviation suggests a reasonable level of agreement among participants about the effectiveness of inventory control methods. Availability of dead stock management system (i.e., damaged or obsolete items) (Mean: 2.84) this score indicates a negative perception regarding the management of dead stock. Participants feel that the systems in place for handling damaged or obsolete items are lacking, which could lead to inefficiencies. (Standard Deviation: 1.732) The high standard deviation indicates significant variability in responses, suggesting that while some participants may feel positively about dead stock management, many are dissatisfied.
The data reflects a generally positive perception of information sharing and reporting related to inventory management, particularly for replaced items and inventory control methods. However, there is notable concern regarding the management of dead stock, which is perceived negatively. The perceptions highlighted in this table can significantly influence organizational performance at Mugher and Dangote Cement Factory. This analysis underscores the importance of robust information sharing and reporting practices in supply chain management, which can enhance operational efficiency and competitive advantage.
Table 5. Human resource /Staff Training.
Descriptive Statistics |
Item | N | Minimum | Maximum | Mean | Std. Deviation |
The level of information sharing in planning with the suppliers In order to plan the supplies | 296 | 1 | 5 | 2.92 | 1.021 |
Availability of information system application software in Supply chain management | 296 | 1 | 5 | 2.96 | 1.078 |
Quality and adequacy of information flow through the supply Chain | 296 | 1 | 5 | 2.69 | 1.000 |
The level of information sharing within the functional units of the organization | 296 | 1 | 5 | 3.21 | 1.007 |
Valid N (list wise) | 296 | |
Source: Survey data (2025)
Quality and Adequacy of Information Flow through the Supply Chain (Mean: 2.69) this mean score indicates a negative perception of the quality and adequacy of information flow in the supply chain. Participants feel that information sharing is insufficient, which could hinder effective decision-making and operational efficiency. (Standard Deviation: 1.000) The low standard deviation suggests a consensus among participants regarding the inadequacy of information flow, indicating widespread agreement on this issue. The Level of Information Sharing within the Functional Units of the Organization (Mean: 3.21) this score indicates a moderately positive perception of information sharing within the organization’s functional units. Participants generally feel that there is a reasonable level of communication across different departments. (Standard Deviation: 1.007) The standard deviation reflects a moderate level of agreement among participants, indicating that while many are satisfied with internal communication, there are still some differing views.
The data reveals a generally negative perception of information sharing and communication related to supply chain management, particularly with suppliers and in the quality of information flow. However, there is a more positive view of internal communication among functional units. The perceptions highlighted in this table suggest that improving information sharing with suppliers and enhancing the quality of information flow are critical areas for development. Addressing these issues could lead to better coordination, efficiency, and overall performance in supply chain management at Mugher and Dangote Cement Factory. This analysis emphasizes the need for effective training and systems to enhance information sharing, which is essential for optimizing supply chain practices and achieving Effective Supply Chain Performance.
Table 6. Distribution Channel.
Descriptive Statistics |
Item | N | Minimum | Maximum | Mean | Std. Deviation |
Availability of well-organized delivery system | 296 | 1 | 5 | 2.50 | 1.851 |
Availability of better transportation facility (loading and unloading) | 296 | 1 | 5 | 2.57 | 1.551 |
Considering the shipment arrangement of the supplier while Purchasing | 296 | 1 | 5 | 2.67 | 1.594 |
Valid N (list wise) | 296 | |
Source: Survey data (2025)
The data reveals a generally negative perception of key aspects of the distribution channel, including the organization of delivery systems and the adequacy of transportation facilities. The perceptions highlighted in this table suggest that significant improvements are needed in the distribution channel to enhance operational efficiency at Mugher and Dangote Cement Factory. Addressing issues related to delivery organization and transportation facilities could lead to better supply chain performance and ultimately improve organizational performance. This analysis underscores the importance of well-structured distribution channels in supply chain management, which are crucial for achieving competitive advantage and operational success.
Table 7. Information technology.
Descriptive Statistics |
Item | N | Minimum | Maximum | Mean | Std. Deviation |
Documentations are supported by Information Technology | 296 | 1 | 5 | 2.85 | 1.885 |
Handling of in and out inventories are supported by Information Technology | 296 | 1 | 5 | 2.91 | 1.778 |
Information is readily available for planning purpose | 296 | 1 | 5 | 3.15 | 1.775 |
The level of Information Technology based ordering system | 296 | 1 | 5 | 3.22 | 1.816 |
Valid N (listwise) | 296 | |
Source: Survey data (2025)
Information readily available for planning purposes (Mean: 3.15) this mean score indicates a moderately positive perception regarding the availability of information for planning. Participants generally feel that information is somewhat accessible, which is crucial for effective decision-making. (Standard Deviation: 1.775)The standard deviation shows considerable variability in responses, indicating that while many find the information available, others may struggle to access necessary data. Level of information technology-based ordering system (Mean: 3.22) this score reflects a moderately positive perception of the ordering system based on information technology. Participants believe that the IT-based ordering system is functional, though there is room for improvement. (Standard Deviation: 1.816)The high standard deviation suggests variability in opinions, with some participants expressing satisfaction and others indicating dissatisfaction with the ordering system.
Table 8. Dependent Variable Measure performance of supply chain management.
Descriptive Statistics |
Item | N | Minimum | Maximum | Mean | Std. Deviation |
I’m satisfied with availability of well-organized procurement plan | 296 | 1.00 | 5.00 | 3.0891 | .92073 |
I’m satisfied with speed of response to the delivery inquiries | 296 | 1.00 | 5.00 | 3.2327 | 1.00759 |
I’m satisfied with availability of cost efficient distribution system | 296 | 1.00 | 5.00 | 3.2178 | .93153 |
I’m satisfied with profitability of business | 296 | 1.00 | 5.00 | 3.1584 | .90584 |
I’m satisfied with according to order specification | 296 | 1.00 | 5.00 | 3.2525 | .82896 |
Valid N (list wise) | 296 | |
Source: Survey data (2025)
The data reveals a mixed perception of the role of information technology in supporting supply chain management processes. While there are moderately positive views on information availability and the ordering system, participants express concerns regarding documentation and inventory management support. The perceptions highlighted in this table suggest that enhancing the integration of information technology in documentation and inventory management is essential for improving overall supply chain effectiveness at Mugher and Dangote Cement Factory. Addressing these issues could lead to better operational efficiency and contribute to competitive advantage. This analysis emphasizes the importance of robust information technology systems in supply chain management, which can significantly impact organizational performance and decision-making.
Satisfaction with adherence to order specification (Mean: 3.25) this mean score suggests a moderately positive perception of how well orders meet specifications. Participants generally feel that orders are mostly fulfilled as specified, but inconsistencies may exist. (Standard Deviation: 0.82896)The standard deviation indicates a relatively low level of variability, suggesting that most participants agree on the adequacy of order fulfillment.
The data reveals a generally moderate level of satisfaction with various aspects of supply chain management performance. While participants express reasonable satisfaction with procurement planning, response times, distribution efficiency, and order adherence, there is an acknowledgment of the need for improvements, particularly in profitability and organization. These perceptions suggest that enhancing the organization of procurement plans, improving response times to inquiries, and ensuring better adherence to order specifications could lead to improved supply chain performance. Addressing these areas may contribute to greater organizational performance and supply chain performance effectiveness at Mugher and Dangote Cement Factory. This analysis highlights the importance of continuous improvement in supply chain management practices to enhance overall satisfaction and operational effectiveness.
Implications for Supply Chain Performance Effectiveness
The findings suggest that organizations like Mugher and Dangote Cement Factory can achieve effective supply chain performance by: Investing in staff training to enhance skills relevant to supply chain management, optimizing distribution channels to ensure effective delivery and reach, Focusing on inventory management to reduce costs and improve efficiency, Strengthening supplier-buyer relationships to foster collaboration and trust, and Enhancing information sharing to streamline operations and decision-making. In summary, the analysis indicates that various supply chain management practices significantly impact organizational performance. Strategic focus on these areas can lead to improved effectiveness and competitive advantage in the market.
2.1. Regression Analysis
2.1.1. Assumption of Regression
The three most prevalent presumptions are multi-collinearity, autocorrelation, and linearity.
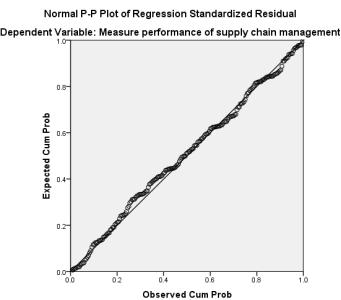
For linear regression to work, the independent and dependent variables must have a linear relationship. The NPP plot, as seen in
Figure 2 below, demonstrates that the dependent and independent variables have a straight line connection, meeting the linearity assumption.
Figure 2. The Normal P-P (Probability-Probability).
The Normal P-P (Probability-Probability) plot provides a visual assessment of whether the residuals (errors) from a regression analysis are normally distributed. Here's how to interpret the plot based on the provided information: In your plot, the points are closely aligned with the diagonal line. This suggests that the residuals are normally distributed. Any significant deviations from the line, especially in the tails, would suggest potential issues with normality. However, since the points appear to follow the line well, this is not a concern here. Overall, the P-P plot indicates that the residuals from your regression analysis are normally distributed, supporting the validity of the model and the conclusions drawn from the analysis of the impact of supply chain management practices on organizational performance.
Autocorrelation refers to the statistical relationship or correlation between the individuals in a set of observations
| [28] | Gujarati, D. N. and Sangeetha, N., 2007. Basic econometrics, 4/e Tata McGraw-Hill. |
[28]
. The Durbin-Watson d statistic can be used to assess the linear regression model for autocorrelation. One may presume that there is no first-order autocorrelation if d is determined to be 2 in an application. The value of d might range from 0 to 4. The autocorrelation assumption is satisfied and there is no autocorrelation, as shown by the value of d in
Table 9 below, which is 2.289, which is near to 2.
Multicollinearity in the data is assumed to be absent in linear regression. When independent variables have a strong correlation with one another, this is known as multicollinearity. The Variance Inflation Factor (VIF) can be used to assess multicollinearity assumptions. Interdependence between independent variables is present if the VIF value is higher than 10
| [28] | Gujarati, D. N. and Sangeetha, N., 2007. Basic econometrics, 4/e Tata McGraw-Hill. |
[28]
.
Table 9. Multicollinearity.
Model | Collinearity Statistics |
Tolerance | VIF |
1 | (Constant) | | |
Supplier buyer relation | .715 | 1.399 |
Customer orientation of Procurement process | .629 | 1.589 |
Inventory management | .614 | 1.627 |
Information sharing/reporting | .577 | 1.732 |
Distribution Channel | .560 | 1.787 |
Human resource /Staff Training | .725 | 1.379 |
Information technology | .952 | 1.050 |
Source: Survey Result (2025)
All tolerance values are above 0.5, indicating that each independent variable has a reasonable amount of variance that is not explained by other variables. All VIF values are below 2, which are well below the threshold of 10, suggesting that there is no significant multicollinearity in the model. The analysis indicates that multicollinearity is not a concern in this regression model. The independent variables can be considered relatively independent of one another, which enhances the reliability of the regression coefficients and overall model results. This supports the validity of the conclusions drawn about the impact of these variables on the performance of supply chain management.
2.1.2. The Impact of Supply Chain Management Practices on Organizational Performance the Case of Mugher and Dangote Cement Factory
Multiple regressions were used for this research to analyses the challenges of supply chain management on Ethiopian cement factories.
R (Correlation Coefficient): (Value: 0.760) this indicates a strong positive correlation between the predictors (supply chain management practices) and the dependent variable (performance of supply chain management). It suggests that as the predictor variables improve, the performance measure also tends to increase. R Square (Coefficient of Determination): Value: (0.578) approximately 57.8% of the variance in the performance of supply chain management can be explained by the independent variables included in the model. This indicates a good level of explanatory power, suggesting that the selected practices significantly contribute to performance outcomes.
Table 10. Model Summary of regression analysis.
Model Summaryb |
Model | R | R Square | Adjusted R Square | Std. Error of the Estimate | Durbin-Watson |
1 | .760a | .578 | .562 | .39586 | 2.289 |
a. Predictors: (Constant), Information technology, customer orientation of Procurement process, Supplier buyer relation, Human resource /Staff Training, Information sharing/reporting, Inventory management, Distribution Channel |
b. Dependent Variable: Measure performance of supply chain management |
Source: Survey Result (2025)
Adjusted R Square: Value: (0.562) this adjusted value accounts for the number of predictors in the model and provides a more accurate measure of fit. An adjusted R Square of 56.2% indicates that the model remains robust even after adjusting for the number of predictors. Standard Error of the Estimate: (Value: 0.39586) this represents the average distance that the observed values fall from the regression line. A smaller standard error indicates a better fit of the model to the data. Durbin-Watson Statistic: (Value: 2.289) this statistic tests for autocorrelation in the residuals. Values close to 2 suggest that there is no autocorrelation. A value of 2.289 indicates that there is no significant autocorrelation, supporting the validity of the regression analysis.
The Case of Mugher and Dangote Cement Factory," the results indicate that the practices assessed (including information technology, customer orientation, supplier-buyer relations, staff training, information sharing, inventory management, and distribution channels) significantly enhance the performance of supply chain management. This supports the notion that effective implementation of these practices can lead to improved organizational performance within the cement industry.
Table 11. ANOVA.
ANOVA |
Model | Sum of Squares | df | Mean Square | F | Sig. |
1 | Regression | 41.581 | 7 | 5.940 | 37.907 | .000b |
Residual | 30.400 | 288 | .157 | | |
Total | 71.982 | 295 | | | |
a. Dependent Variable: Measure performance of supply chain management |
b. Predictors: (Constant), Information technology, customer orientation of Procurement process, Supplier buyer relation, Human resource /Staff Training, Information sharing/reporting, Inventory management, Distribution Channel |
Source: Survey Result (2025)
The regression model explains a significant portion of the variance in the performance of supply chain management, as indicated by the significant F-statistic and the low p-value. The variation explained by the model (41.581) is substantial relative to the unexplained variation (30.400), suggesting that the practices analyzed contribute meaningfully to performance outcomes. The case of Mugher and Dangote Cement Factory, the ANOVA results indicate that the regression model is statistically significant. This suggests that the various supply chain management practices included in the analysis (such as information technology, customer orientation, supplier-buyer relations, staff training, information sharing, inventory management, and distribution channels) collectively have a meaningful impact on the performance of supply chain management. Thus, organizations can benefit from focusing on these practices to enhance their performance.
The p-value for significance shows how much the independent variable adds to the model. In general, a p-value of less than 0.05 is regarded as statistically significant. Inventory management: p = 0.016 (significant), supplier-buyer relationship: p = 0.015 (significant). Distribution Channel: p = 0.028 (significant), Information Technology: p = 0.111 (not significant), Customer Orientation of Procurement Process: p = 0.485 (not significant), Human Resource/Staff Training: p < 0.001 (very significant), and Information Sharing/Reporting: p = 0.010 (significant).
Table 12. Coefficients.
Model | Unstandardized Coefficients | Standardized Coefficients | t | Sig. |
B | Std. Erro | Beta |
1 | (Constant) | .654 | .170 | | 3.846 | .000 |
Supplier buyer relation | .110 | .045 | .135 | 2.454 | .015 |
Customer orientation of Procurement process | .024 | .035 | .041 | .700 | .485 |
Inventory management | .100 | .041 | .145 | 2.429 | .016 |
Information sharing/reporting | .123 | .047 | .159 | 2.584 | .010 |
Distribution Channel | .093 | .042 | .138 | 2.213 | .028 |
Human resource /Staff Training | .357 | .048 | .409 | 7.462 | .000 |
Information technology | .051 | .032 | .077 | 1.600 | .111 |
Source: Survey Result (2025)
Human Resource / Staff Training are the most significant predictor, with the largest impact on the performance of supply chain management. Other significant predictors include Supplier Buyer Relation, Inventory Management, Information Sharing/Reporting, and Distribution Channel, indicating their positive contributions to performance. Customer Orientation of Procurement Process and Information Technology are not significant predictors in this model.
The results suggest that certain supply chain management practices significantly enhance organizational performance. Focusing on improving human resource training and strengthening relationships with suppliers will likely yield substantial benefits in performance. Additionally, while other practices also have positive impacts, not all are equally significant, guiding management on where to prioritize their efforts for optimal results.
2.2. Correlation Analysis
All independent variables show significant positive correlations with the dependent variable, indicating that as each independent variable improves so does the performance of supply chain management. The strongest correlation is with (Human Resource / Staff Training), highlighting its critical role in enhancing supply chain performance. Conversely, (Customer Orientation of Procurement Process) has the weakest correlation, suggesting it may have a smaller impact relative to the other factors.
The findings suggest that organizations like Mugher and Dangote Cement Factory can achieve Effective Supply Chain Performance by: Investing in staff training to enhance skills relevant to supply chain management, Optimizing distribution channels to ensure effective delivery and reach, Focusing on inventory management to reduce costs and improve efficiency, Strengthening supplier-buyer relationships to foster collaboration and trust, and Enhancing information sharing to streamline operations and decision-making. In summary, the analysis indicates that various supply chain management practices significantly impact organizational performance. Strategic focus on these areas can lead to improved effectiveness and competitive advantage in the market.
3. Results Discussion
3.1. Supplier Partnership
As shown in
Table 12, beta (B) values for supplier partnership are 0.110, and the p-value is (p˂0.01). A positive relationship was found between supplier-buyer relations and supply chain performance, with a statistically significant P-value. This suggests that effective collaboration and communication between suppliers and buyers can enhance overall supply chain efficiency. Strong supplier relationships likely facilitate better negotiation, timely deliveries, and improved service levels. This suggests that manufacturers' performance will increase by 11% on average for every 1% improvement in supplier partnership, while p˂0.05 indicates that supplier partnership is significant at the 5% level of significance. We can therefore draw the conclusion that the performance of the Mugher and Dangote cement factories is significantly impacted by the difficulty of supplier partnerships, supporting previous findings by
| [23] | Lambert, D. M. and Cooper, M. C., 2000. Issues in supply chain management. Industrial marketing management, 29(1), pp. 65-83. |
[23]
. This study emphasizes the importance of strong relationships between suppliers and a buyer, highlighting that collaboration leads to improved supply chain performance.
3.2. Inventory Management
Inventory Management (Coefficient: 0.100, P-value: 0.016): The results indicate a significant positive effect of inventory management on supply chain performance. Effective inventory management minimizes excess stock and reduces holding costs while ensuring that the supply chain can respond quickly to market demands, thereby enhancing overall performance, supporting previous findings by
| [24] | Christopher, M., 2016. Logistics and supply chain management: logistics & supply chain management. Pearson UK. |
[24]
Christopher outlines how effective inventory management strategies can lead to reduced costs and improved service levels, thereby enhancing overall supply chain performance.
3.3. Information Sharing/Reporting
Information Sharing/Reporting (Coefficient: 0.123, P-value: 0.010): The significant relationship suggests that sharing information among stakeholders in the supply chain leads to better decision-making and responsiveness. This transparency can enhance coordination and trust, which are crucial for optimizing supply chain operations, supporting previous findings by
| [25] | Fisher, S. G. and Fisher, R. I., 2004. The epidemiology of non-Hodgkin's lymphoma. Oncogene, 23(38), pp. 6524-6534. |
[25]
. Fisher emphasizes the critical role of information sharing in supply chains, noting that better communication among stakeholders can lead to improved responsiveness and performance.
3.4. Distribution Channel
Distribution Channel (Coefficient: 0.093, P-value: 0.028) the findings indicate that effective distribution channels positively impact supply chain performance. This suggests that well-structured distribution networks contribute to timely deliveries and customer satisfaction, which are essential for competitive advantage; supporting previous findings by
| [26] | Lee, H. L., 2004. The triple-A supply chain. Harvard business review, 82(10), pp. 102-113. |
[26]
Lee discusses the importance of agile and responsive distribution channels for ensuring customer satisfaction and competitive advantage in supply chain management.
3.5. Analysis of Interview Questions
According to the interviews with various factory workers in the planning, marketing, logistics, and distribution departments as well as certain distribution agents, supply chain management is crucial to the operation of the plant. In particular, every interviewee concurred that there is inadequate customer relationship management and that much effort needs to be done to significantly affect organizational competitiveness. In addition, the respondents informed the researcher that while various supply chain management techniques are beneficial, internal integration issues as well as issues with the quality and quantity of information impede efficient operations.
The interviewer inquired about the company's clients and rivals. In response, the management states: "The company has a large number of customers, including individuals, government agencies, and Betoch Agencies. Habesha cement, Dangote cement, Derba cement, and Mesobo cement are our main rivals.
The interviewer also inquired as to whether he believed that their clients were aware of pricing adjustments. According to the manager, it was not justified. The interviewer asked, "What are you going to do when the customer does not perceive the price change?" after receiving this response. They wouldn't do anything, he claimed. This indicates that the business disregards consumer response. It is true that high switching costs and the high startup costs for competitive businesses deter new entrants. Mugher Cement Enterprise benefits from it. Ignoring consumer insight, however, could cost you market share. It is not the right technique to accomplish the company's goal.