Research Article | | Peer-Reviewed

Effect of Furrow Method and Irrigation Levels on Yield of Wheat and Water Productivity in Oda Bultum District Oromia, Ethiopia

Published in Reports (Volume 6, Issue 3)
Received: 6 May 2026     Accepted: 1 July 2026     Published: 11 August 2026
Views:       Downloads:
Abstract

Ethiopian government policies have promoted irrigation expansion particularly for cereal crops as a means to boost agricultural growth, reduce production risk, alleviate rural poverty, and improve food security. The experiment was conducted in Oda Bultum District for two consecutive years to evaluate and determine the optimal irrigation water level and application under furrow irrigation for wheat, and to identify the economic water use efficiency and net benefits of deficit irrigation. Two furrow-irrigation methods (conventional and alternate) and four irrigation levels (55%, 70%, 85%, and 100% of ETc) were used. The experiment followed a randomized complete block design (RCBD) with eight treatments replicated three times. Both physical and chemical soil samples were taken and analyzed. Except for plant height, most wheat agronomic parameters differed significantly between treatments (P < 0.05). The highest grain yield occurred with conventional furrow irrigation at 100% ETc. Although 100% ETc with the conventional method produced the maximum yield, it had lower water productivity and a lower marginal rate of return, and it did not promote irrigation water savings. Therefore, for a balance of yield and water savings, conventional furrow irrigation at 70% ETc is recommended; for drought-prone and water-scarce areas, alternate furrow irrigation at 100% ETc is recommended as an option for small-scale farmers.

Published in Reports (Volume 6, Issue 3)
DOI 10.11648/j.reports.20260603.12
Page(s) 46-56
Creative Commons

This is an Open Access article, distributed under the terms of the Creative Commons Attribution 4.0 International License (http://creativecommons.org/licenses/by/4.0/), which permits unrestricted use, distribution and reproduction in any medium or format, provided the original work is properly cited.

Copyright

Copyright © The Author(s), 2026. Published by Science Publishing Group

Keywords

Convention, Alternate, Furrow Methods, Irrigation Level, Wheat, Oda Bultum

1. Introduction
Agriculture is the cornerstone of Ethiopia’s economy, contributing to over 85% of the country’s gross domestic product. Economic growth slowed to 7.7% in 2017/2018, down from a 10.9% rise in 2015/2016. That year’s growth reflected a 12.2% increase in industrial output, an 8.8% expansion in services, and a 3.5% rise in agricultural production . Crop production is a key driver of GDP, representing roughly 28% of agriculture’s sub-sectors . Cereal crops supply the bulk of daily caloric intake and thus form the primary livelihood for millions of Ethiopian smallholder households . Teff, wheat, maize, sorghum, and barley together occupy nearly three-quarters of cultivated land, and households allocate about 40% of their food budgets to cereals . In 2011/2012 cereals accounted for 188.09 million quintals of the country’s total grain output. By 2014/2015 total grain production had climbed to 270.4 million quintals, with cereals comprising 235.45 million quintals (CSA, 2015). Total grain output in 2015/2016 rose by 2.41% compared with 2014/2015 (CSA, 2016). Another report records total wheat production at 267.8 million quintals in 2017/2018 and 277.7 million quintals in 2018/2019, a 3.67% increase between those two seasons. Wheat (Triticum aestivum L.) is widely produced and traded worldwide, occupying about 15% of global cereal sowing area . It is a major food and industrial grain, ranking second among global cereals after rice and is widely traded internationally .
Many African nations grow wheat for both household use and sale, but production and marketing levels differ across countries. In sub-Saharan Africa, wheat is also a key crop that supports farmers’ incomes and strengthens food security .
Ethiopia ranks among the top wheat producers by cultivated area and total output . With water becoming increasingly scarce, sustainable agricultural water use is a priority; implementing irrigation water-saving plans while maintaining acceptable yields can help conserve this limited resource . Deficit irrigation is one such water saving approach, in which crops experience controlled water stress during a particular growth stage or throughout the season . A crop’s ability to tolerate deficit irrigation varies with its phonological stage .
The impact of deficit irrigation on yield and product quality differs by crop . In Ethiopia, surface methods account for about 97.8% of irrigation, with furrow systems dominant in both smallholder and many commercial operations . Furrows work well for row crops vegetables, sugar beet, cotton, maize, potatoes, and tomatoes especially when plants are grown on raised beds and can be harmed if water contacts crowns or stems . Furrow systems include conventional furrow irrigation (CFI), fixed furrow irrigation (FFI), and alternate furrow irrigation (AFI). In CFI every furrow is watered at each irrigation event; this method is often inefficient where water is scarce because it can cause excessive deep percolation near the upstream end, inadequate wetting downstream, and substantial runoff, leading to low application efficiency and poor distribution uniformity.
Irrigating every other furrow at each watering, so only alternate furrows receive water helps make irrigation more efficient . This approach leaves half of the root zone moist while the other half stays dry. For many years, Ethiopian policy has encouraged expanding irrigation, especially for cereals, to boost agricultural growth, reduce production risk, combat rural poverty, and improve food security.
Producing wheat under irrigation is an appealing enterprise because it helps the country achieve food self-sufficiency, supplies animal feed for pastoralists, and reduces the need for foreign exchange. Despite these benefits, wheat yields remain below the global average (3.3t ha-1). This underperformance stems from multiple causes, notably biotic factors (diseases, pests, and weeds), abiotic stresses, and slow uptake of modern agricultural technologies. Studies and alsonote that global wheat demand is rising while production faces mounting challenges of climate change, higher input costs, and intensifying biotic and abiotic pressures, which together make the wheat supply chain increasingly unstable. In Ethiopia’s irrigated lowlands, abiotic constraints include extreme temperatures, soil salinity, drought and flooding, and unfavorable soil pH and salinity .
Wheat production is a central government strategy for reducing poverty and famine and for shifting the country from being an importer to an exporter. In the area, wheat is the second most important crop after maize in both production and consumption. However, water is the primary limiting factor: the region’s rainfall amount and distribution are insufficient to support crop growth and development. Consequently, rivers and groundwater are used for irrigation, and communities want to expand irrigated area despite limited water resources.
In arid and semi-arid regions, using deficit irrigation can yield higher economic returns than trying to maximize crop yield per unit of water. Deficit irrigation applying less water than full crop demand can increase water use efficiency (WUE) without significantly reducing yield. However, few studies have evaluated deficit irrigation or the performance of irrigation systems in the study area. Therefore, this research aims to address the mismatch between limited irrigation water and high wheat production demands by: assessing the optimal furrow irrigation practices for wheat, identifying the best irrigation water level and application schedule, and determining the economic water use efficiency and net benefits of deficit irrigation.
2. Materials and Methods
2.1. Description of Study Area
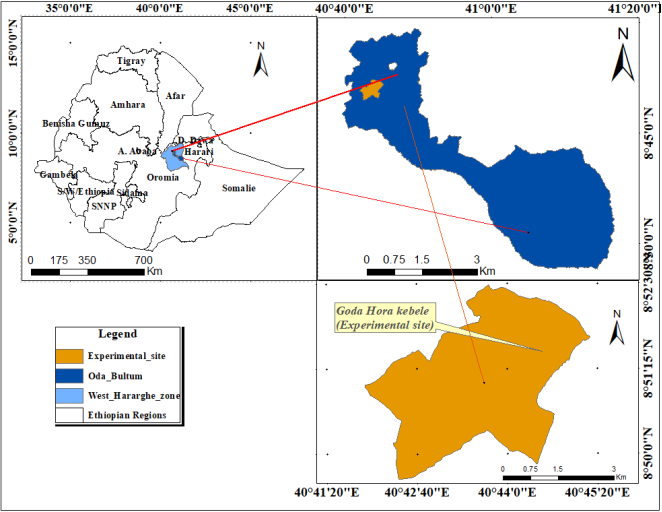
The experiment site is in West Hararghe Zone in Oda Bultum district Goda hora kebele. The area is located 265 km away from Addis Ababa, the capital city of Ethiopia.
Figure 1. Geographical location map of the study area.
2.2. Experimental Design and Treatment
The experiment used a two-factor factorial design: two irrigation methods and three irrigation water levels. Treatment combinations were laid out in a completely randomized block design with three replications. Applied water depth for each treatment was measured using a Parshall flume with a 3-inch throat diameter. An effective head of 5 cm was set, and the resulting discharge from the flume was calibrated according to the target flow rates. Each treatment occupied a 4 m by 5 m plot, with 1 m alleyways between plots and 1.5 m spacing between blocks.
Treatment Combinations
T1. Conventional Furrow Irrigation at 100% ETC CFI 100%
T2. Conventional Furrow Irrigation at 85% ETC CFI 85%
T3. Conventional Furrow Irrigation at 70% ETC CFI 70%
T4. Conventional Furrow Irrigation at 55% ETC CFI 55%
T5. Alternative Furrow Irrigation at 100% ETC AFI 100%
T6. Alternative Furrow Irrigation at 85% ETC AFI 85%
T7. Alternative Furrow Irrigation at 70% ETC AFI 70%
T8. Conventional Furrow Irrigation at 55% ETC CFI 55%
2.3. The Collected Data
2.3.1. Soil Sample Collection and Analysis Methods
Composite disturbed and undisturbed soil samples from each treatment were collected prior to planting at depths of 0-20 cm and 20-40 cm. These samples will be analyzed in the laboratory for physical properties (bulk density, texture, field capacity, and permanent wilting point) and chemical properties, including soil pH.
2.3.2. Soil Physical and Chemical Properties
Soil texture was determined using the pipette method, which relies on measuring the suspension’s concentration directly. According to Stokes’s law, at a depth L below the suspension surface and at time t, particles with terminal velocities v greater than the critical velocity will have settled past that depth for example, silt will pass below while clay remains in suspension. Soil pH was measured with a pH meter in a 1: 1 soil-to-water mixture. Bulk density was defined as the oven-dry mass of undisturbed soil per unit field volume and was measured using the core sampler technique. Field samples were taken with the core sampler, weighed, then oven-dried at 105°C for 24 hours. After drying they were weighed again to obtain the dry mass, and bulk density was calculated using the standard formula.
Pb=WdVv(1)
Where: - Ρb= Soil bulk-density, (g/cm3)
Wd = weight of dry soil, (g)
Vc = volume of core sampler, (cm3)
A double-ring infiltrometer was employed to determine soil infiltration rates. Measurements were taken at seven randomly chosen locations across the experimental site, and the mean infiltration value was calculated from readings recorded at regular time intervals. Field capacity (FC) and permanent wilting point (PWP) were measured with a pressure-plate apparatus by applying suctions of 1/3 bar and 15 bars, respectively, to saturated soil samples; when no further water drained from the sample, the remaining moisture was recorded as FC and PWP. Soil pH was measured in a 1: 1 soil-to-water slurry using a pH meter.
Climate data of the study area
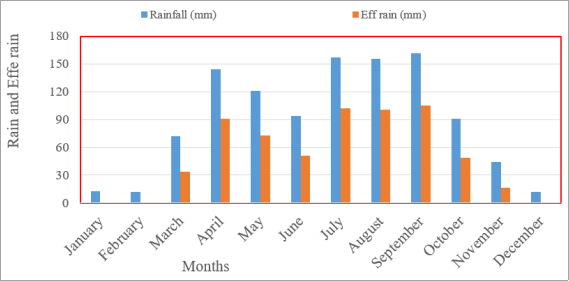
Figure 2. Graph of rainfall of Badessa town meteorology station.
Table 1. Long term monthly average climatic data of the study area.

Month

Tmin °C

Tmax °C

RH%

Wind km/hr.

Sun hours

Rad MJ/m2/day

Eto (mm/day)

January

11.3

28.1

74

69

6.8

17.7

3.36

February

12.9

29.7

76

85

8.3

21

4.12

March

13.9

30.1

69

87

7.7

21.2

4.38

April

14.3

29.5

70

91

6.6

19.7

4.19

May

14.4

28.2

90

65

7

19.8

3.87

June

14.3

27.9

65

45

6.8

19.1

3.76

July

14.6

26.8

70

42

6.2

18.3

3.58

August

14.4

26.8

75

41

6.5

19.2

3.71

September

13.8

27.0

74

40

6.5

19.3

3.71

October

11.9

27.6

80

42

6.4

18.4

3.51

November

10.5

28.0

85

55

8.1

19.7

3.61

December

9.90

27.6

88

56

9.4

20.8

3.62

Average

13

28.1

76

60

7.2

19.5

3.79

2.3.3. Crop Agronomic Data
The basic wheat agronomic data; plant height, spike length, number tiller and grain yield were taken. The effective root zone depth (RZD) of wheat was ranged between 1-1.5 m and it has an allowable soil water depletion fraction (P) of 0.40 . Wheat average Kc was taken after adjustments completed for the initial, mid, late-season and maturity stage to be 0.4, 0.8, 1.2 and 0.7, respectively . Soil moisture was determined by the gravimetrical method and the amount of applied water per all irrigation events was measured using an adjusted Parshall flume.
2.3.4. Crop Water Determination
Crop water requirement is the volume of water that must be supplied to a crop, while crop evapotranspiration denotes the water lost by the crop through evaporation and transpiration . Estimating crop water requirement depends primarily on climatic influences, represented by the reference evapotranspiration (ETo), and on crop-specific factors summarized by the crop coefficient (Kc) . To compute ETo, long-term and daily climate records for the study area maximum and minimum air temperature, relative humidity, wind speed, sunshine duration, and rainfall were collected. Crop parameters (growing season, Kc values and development stages, effective root depth, and the crop’s critical depletion factor), together with soil properties (maximum infiltration rate and total available water), were determined and input into the CROPWAT model to calculate the crop water requirement for tomato.
ETc= ETo*Kc.(2)
Where, ETc = crop evapotranspiration,
Kc = crop coefficient and
ETO = reference evapotranspiration
2.3.5. Irrigation Water Management
The total available water (TAW), stored in a unit volume of soil can be obtained from the equation:
TAW= (FC- PWP)BD*Dz)/100(3)
The depth of irrigation water supplied at any time was determined by the expression:
Inet= (ETc- Peff)(4)
The gross irrigation requirement was found from the expression:
Ig= InEa(5)
Ea = Application efficiency of the furrow (60%)
The time required to distribute the desired depth of water into each furrow will be calculated using the equation:
t= (d*l*w)6Q(6)
Where: d= gross depth of water applied (cm), t= application time (min), l= furrow length in (m),
w= furrow spacing in (m), and Q= flow rate (discharge) (l/s)
Water Productivity
Physical water productivity was determined by dividing the yield to seasonal evapotranspiration and total seasonal irrigation water applied, and calculated by the following equation. Irrigation water productivity measures agricultural output per unit of water, while irrigation water efficiency measures the proportion of water supplied that is used by the crop.
WP=YaETc(7)
Where:
WP = is water Productivity (Kg/m3),
Ya is actual yield (Kg/m2) and ETc is seasonal crop evapotranspiration (m3/m2).
Partial Budget Analysis
Economical evaluation of deficit irrigation is analyzing the cost spent during the growing season and the benefit gained from yield produced by the application of water. Marginal Rate of Return (MRR) was used for analysis by the CYMMYT method . Economic water productivity was calculated based on the information acquired at the study site: the size of the irrigable area, the price of water applied, and the income gained from the sale of tomato yield in view of the local market price. Yield and economic data will be collected to evaluate the benefits of the application of different levels of water in deficit irrigation treatments. Economic data includes input costs like a cost for water (water pricing), seeds, fertilizers, fuel, and labor.
However, the cost of water pricing and yield sale price will the only cost that varies between treatments. The net income (NI) treatments were calculated by subtracting total cost (TC) from gross income (GI) and were computed as
NI= (GI-TC)(8)
The difference between the net income of treatment and its next higher variable cost treatment is termed as a change in net income (ΔNI). Higher net benefits may very much higher costs . Therefore, it is required to calculate marginal costs with the extra marginal net income. The marginal rate of return (MRR) indicates the increase of the net income, which is produced by each additional unit of expenditures and it is computed as follows:
MRR= (NIVC)(9)
Where, MRR= marginal rate of return,
ΔVC= change in variable cost and
ΔNI= change in net income
2.4. Statistical Analysis
The collected data were analyzed using R software and the least significant difference (LSD) was employed to see a mean difference between treatments and the data collected were statistically analyzed following the standard procedures applicable for RCBD with a factorial. The treatment means that will be different at 5% levels of significance will be separated using the LSD test.
3. Results and Discussion
Soil Physical and Chemical Properties of Experimental Site.
Table 2. Soil physical properties of the study area.

Depth (cm)

Bulk density

FC (v/v)

PWP (v/v)

TAW (mm/m)

0-15

1.12

35

18

190.4

16-30

1.15

38

21

195.5

Soil physical properties such as texture, structure, bulk density, porosity, water retention, and infiltration rate profoundly affect irrigated wheat growth and yield. Optimal soil bulk density (BD) for irrigated wheat is 1.1 to 1.4 g cm-3. Above 1.55, soil compaction restricts root growth, reduces water infiltration, and can cause up to a 38% penalty in grain yield. Accordingly bulk density of the experimental site has positive effect on irrigated wheat in the study area (Table 2).
Table 3. Soil chemical properties of the experimental site.

Depth (cm)

PH

EC (ds/cm)

OC (%)

Av. P (ppm)

TN (%)

Av. K (mg/kg)

CEC (meq/100gmsoil)

Texture

Sand (%)

Clay (%)

Silt (%)

Text classes

0-20

7.57

0.53

2.15

13.12

0.25

249

54.08

58

2

40

Sandy loam

20-40

7.47

0.84

2.05

7.43

0.18

202

51.72

66

2

32

Sandy loam

Soil chemistry strongly influences irrigated wheat yields by controlling nutrient availability and root health. For best results, soils should be slightly acidic to neutral (pH 6.0 -7.0). Balanced macronutrients especially nitrogen and potassium adequate organic matter, and low salinity/sodicity are also essential. Wheat performs well within the 6.0-7.0 pH window. It has moderate salinity tolerance, but higher salt levels cause osmotic stress and reduce yields. Ideal irrigated wheat soils have a cat ion exchange capacity (CEC) of about 20-40 cmolc/kg; CEC below ~10 cmolc/kg reduces nutrient-holding capacity, while values above 40 cmolc/kg can lead to compaction and poor drainage. Keeping CEC in the 20-40 range improves fertilizer use, water productivity, and yield potential.
Combined effect of irrigation methods and levels on wheat grain yield
Table 4. Effect of irrigation methods and levels on different plant agronomic parameters.

Treatment

Parameters

Irrigation method

Irrigation levels (%ETo)

Plant height (cm)

No of tiller

Spike length (cm)

Yield (kg/ha)

Conventional Furrow Irrigation

100

70.73

6.4a

9.6a

5.73a

85

70.80

6.13a

9.13ab

5.14ab

70

71.10

5.6ab

9.25ab

4.78b

55

70.67

5.4ab

9.03ab

4.61b

Alternate Furrow Irrigation

100

68.00

5.57ab

9.37a

4.43bc

85

69.80

5.87ab

9.33ab

4.39bc

70

67.27

5.53ab

8.97ab

3.73cd

55

66.80

4.767b

8.12b

3.44cd

Mean

69.40

5.66

5.66

4.00

LSD

NS8.12

1.14

1.14

7.55

CV%

6.7

11.2

11.2

14.3

Plant Height
Plant height differed significantly among all treatments (P < 0.05) during the irrigation experimental season. The tallest plants were produced by the CFI + 100% ETc treatment, followed by conventional furrow irrigation at 85%ETc. The shortest plants occurred under alternate furrow irrigation at 55% ETc, where severe water stress reduced height (Table 3).
Effective tiller
As shown in Table 3, plant height differed significantly among treatments (P < 0.05). The tallest plants occurred under conventional furrow irrigation (CFI) with 100% crop evapotranspiration, while the shortest were observed under alternate furrow irrigation (AFI) at 55% crop evapotranspiration. This pattern was consistent across both experimental seasons, indicating that differing irrigation methods and water levels affected wheat tiller number and overall productivity greater water stress reduced tiller effectiveness.
Spike length
Spike length was strongly influenced by water stress across the different irrigation levels and methods (Table 3). The longest spikes (8.90 cm) occurred under conventional furrow irrigation with 100% crop evapotranspiration, while the shortest (6.08 cm) were observed with alternate furrow irrigation at 55% crop evapotranspiration, reflecting the impact of severe water deficit.
The results show a direct relationship between the amounts of water applied and plant height. In contrast, the number of tillers per plant did not differ significantly between treatments (P < 0.05) during the 2024 irrigation season, although numeric differences among treatments were present. Spike length and grain yield, however, showed highly significant differences. Both parameters reached their highest values under conventional furrow irrigation with 100% crop evapotranspiration (ETc), with grain yields of 5.6 t ha-1 (followed by 50.9 t ha-1 please confirm this value). The lowest wheat grain yield (3.75 t ha-1) occurred under alternate furrow irrigation at 85% ETc. These findings are consistent with , which reported a grain yield of 6.23 t ha-1 in Arsi.
Grain yield
Except for plant height, most parameters differed highly significantly among treatments (P < 0.05). The highest values for tiller number (6.4), spike length (9.6 cm), and grain yield (5.9 t ha−1) were observed under conventional furrow irrigation at 100% crop evapotranspiration. Applied water volume was directly related to wheat grain yield, reflecting the soil’s water-holding capacity. Grain yield declined as water stress increased, while water use efficiency rose with increasing stress .
Across the two-year study, most treatment effects differed significantly (P < 0.05), except for plant height (Table 4). The greatest number of tillers per plant (6.40) occurred with conventional furrow irrigation (CFI) at 100% crop evapotranspiration (ETc), followed by CFI at 85% ETc (6.13). Spike length was also highest under CFI at 100% ETc, next highest under CFI at 85% ETc, and lowest under alternate furrow irrigation (AFI) at 55% ETc. These differences are attributable to the irrigation method and the amount of water applied, which affected tiller number and spike length (Table 4).
Grain yield of wheat in Oda Bultum District (West Hararghe Zone) differed significantly among treatments over the two seasons (P < 0.05). The maximum grain yield (5.6 t ha-1) was obtained with CFI at 100% ETc, followed by CFI at 85% ETc; the lowest yield was recorded under AFI at 55% ETc. AFI at 100% ETc can save substantial water about 50% compared with CFI at 100% ETc while still producing a relatively high yield (4.43 t ha-1) versus the 5.6 t ha-1 from CFI at 100% ETc. The key irrigation trade-off is conserving water without unduly reducing crop production and productivity.
Water productivity and Amount of saved Water
Table 5. Water productivity and amount of saved water.

Treatments

Water Productivity (kg/m3)

Amount of applied Water (m3/ha)

Amount of Saved water

Area of land irrigated by saved water (ha)

CFI

100

2.31d

1787.5

0

85

3.21d

1518.75

268.8

0.2

70

3.61cd

1250

537.5

0.4

55

3.75bcd

987.5

800

0.8

AFI

100

5.05bc

893.75

893.8

1

85

5.76b

759.375

1028.2

Not Accepted

70

5.97ab

625

1162.5

55

6.77a

493.75

1293.8

Mean

4.58

LSD

1.07

CV%

13.4

Water productivity varied significantly among furrow irrigation methods and irrigation application levels for wheat grain yield. The 55% AFI treatment achieved the highest water productivity at 6.77 kg/m3, while the conventional furrow irrigation at 100% ETc produced the lowest value of 2.31 kg/m3 (Table 4). Alternate furrow irrigation reduced irrigation water use by 50% compared with the control (100% ETc conventional furrow). These findings show that deficit irrigation improves wheat water productivity. The 100% ETc alternate furrow irrigation treatment delivered higher water productivity while saving 220 mm (50%) of water (Table 3). In contrast, the control treatment (CFI at 100% ETc) produced the lowest WP. Although the 100% AFI method reduced yield by 10.33% compared with the control, this decline is within an acceptable range (Table 5). This result agrees with earlier work showing that yield reductions become proportionally larger as water deficit increases, and with reports that alternate furrow irrigation often yields higher water-use efficiency than conventional furrows . Many studies have aimed to maximize irrigated-crop performance, efficiency, and profitability, but research into water-saving irrigation continues. While farmers often apply full irrigation to meet crop evapotranspiration and maximize yield, this practice is increasingly seen as a luxury; modest reductions in applied water can often be made with little or no loss in profitable yield . Recently, water-saving irrigation approaches have been promoted to improve water productivity.
Table 6. Economic cost benefit ration of wheat under different irrigation method and levels.

Treatment

Yield

Adj Yield

Gross Benefit

Variable cost

Net benefit

%MRR

Irrigation method

Irrigation levels

CFI

100

5730

5157

412560

22343.8

390216.3

1746.4

85

5140

4626

370080

18985.0

351095.0

1849.33

70

4780

4302

344160

15625.0

328535.0

2102.64

55

4610

4149

331920

12343.8

319576.3

2588.97

AFI

100

4430

3987

318960

11172.5

307787.5

2754.87

85

4390

3951

316080

9492.5

306587.5

3229.78

70

3730

3357

268560

7812.5

260747.5

3337.57

55

3440

3096

247680

6172.5

241507.5

3912.64

Price of irrigation water 12.5 ETB/m3 yield (kg/ha) and Price (ETB)
The highest marginal rate of return (MRR) was obtained (3912.64ETB) on the application of alternate furrow irrigation combined with 55%ETc followed by AFI+70%ETc and the minimum marginal rate of return (MRR) recorded (1746.4ETB) on conventional furrow irrigation combined with 100%ETc (Table 6).
Summary and Recommendation
The experiment was carried out over two consecutive years in Oda Bultum District to evaluate how different irrigation levels and methods affect wheat grain yield. Across both years, treatments that adjusted irrigation significantly affected plant height, number of tillers, spike length, and grain yield. The control—conventional furrow irrigation at 100% ETc—showed the lowest water productivity. Alternate furrow irrigation at 100% produced a 22.7% lower yield than the control, a reduction considered tolerable, and delivered the highest water use efficiency compared with conventional furrow irrigation. Numerous studies have explored irrigated crop management to improve furrow irrigation performance, efficiency, and profitability. Conventional furrow irrigation at 85% ETc produced the greatest plant height, tiller number, spike length, and grain yield. The maximum economic return observed was 390,216.3 birr per hectare, with a favorable marginal rate of 1,746.4% and water productivity of 2.31 kg/m3. A key goal of deficit irrigation is to expand the irrigated area using conserved water without substantially reducing yield. Using conventional furrow irrigation at 70% ETc was economically acceptable and suitable as a deficit-irrigation level.
Recommendation
Therefore, application of conventional furrow irrigation method with 70%Etc which is 30 deficits and alternate furrow irrigation method with 100%ETc recommended for wheat production to the study area and similar agro-ecology.
Abbreviations

AFI

Alternate Furrow Irrigation

CFI

Conventional Furrow Irrigation

ETB

Ethiopian Birr

ETc

Crop Evapotranspiration

MRR

Marginal Rate Return

Acknowledgments
The authors are would like to give thanks to the Oromia Agricultural Research Institute for funding this research and providing necessary facilities. Finally, thanks to Mr. Ayyal D. and Wozir M. for their technical assistance during the experiment.
Author Contributions
Bayisa Muleta: Conceptualization, Methodology, Formal Analysis, Data curation, Writing – original draft, Writing – review & editing
Ayana Bulti: Investigation, Data curation, Project administration, Supervision
Conflicts of Interest
Authors declare that there is no conflict of interest and this is the original experimental research of Mechara Agricultural Research Center Irrigation water harvesting and Drainage Engineering research team work.
References
[1] Admassu, B., W. Friedt and F. Ordon. 2009. Stem rust seedling resistance genes in Ethiopian wheat cultivars and breeding lines. African Crop Science Journal 20: 149-161.
[2] Allen, R. G., Pereira, L. S., Raes, D. and Smith, M., 1998. Crop evapotranspiration-Guidelines for computing crop water requirements-FAO Irrigation and drainage paper 56. Fao, rome, 300(9), p. D05109.
[3] Amentae, T. K., Hamo, T. K., Gebresenbet, G., & Ljungber (2017). Exploring wheat value chain focusing on market performance, post-harvest loss, and supply chain management in Ethiopia: The case of Arsi to Finfinnee market chain. Journal of Agricultural Science, 9(8), 22.
[4] Andreas, E. L., 2002. Parameterizing scalar transfer over snow and ice: A review. Journal of Hydrometeorology, 3(4), pp. 417-432.
[5] Asadallah, N. 2014. Wheat production price performance prediction in the Iranian north province.
[6] CIMMYT Economics Program, 1988. From agronomic data to farmer recommendations: An economics training manual (No. 27). CIMMYT.
[7] Costa, J. M., Ortuño, M. F. and Chaves, M. M., 2007. Deficit irrigation as a strategy to save water: physiology and potential application to horticulture. Journal of integrative plant biology, 49(10), pp. 1421-1434.
[8] CSA. (2019). Agricultural sample survey report on area and production of major crops (Private peasant holdings, Meher season 2017/2018 (2010 E. C.).
[9] Doorenbos, J. and Pruitt, W. O., 1977. Guidelines for predicting crop water requirements.
[10] Duguma, B., Tegegne, A., & Hegde, B. P. 2012. Smallholder livestock production system in Dandi district, Oromia Regional State, central Ethiopia. Global Veterinaria, 8(5), 471-479.
[11] Elias Meskelu, Abraham Woldemichael and Tilahun Hordofa 2017. Effect of Moisture Stress on Yield and Water Use Efficiency of Irrigated Wheat (Triticum aestivum L.) at Melkassa, Ethiopia. Academic Research Journal of Agricultural Science and Research.
[12] Evans, E. A., 2005. Marginal Analysis: An Economic Procedure for Selecting Alternative Technologies/Practices: FE565/FE565, 6/2005. EDIS, 2005 (7).
[13] Falola, A., Achem, B. A., Oloyede, W. O., & Olawuyi, (2017). Determinants of commercial production wheat in Nigeria: A case study of Bakura local gernment area, Zamfara state. Trakia Journal of Sciences, 15(4), 397-404.
[14] Food and Agricultural Organization (FAO). 2014. Analysis of price incentives for wheat in Ethiopia. Technical notes series, MAFAP, by Wak M. B., Lanos B.
[15] Gain, A. K. and Wada, Y., 2014. Assessment of future water scarcity at different spatial and temporal scales of the Brahmaputra River Basin. Water resources management, 28(4), pp. 999-1012.
[16] Istan bullu oglu, A., Gocmen, E., Gezer, E., Pasa, C. and Konukçu, F., 2009. Effects of water stress at different development stages on yield and water productivity of winter and summer safflower (Carthamus tinctorius L.). Agricultural Water Management, 96(10), pp. 1429-1434.
[17] Kiss, I. 2011. Significance of wheat production in world economy and position of Hungary in it. Abstract: Applied studies in agribusiness and commerce [Thesis]. University of Debrecen.
[18] Michael, A. M., 2009. Irrigation theory and practice-2Nd Edn: Theory and Practice. Vikas publishing house.
[19] Minot, N., Warner, J., Lemma, S., Kasa, L., Gashaw, A Rashid, S. 2015. The wheat supply chain in Ethiopian Patterns, trends, and policy options. International Food Policy Research Institute (IFPRI).
[20] Nade Nuru, Ahmednasir Amin, Abdulaziz Husen, Ahmed Jibril Usmail. 2024. Overall performance assessment of selected small-scale irrigation schemes using internal and external performance indicators inWest Hararghe Zone, Eastern Ethiopia.
[21] National Bank of Ethiopia, (NBE). 2018. Annual Report of 2017/2018. National bank of Ethiopia.
[22] Negash Bedaso nd Bayan Ahmed 2024. Determination of Bed Width of Furrow Irrigation under Wheat at Tibla and Ketar-Genat Irrigation Scheme, Arsi Zone, Ethiopia. Middle East Journal of Applied Science & Technology Volume 7, Issue 4, Pages 36-49, October-December 2024.
[23] Negassa, A., Shiferaw, B., Koo, J., Sonder, K., Smale, Braun, H. J., Gbegbelegbe, S., Zhe Guo, D. H., Woo Payne, T., & Abeyo, B. 2013. The potential for wheat production in Africa: Analysis of biophysical suitability and economic profitability. International Maize Wheat Improvement Center (CIMMYT).
[24] Pereira, L. S., Cordery, I. and Iacovides, I., 2012. Improved indicators of water use performance and productivity for sustainable water conservation and saving. Agricultural water management, 108, pp. 39-51.
[25] Rose, W. R. and Grant, G. G., 2010. Critical issues pertaining to the planning and implementation of E-Government initiatives. Government Information Quarterly, 27(1), pp. 26-33.
[26] Sarkar, S. K., Bhattacharya, B. D., Bhattacharya, A., Chatterjee, M., Alam, A., Satpathy, K. K. and Jonathan, M. P., 2008. Occurrence, distribution and possible sources of organo-chlorine pesticide residues in tropical coastal environment of India: an overview. Environment international, 34(7), pp. 1062-1071.
[27] Sileshi Abebe and Kibebew Kibret. 2015. Status of salt affected soils, irrigation water quality and land suitability of Dubti/Tendaho Area, North Eastern Ethiopia (Doctoral dissertation, Haramaya University).
[28] Tadesse, W., Bishaw, Z. and Assefa, S., 2019. Wheat production and breeding in Sub-Saharan Africa: Challenges and opportunities in the face of climate change. International Journal of Climate Change Strategies and Management, 11(5), pp. 696-715.
[29] Taffesse AS, Dorosh P, Asrat S 2012. Crop production in Ethiopia: Regional patterns and trends. International Food Policy Research Institute (IFPRI).
[30] Topcu, S., 2011. Water for agriculture: a major and inefficient consumer. Turkey's Water Policy: National Frameworks and International Cooperation, pp. 93-115.
[31] Yemane, B., Medhanie, G. and Reddy, K. S., 2018. Survey of some common medicinal plants used in Eritrean folk medicine. American Journal of Ethnomedicine, 112, pp. 865-876.
[32] Zegeye, T., 2001. Adoption of improved bread wheat varieties and inorganic fertilizer by small-scale farmers in Yelmana Densa, and Farta districts of Northwestern Ethiopia. CIMMYT.
[33] Zhang, J. Liang, Z., Pan, Y., Shi, P. and Kang, S., 2000. Alternate furrow irrigation for maize production in an arid area. Agricultural water management, 45(3), pp. 267-274.
Cite This Article
  • APA Style

    Muleta, B., Bulti, A. (2026). Effect of Furrow Method and Irrigation Levels on Yield of Wheat and Water Productivity in Oda Bultum District Oromia, Ethiopia. Reports, 6(3), 46-56. https://doi.org/10.11648/j.reports.20260603.12

    Copy | Download

    ACS Style

    Muleta, B.; Bulti, A. Effect of Furrow Method and Irrigation Levels on Yield of Wheat and Water Productivity in Oda Bultum District Oromia, Ethiopia. Reports. 2026, 6(3), 46-56. doi: 10.11648/j.reports.20260603.12

    Copy | Download

    AMA Style

    Muleta B, Bulti A. Effect of Furrow Method and Irrigation Levels on Yield of Wheat and Water Productivity in Oda Bultum District Oromia, Ethiopia. Reports. 2026;6(3):46-56. doi: 10.11648/j.reports.20260603.12

    Copy | Download

  • @article{10.11648/j.reports.20260603.12,
      author = {Bayisa Muleta and Ayana Bulti},
      title = {Effect of Furrow Method and Irrigation Levels on Yield of Wheat and Water Productivity in Oda Bultum District Oromia, Ethiopia},
      journal = {Reports},
      volume = {6},
      number = {3},
      pages = {46-56},
      doi = {10.11648/j.reports.20260603.12},
      url = {https://doi.org/10.11648/j.reports.20260603.12},
      eprint = {https://article.sciencepublishinggroup.com/pdf/10.11648.j.reports.20260603.12},
      abstract = {Ethiopian government policies have promoted irrigation expansion particularly for cereal crops as a means to boost agricultural growth, reduce production risk, alleviate rural poverty, and improve food security. The experiment was conducted in Oda Bultum District for two consecutive years to evaluate and determine the optimal irrigation water level and application under furrow irrigation for wheat, and to identify the economic water use efficiency and net benefits of deficit irrigation. Two furrow-irrigation methods (conventional and alternate) and four irrigation levels (55%, 70%, 85%, and 100% of ETc) were used. The experiment followed a randomized complete block design (RCBD) with eight treatments replicated three times. Both physical and chemical soil samples were taken and analyzed. Except for plant height, most wheat agronomic parameters differed significantly between treatments (P < 0.05). The highest grain yield occurred with conventional furrow irrigation at 100% ETc. Although 100% ETc with the conventional method produced the maximum yield, it had lower water productivity and a lower marginal rate of return, and it did not promote irrigation water savings. Therefore, for a balance of yield and water savings, conventional furrow irrigation at 70% ETc is recommended; for drought-prone and water-scarce areas, alternate furrow irrigation at 100% ETc is recommended as an option for small-scale farmers.},
     year = {2026}
    }
    

    Copy | Download

  • TY  - JOUR
    T1  - Effect of Furrow Method and Irrigation Levels on Yield of Wheat and Water Productivity in Oda Bultum District Oromia, Ethiopia
    AU  - Bayisa Muleta
    AU  - Ayana Bulti
    Y1  - 2026/08/11
    PY  - 2026
    N1  - https://doi.org/10.11648/j.reports.20260603.12
    DO  - 10.11648/j.reports.20260603.12
    T2  - Reports
    JF  - Reports
    JO  - Reports
    SP  - 46
    EP  - 56
    PB  - Science Publishing Group
    SN  - 2994-7146
    UR  - https://doi.org/10.11648/j.reports.20260603.12
    AB  - Ethiopian government policies have promoted irrigation expansion particularly for cereal crops as a means to boost agricultural growth, reduce production risk, alleviate rural poverty, and improve food security. The experiment was conducted in Oda Bultum District for two consecutive years to evaluate and determine the optimal irrigation water level and application under furrow irrigation for wheat, and to identify the economic water use efficiency and net benefits of deficit irrigation. Two furrow-irrigation methods (conventional and alternate) and four irrigation levels (55%, 70%, 85%, and 100% of ETc) were used. The experiment followed a randomized complete block design (RCBD) with eight treatments replicated three times. Both physical and chemical soil samples were taken and analyzed. Except for plant height, most wheat agronomic parameters differed significantly between treatments (P < 0.05). The highest grain yield occurred with conventional furrow irrigation at 100% ETc. Although 100% ETc with the conventional method produced the maximum yield, it had lower water productivity and a lower marginal rate of return, and it did not promote irrigation water savings. Therefore, for a balance of yield and water savings, conventional furrow irrigation at 70% ETc is recommended; for drought-prone and water-scarce areas, alternate furrow irrigation at 100% ETc is recommended as an option for small-scale farmers.
    VL  - 6
    IS  - 3
    ER  - 

    Copy | Download

Author Information