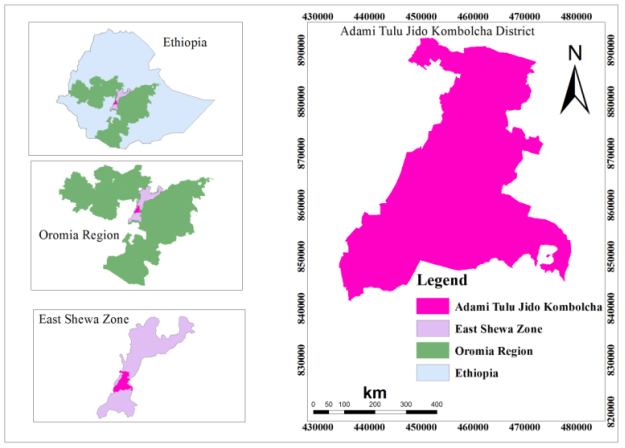
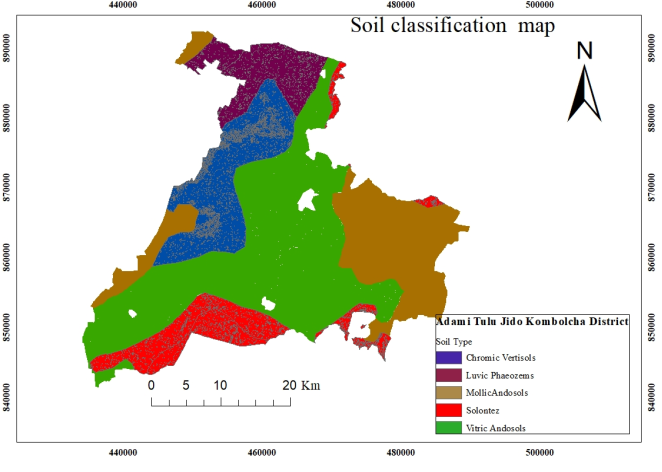
A study was undertaken in Adami Tulu Jido Kombolcha District of Oromia region, Ethiopia, to investigate the site, morphological and physico-chemical characteristics, classification and mapping of soils. Fourteen soil pedons at representative sites were described and 66 disturbed and undisturbed soil samples from identified horizons were taken for laboratory analysis. The data obtained showed that the soils varied from moderate to very deep, well drained, the surface soil color at (dry) varied from light gray (10YR 7/2) to very dark brown (7.5YR 2.5/2); at moist varied from brown (10YR4/3) to black (10YR2/1), while the subsurface color varied from white (10YR 8/1) to black (7.5YR 3/1,) at dry conditions and at moist condition the color varied from light gray (7.5YR 7/2) to black (7.5YR 2.5/1), the structure in the surface layers of the pedons 1, 2, 3, 6, 14 had weak fine granular and gradually in subsurface changed to Moderate fine sub angular blocky in the same pedons; Strong fine granular at surface changed to strong fine sub angular blocky in pedon 4; Strong fine angular blocky in pedon 5 and moderate medium granular in pedon 7 and 8 at surface and subsurface without gradual change. The values of the determined soil physical characteristics revealed that sand, silt, clay, bulk density and total porosity ranged from 34 to 81.78%, 9.22 to 48%, 5 to 28%, 0.95 to 1.31 g cm-3, 50.56 to 64.15% respectively. Moreover, the soils were neutral (pH 6.7 to 7.3) to strongly alkaline (pH >8.0), salt free (< 1dsm-1) except pedon 9 and 10 near to lake Abjeta. Soil organic matter content ranged from very low to moderate in and total N ranged very low to moderate, available phosphorus ranged from very low to low respectively. Soil exchangeable Ca2+ ranged from moderate to high (5.13 to 21.8 cmol(+) kg-1), high to very high in exchangeable K (0.65 to 3.46 cmol(+) kg-1), moderate to high in Mg (1.28 to 6.7 cmol(+) kg-1), low to very high in exchangeable Na (0.13 to 10.1 cmol(+) kg-1) and, moderate to high CEC (13.13 to 38.88% cmol(+) kg-1) and moderate to very high PBS (50.92 to 97.69%), respectively. Soil of the district was classified as chromic vertisols, Luvic phaeozems, vitric andosols, Solonetz and mollic andosols.
| Published in | Science Development (Volume 6, Issue 3) |
| DOI | 10.11648/j.scidev.20250603.17 |
| Page(s) | 97-113 |
| Creative Commons |
This is an Open Access article, distributed under the terms of the Creative Commons Attribution 4.0 International License (http://creativecommons.org/licenses/by/4.0/), which permits unrestricted use, distribution and reproduction in any medium or format, provided the original work is properly cited. |
| Copyright |
Copyright © The Author(s), 2025. Published by Science Publishing Group |
Soil Characteristics, Soil Classification, Soil Mapping
Depth (cm) | Horizon bound. | Color | Structure | Consistence | |||||||
|---|---|---|---|---|---|---|---|---|---|---|---|
D. | T. | dry | moist | Grad | Size | Shape | dry | wet | |||
Stick | Plastic | ||||||||||
Pedon 1 | |||||||||||
Ap | 0-17 | D | S | 10YR7/2 | 10YR2/1 | WE | FI | GR | SO | SST | SPL |
A | 17-40 | D | S | 7.5YR7/3 | 7.5YR3/1 | MO | FI | SB | SHA | SST | SPL |
A1 | 40-73 | D | S | 7.5YR7/1 | 10YR4/1 | MO | FI | AB | SHA | NST | NPL |
Bw1 | 73-120 | G | S | 7.5YR6/2 | 7.5YR2.5/1 | MO | FI | GR | SHA | NST | NPL |
Bw2 | 120+ | 7.5YR7/2 | 10YR5/3 | MO | FI | GR | LO | NST | NPL | ||
Pedon 2 | |||||||||||
Ap | 0-23 | D | S | 10YR5/3 | 10YR2/1 | WE | FI | GR | SO | ST | PL |
A | 23-54 | G | S | 10YR4/2 | 10YR2/2 | MO | FI | SB | SHA | SST | SP |
A1 | 54-107 | C | S | 10YR6/2 | 10YR4/2 | WE | FI | GR | LO | NST | NPL |
Bw1 | 107-150 | C | S | 10YR7/2 | 10YR4/3 | ST | FI | SB | HA | NST | NPL |
Bw2 | 150+ | 10YR8/1 | 10YR6/3 | ST | FI | AB | VHA | NST | NST | ||
Pedon 3 | |||||||||||
Ap | 0-18 | D | S | 7.5YR4/3 | 10YR2/1 | WE | FI | GR | SO | SST | SPL |
A | 18-40 | G | S | 7.5YR4/1 | 10YR2/1 | MO | FI | SB | SO | SST | SPL |
A1 | 40-72 | G | S | 5YR6/2 | 10YR3/2 | MO | VFI | SB | SHA | SST | SPL |
Bw1 | 72-118 | C | S | 10YR8/1 | 10YR6/3 | ST | FI | SB | VHA | NST | NPL |
Bw2 | 118+ | Glay7/1 | 10YR6/2 | WE | VFI | SB | LO | NST | NPL | ||
Pedon 4 | |||||||||||
Ap | 0-25 | D | S | 5YR3/1 | 10YR2/1 | ST | FI | GR | HA | ST | PL |
A | 25-60 | D | S | 7.5YR3/1 | 7.5YR2.5/1 | ST | FI | SB | HA | ST | PL |
A1 | 60-90 | C | S | 7.5YR3/2 | 7.5YR2.5/2 | MO | FI | SB | HA | ST | PL |
A2 | 90-115 | C | S | 7.5YR6/3 | 2.5YR4/4 | ST | FI | SB | SHA | SST | SPL |
Bw1 | 115-160 | C | S | 7.5YR7/6 | 10YR4/4 | MO | FI | AB | SHA | SST | SPL |
Bw2 | 160+ | 7.5YR6/4 | 10YR3/6 | MO | FI | AB | SHA | SST | SPL | ||
Pedon 5 | |||||||||||
Ap | 0-40 | D | S | 7.5YR2.5/2 | 10YR4/3 | ST | FI | AB | HA | ST | PL |
A | 40-75 | D | S | 7.5YR4/2 | 10YR3/1 | ST | FI | AB | HA | ST | PL |
A1 | 75-120 | D | S | 10YR5/1 | 10YR3/1 | MO | FI | SB | HA | ST | PL |
Bw1 | 120-170 | G | S | 7.5YR4/2 | 7.5YR2.5/2 | MO | FI | SB | SHA | SST | SPL |
Bw2 | 170+ | 10YR6/1 | 7.5YR4/1 | MO | FI | AB | SHA | SST | SPL | ||
Pedon 6 | |||||||||||
Ap | 0-20 | C | S | 10YR5/2 | 7.5YR2.5/2 | WE | FI | GR | SHA | SST | SPL |
A | 20-90 | G | S | 10YR7/3 | 2.5YR5/4 | MO | FI | SB | SHA | SST | SPL |
A1 | 90+ | Gley 1 8/10y | 7.5YR7/2 | WE | FI | GR | SO | NST | NPL | ||
Pedon 7 | |||||||||||
Ap | 0-35 | C | S | 10YR5/4 | 10YR3/3 | MO | ME | GR | SHA | SST | SPL |
A | 35-75 | C | S | 10YR5/3 | 7.5YR3/1 | MO | ME | GR | SHA | SST | SPL |
Bw1 | 75-110 | G | S | 10YR7/2 | 7.5YR3/3 | ST | ME | AB | HA | SST | SPL |
Bw2 | 110+ | 10YR6/3 | 7.5YR3/1 | ST | ME | SB | HA | SST | SPL | ||
Pedon 8 | |||||||||||
A | 0-60 | D | S | 7.5YR5/1 | 10YR2/1 | MO | ME | GR | SHA | SST | SPL |
A1 | 60-100 | D | S | 7.5YR5/3 | 10YR3/1 | MO | ME | GR | SHA | SST | SPL |
B | 100-150 | D | S | 7.5YR7/1 | 7.5YR3/2 | MS | ME | AB | HA | SST | SPL |
B1 | 150-180+ | 7.5YR7/3 | 7.5YR4/4 | ST | ME | SB | HA | SST | SPL | ||
Pedon 9 | |||||||||||
Ap | 0-10 | C | S | 2.5YR6/2 | 7.5YR3/1 | MO | FI | AB | LO | NST | NPL |
A | 10-20 | C | S | 2.5Y7/3 | 7.5YR4/2 | MO | FI | P | SHA | NST | NPL |
A1 | 20-35 | C | S | 2.5Y6/1 | 7.5YR3/2 | ST | FI | P | SHA | NST | NPL |
A2 | 35-50 | G | S | 2.5Y5/3 | 7.5YR4/1 | ST | ME | P | SHA | NST | NPL |
A3 | 50-80 | D | S | 2.5Y6/2 | 7.5YR6/1 | ST | ME | P | SHA | NST | NPL |
Bw1 | 80-105 | D | S | 2.5Y6/3 | 10YR6/3 | ST | ME | AB | HA | NST | NPL |
Bw2 | 105-130 | D | S | 2.5Y5/3 | 10YR7/4 | ST | ME | AB | HA | NST | NPL |
Bt1 | 130+ | 2.5Y5/3 | 10YR/6/3 | ST | FI | AB | HA | NST | NPL | ||
Pedon 10 | |||||||||||
Ap | 0-15 | C | S | 2.5Y6/2 | 5YR3/1 | WE | VFI | AB | LO | NST | NPL |
A | 15-37 | G | S | 2.5Y7/2 | 7.5YR5/3 | WE | VFI | P | LO | NST | NPL |
A1 | 37-104 | C | S | 10YR6/2 | 7.5YR7/2 | WE | FI | P | SHA | NST | NPL |
A2 | 104-164 | C | S | GLEY 2. 7/10 | GLEY15/N | WE | VFI | P | SO | NST | NPL |
Bw1 | 164+ | 2.5Y7/2 | 10YR6/1 | WE | ME | GR | SHA | NST | NPL | ||
Pedon 11 | |||||||||||
Ap | 0-25 | C | S | 10YR5/3 | 10YR3/1 | MO | ME | GR | SHA | SST | SPL |
A | 25-60 | G | S | 7.5YR4/2 | 10YR2/2 | MO | FI | GR | SHA | SST | SPL |
A1 | 60-110 | G | S | 5YR4/4 | 7.5YR2.5/2 | MO | FI | SB | HA | SST | SPL |
Bw1 | 110+ | 5YR4/4 | 5YR2.5/2 | MO | FI | SB | HA | SST | SPL | ||
Pedon 12 | |||||||||||
AP | 0-25 | D | S | 10YR5/3 | 10YR2/2 | MO | FI | AB | SO | SST | SPL |
A | 5-44 | D | S | 10YR5/3 | 10YR2/1 | MO | FI | ABGR | SO | SST | SPL |
A1 | 44-55 | D | S | 10YR5/2 | 10YR2.5/2 | MO | FI | GR | SO | SST | SPL |
A2 | 55-68 | D | S | 10YR5/2 | 10YR3/2 | WE | FI | GR | SO | SST | SPL |
Bw1 | 68+ | 10YR5/1 | 10YR3/3 | WE | FI | SO | SST | SST | |||
Pedon 13 | |||||||||||
Ap | 0-18 | C | S | 10YR4/3 | 10YR3/3 | MO | FI | AB | SHA | SST | SPL |
A | 18-40 | G | S | 10YR6/3 | 10YR3/3 | MO | VFI | AB | SHA | SST | SPL |
A1 | 40-60 | G | S | 10YR5/3 | 10YR2/2 | WE | VFI | AB | SO | SST | SPL |
Bw1 | 60+ | 10YR5/3 | 10YR2/2 | WE | FI | AB | SO | SST | SPL | ||
Pedon 14 | |||||||||||
Ap | 0-15 | D | S | 10YR5/3 | 7.5YR2.5/2 | WE | FI | GR | SHA | ST | PL |
A | 15-50 | D | S | 10YR5/3 | 7.5YR2.5/2 | MO | FI | SB | SHA | ST | PL |
Bw1 | 50-100 | 10YR5/3 | 10YR2/1 | WE | FI | SB | SHA | ST | PL | ||
Horizon | Depth (cm) | Ρb (g/cm3) | TP (%) | Particle size (%) | |||
|---|---|---|---|---|---|---|---|
Sand | Silt | Clay | Textural classes | ||||
Pedon 1 | |||||||
Ap | 0-17 | 1.05 | 60.38 | 68 | 20 | 12 | Sandy loam |
A | 17-40 | 1.07 | 59.62 | 36 | 46 | 18 | Loam |
A1 | 40-73 | 1.08 | 59.24 | 67 | 22 | 11 | Sandy loam |
Bw1 | 73-120 | 1.1 | 58.49 | 69 | 18 | 13 | Sandy loam |
Bw2 | 120+ | 1.11 | 58.11 | 55 | 28 | 17 | Sandy loam |
Pedon 2 | |||||||
Ap | 0-23 | 1.04 | 60.76 | 73 | 20 | 7 | Sandy loam |
A | 23-54 | 1.05 | 60.38 | 69 | 24 | 7 | Sandy Loam |
A1 | 54-107 | 1.06 | 60 | 53 | 36 | 11 | Sandy loam |
Bw1 | 107-150 | 1.09 | 58.87 | 51 | 32 | 17 | Sandy loam |
Bw2 | 150+ | 1.1 | 58.49 | 51 | 32 | 17 | Sandy loam |
Pedon 3 | |||||||
Ap | 0-18 | 0.98 | 63.01 | 59 | 32 | 9 | Sandy loam |
A | 18-40 | 1.01 | 61.89 | 67 | 22 | 11 | Sandy Loam |
A1 | 40-72 | 1.04 | 60.76 | 69 | 18 | 13 | Sandy loam |
Bw1 | 72-118 | 1.11 | 58.11 | 59 | 26 | 15 | Sandy loam |
Bw2 | 118+ | 1.18 | 55.47 | 55 | 28 | 17 | Sandy loam |
Pedon 4 | |||||||
Ap | 0-25 | 1.18 | 55.47 | 44 | 30 | 26 | Clay loam |
A | 25-60 | 1.26 | 52.45 | 42 | 30 | 28 | Clay loam |
A1 | 60-90 | 1.22 | 53.96 | 44 | 29 | 27 | Clay loam |
A2 | 90-115 | 1.15 | 56.60 | 56 | 28 | 16 | Sandy loam |
Bw1 | 115-160 | 1.04 | 60.76 | 54 | 30 | 16 | Sandy loam |
Bw2 | 160+ | 1.1 | 58.49 | 68 | 26 | 6 | Sandy loam |
Pedon 5 | |||||||
Ap | 0-40 | 1.05 | 60.38 | 56 | 30 | 14 | Sandy loam |
A | 40-75 | 1.07 | 59.62 | 34 | 48 | 18 | Loam |
A1 | 75-120 | 1.102 | 58.42 | 36 | 46 | 18 | Loam |
Bw1 | 120170 | 1.103 | 58.38 | 54 | 27 | 19 | Sandy Loam |
Bw2 | 170+ | 1.106 | 58.26 | 56 | 24.5 | 19.5 | Sandy loam |
Pedon 6 | |||||||
Ap | 0-20 | 1.01 | 61.89 | 64 | 30 | 6 | Sandy loam |
A | 20-90 | 1.02 | 61.51 | 68 | 24 | 8 | Sandy loam |
A1 | 90+ | 1.11 | 58.11 | 69 | 23 | 8 | Sandy loam |
Pedon 7 | |||||||
Ap | 0-35 | 1.01 | 61.89 | 54 | 34 | 12 | Sandy loam |
A | 35-75 | 1.04 | 60.76 | 48 | 44 | 8 | loam |
Bw1 | 75-110 | 1.08 | 59.25 | 56 | 32 | 12 | Sandy loam |
Bw2 | 110+ | 1.12 | 57.74 | 69 | 23 | 8 | Sandy loam |
Pedon 8 | |||||||
Ap | 0-60 | 0.95 | 64.15 | 42 | 30 | 28 | Clay loam |
A | 60-100 | 0.98 | 63.02 | 44 | 28 | 24 | clay loam |
B1 | 100-150 | 1.125 | 57.55 | 58 | 30 | 12 | Sandy loam |
B2 | 150-180 | 1.135 | 57.17 | 42 | 32 | 26 | Clay loam |
Pedon 9 | |||||||
Ap | 0-10 | 1.03 | 61.13 | 44 | 28 | 24 | Sandy Clay Loam |
A | 10-20 | 1.06 | 60.00 | 45.5 | 30 | 24.5 | Sandy clay loam |
A1 | 20-35 | 1.10 | 58.49 | 42 | 32 | 26 | Sandy clay loam |
A2 | 35-50 | 0.96 | 63.77 | 41.5 | 32 | 26.5 | Sandy clay loam |
A3 | 50-80 | 0.98 | 63.02 | 69 | 23 | 8 | Sandy loam |
Bw1 | 80-105 | 1.02 | 61.51 | 58 | 32 | 10 | Sandy loam |
Bw2 | 105-130 | 1.01 | 61.89 | 54 | 32 | 14 | Sandy loam |
Bt1 | 130+ | 1.05 | 60.38 | 59 | 29 | 12 | Sandy loam |
Pedon 10 | |||||||
Ap | 0-15 | 1.07 | 59.62 | 70 | 18 | 12 | Sandy clay loam |
A | 15-37 | 1.10 | 58.49 | 63.78 | 27.22 | 9 | Sandy clay loam |
A1 | 37-104 | 1.12 | 57.74 | 66 | 24 | 10 | Sandy clay loam |
A2 | 104-164 | 0.98 | 63.02 | 63 | 27 | 10 | Sandy loam |
Bw1 | 164+ | 0.98 | 63.02 | 57 | 30 | 13 | Sandy loam |
Pedon 11 | |||||||
Ap | 0-25 | 1.15 | 56.60 | 58 | 36 | 6 | Sandy loam |
A | 25-60 | 1.18 | 55.47 | 56 | 28 | 16 | Sandy loam |
A1 | 60-110 | 1.203 | 54.60 | 69 | 23 | 8 | Sandy loam |
Bw1 | 110+ | 1.31 | 50.56 | 68 | 24 | 6 | Sandy loam |
Pedon 12 | |||||||
AP | 0-25 | 1.02 | 61.51 | 65.78 | 29.22 | 5 | Sandy loam |
A | 25-44 | 1.15 | 56.60 | 63.78 | 29.22 | 7 | Sandy loam |
A1 | 44-55 | 1.21 | 54.34 | 61.78 | 29.22 | 9 | Sandy loam |
A2 | 55-68 | 1.24 | 53.21 | 69.78 | 21.22 | 9.5 | Sandy loam |
Bw1 | 68+ | 1.27 | 52.1 | 65.78 | 25.22 | 11 | Sandy loam |
Pedon 13 | |||||||
Ap | 0-18 | 1.03 | 61.13 | 65.78 | 29.22 | 5 | Sandy loam |
A | 18-40 | 1.08 | 59.25 | 47.78 | 45.22 | 7 | Loam |
A1 | 40-60 | 1.20 | 54.72 | 81.78 | 9.22 | 9 | Sandy loam |
Bw1 | 60+ | 1.23 | 53.6 | 53.78 | 35.22 | 11 | Sandy loam |
Pedon 14 | |||||||
Ap | 0-25 | 1.03 | 61.13 | 49.78 | 45.22 | 5 | Loam |
A | 25-50 | 1.2 | 54.72 | 48.78 | 45.22 | 6 | Loam |
Bw1 | 50-100+ | 1.28 | 51.7 | 47.78 | 45.22 | 7 | Loam |
Horizon | depth (cm) | pH (H2O) | EC (ds/m) | TN (%) | OC (%) | Av.P (mgkg-1) | Ca | Mg | Na | k | CEC | PBS% | ESP% |
|---|---|---|---|---|---|---|---|---|---|---|---|---|---|
cmol(+) kg-1 | |||||||||||||
Pedon 1 | |||||||||||||
Ap | 0-17 | 6.92 | 0.16 | 0.13 | 2.3 | 8.25 | 14.2 | 2.84 | 0.47 | 2.63 | 23.13 | 87.07 | 2.33 |
A | 17-40 | 6.95 | 0.164 | 0.11 | 2.02 | 8.33 | 15.2 | 2.81 | 0.62 | 1.81 | 23.42 | 87.28 | 3.03 |
A1 | 40-73 | 7.35 | 0.17 | 0.08 | 1.03 | 6.46 | 9.64 | 1.67 | 0.63 | 1.54 | 17.55 | 76.81 | 4.67 |
Bw1 | 73-120 | 7.55 | 0.254 | 0.03 | 0.12 | 5.32 | 7.88 | 1.58 | 0.55 | 1.13 | 15.43 | 72.20 | 4.94 |
Bw2 | 120+ | 7.64 | 0.23 | 0.022 | 0.04 | 4.82 | 7.13 | 1.45 | 0.72 | 1.04 | 13.38 | 77.28 | 6.96 |
Pedon 2 | |||||||||||||
Ap | 0-23 | 7.45 | 0.152 | 0.143 | 1.65 | 9.5 | 12.3 | 2.79 | 0.54 | 1.84 | 19.14 | 91.27 | 3.09 |
A | 23-54 | 7.65 | 0.211 | 0.12 | 1.31 | 8.95 | 13.6 | 2.18 | 0.61 | 1.80 | 21.45 | 84.8 | 3.35 |
A1 | 54-107 | 7.68 | 0.281 | 0.031 | 0.12 | 8.12 | 12.5 | 2.21 | 0.252 | 1.12 | 17.73 | 90.71 | 1.57 |
Bw1 | 107-150 | 7.84 | 0.29 | 0.024 | 0.09 | 6.5 | 9.41 | 1.74 | 0.281 | 1.05 | 14.83 | 84.16 | 2.25 |
Bw2 | 150+ | 7.84 | 0.293 | 0.032 | 0. 04 | 4.5 | 7.12 | 1.71 | 0.32 | 2.13 | 13.84 | 81.50 | 2.84 |
Pedon 3 | |||||||||||||
Ap | 0-18 | 7.09 | 0.118 | 0.145 | 1.64 | 7.25 | 14.84 | 1.56 | 0.87 | 2.19 | 19.92 | 97.69 | 4.6 |
A | 18-40 | 7.55 | 0.143 | 0.134 | 1.22 | 5.33 | 12.3 | 1.4 | 0.93 | 1.83 | 17.34 | 94.93 | 5.65 |
A1 | 40-72 | 7.64 | 0.174 | 0.084 | 1.13 | 4.46 | 12.7 | 1.28 | 0.35 | 1.93 | 17.44 | 93.23 | 2.15 |
Bw1 | 72-118 | 7.71 | 0.177 | 0.063 | 0.12 | 1.32 | 9.48 | 1.94 | 0.3 | 1.42 | 18.13 | 77.05 | 8.1 |
Bw2 | 118+ | 7.76 | 0.189 | 0.081 | 0.08 | 1.82 | 6.45 | 2.35 | 0.34 | 1.7 | 13.13 | 82.56 | 3.13 |
Pedon 4 | |||||||||||||
Ap | 0-25 | 6.8 | 0.116 | 0.141 | 2.62 | 8.83 | 21.8 | 4.3 | 0.68 | 2.34 | 32.78 | 88.83 | 2.34 |
A | 25-60 | 7.65 | 0.144 | 0.133 | 2.59 | 8.16 | 21.1 | 6.34 | 0.69 | 1.78 | 32.68 | 91.52 | 2.31 |
A1 | 60-90 | 7.63 | 0.170 | 0.072 | 1.38 | 7.34 | 19.8 | 6.7 | 0.69 | 2.21 | 31.56 | 93.16 | 2.35 |
A2 | 90-115 | 7.52 | 0.187 | 0.061 | 1.33 | 5.13 | 19.2 | 6.5 | 1.31 | 2.14 | 31.13 | 93.64 | 4.49 |
Bw1 | 115-160 | 7.24 | 0.188 | 0.060 | 1.22 | 3.14 | 17.3 | 5.7 | 1.46 | 2.22 | 29.77 | 89.62 | 5.47 |
Bw2 | 160+ | 7.74 | 0.23 | 0.054 | 1.2 | 3.13 | 14.3 | 5.7 | 1.52 | 2.5 | 27.73 | 86.62 | 6.33 |
Pedon 5 | |||||||||||||
AP | 0-40 | 7.95 | 0.151 | 0.158 | 2.03 | 8.53 | 20.8 | 3.57 | 0.64 | 2.54 | 31.55 | 87.32 | 2.32 |
A | 40-75 | 8.55 | 0.157 | 0.142 | 2.21 | 7.24 | 19.3 | 4.12 | 0.567 | 2.64 | 31.05 | 85.75 | 2.13 |
A1 | 75-120 | 8.65 | 0.17 | 0.085 | 0.07 | 4.52 | 15.3 | 4.82 | 0.621 | 3.01 | 26.21 | 90.62 | 2.61 |
Bw1 | 120-170 | 7.81 | 0.274 | 0.072 | 0.14 | 4.32 | 13.2 | 5.72 | 0.68 | 3.18 | 25.02 | 91.05 | 2.98 |
Bw2 | 170 | 8.04 | 0.268 | 0.045 | 0.11 | 2.36 | 10.2 | 5.75 | 0.78 | 3.21 | 23.73 | 84.03 | 3.91 |
Pedon 6 | |||||||||||||
AP | 0-20 | 7.45 | 0.22 | 0.137 | 2.81 | 9.25 | 17.2 | 4.5 | 1.12 | 1.81 | 27.52 | 89.5 | 4.55 |
A | 20-90 | 7.85 | 0.251 | 0.084 | 1.34 | 6.66 | 14.1 | 4.32 | 1.31 | 1.78 | 24.84 | 86.6 | 6.09 |
A1 | 90+ | 7.87 | 0.273 | 0.062 | 1.31 | 6.32 | 12.44 | 3.34 | 1.35 | 1.64 | 19.73 | 95.13 | 7.19 |
Pedon 7 | |||||||||||||
Ap | 0-35 | 7.19 | 0.12 | 0.18 | 2.05 | 8.72 | 14.78 | 4.82 | 0.13 | 2.03 | 23.56 | 92.36 | 0.6 |
A | 35-75 | 8.1 | 0.16 | 0.23 | 1.84 | 8.62 | 14.5 | 4.8 | 0.56 | 2.98 | 24.59 | 92.88 | 2.45 |
Bw1 | 75-110 | 8.14 | 0.19 | 0.11 | 0.63 | 6.46 | 12.54 | 3.7 | 0.84 | 1.15 | 19.48 | 93.58 | 4.61 |
Bw2 | 110+ | 8.22 | 0.21 | 0.06 | 0.42 | 4.41 | 8.23 | 4.12 | 1.16 | 2.17 | 17.21 | 91.12 | 7.4 |
Pedon 8 | |||||||||||||
A | 0-60 | 6.72 | 0.31 | 0.24 | 2.85 | 7.95 | 19.78 | 3.82 | 0.18 | 1.11 | 27.36 | 90.97 | 0.72 |
A1 | 60-100 | 7.65 | 0.39 | 0.21 | 1.94 | 8.12 | 19.23 | 3.91 | 0.66 | 1.08 | 28.57 | 87.08 | 2.65 |
B1 | 100-150 | 7.74 | 0.45 | 0.11 | 0.75 | 8.46 | 14.13 | 2.21 | 0.64 | 1.02 | 19.47 | 92.45 | 3.55 |
B2 | 150-180 | 7.82 | 0.63 | 0.06 | 0.04 | 5.31 | 9.45 | 2.51 | 1.26 | 0.65 | 14.84 | 93.46 | 9.08 |
Pedon 9 | |||||||||||||
Ap | 0-10 | 10 | 3.55 | 0.08 | 1.2 | 6.02 | 8.51 | 2.5 | 10.1 | 2.2 | 39.88 | 60.96 | 43.33 |
A | 10-20 | 10 | 4.01 | 0.11 | 0.85 | 5.84 | 8.01 | 3.4 | 9.92 | 2.12 | 38.82 | 60.41 | 42.3 |
A1 | 20-35 | 10.01 | 4.12 | 0.03 | 0.32 | 3.14 | 7.14 | 3.4 | 9.87 | 2.41 | 37.58 | 59.1 | 43.25 |
A2 | 35-50 | 10.1 | 4.14 | 0.02 | 0.12 | 4.34 | 7.12 | 3.12 | 8.85 | 2.44 | 36.85 | 58.43 | 41.11 |
A3 | 50-80 | 10.41 | 5.05 | 0.1 | 0.06 | 2.12 | 6.5 | 3.3 | 8.62 | 1.24 | 33.25 | 59.13 | 43.85 |
Bw1 | 80-105 | 10.63 | 5.03 | 0.02 | 0.042 | 2.32 | 6.55 | 3.2 | 7.94 | 1.54 | 31.95 | 60.2 | 41.3 |
Bw2 | 105-130 | 10.69 | 5.01 | 0.03 | 0.04 | 1.33 | 5.45 | 2.2 | 7.12 | 1.38 | 27.25 | 59.27 | 44.08 |
Bt1 | 130+ | 10.91 | 5.26 | 0.01 | 0.022 | 2.12 | 5.13 | 2.1 | 6.86 | 1.46 | 27.32 | 56.92 | 44.12 |
Pedon 10 | |||||||||||||
Ap | 0-15 | 10.2 | 1.21 | 0.11 | 1.28 | 9.27 | 7.42 | 1.85 | 9.5 | 2.17 | 38.28 | 54.70 | 45.37 |
A | 15-37 | 10.12 | 1.12 | 0.11 | 1.01 | 8.4 | 7.33 | 1.75 | 9.3 | 2.14 | 38.11 | 53.84 | 45.32 |
A1 | 37-104 | 10.38 | 1.2 | 0.04 | 0.23 | 5.7 | 6.81 | 1.55 | 8.7 | 2.13 | 37.53 | 51.13 | 45.34 |
A2 | 104-164 | 10.41 | 2.21 | 0.023 | 0.055 | 6.3 | 6.74 | 1.5 | 8.12 | 2.11 | 35.53 | 51.98 | 43.96 |
Bw1 | 164+ | 10.65 | 2.24 | 0.02 | 0.05 | 3.28 | 6.65 | 1.43 | 7.68 | 2.15 | 35.17 | 50.92 | 42.88 |
Pedon 11 | |||||||||||||
Ap | 0-25 | 8.89 | 0.26 | 0.23 | 1.94 | 7.25 | 18.78 | 3.83 | 0.36 | 1.92 | 25.83 | 96.36 | 1.45 |
A | 25-60 | 8.55 | 0.06 | 0.11 | 0.8 | 7.04 | 16.85 | 3.8 | 0.64 | 2.93 | 25.23 | 96.00 | 2.64 |
A1 | 60-110 | 7.74 | 0.1 | 0.04 | 0.65 | 6.74 | 16.65 | 2.62 | 0.59 | 3.06 | 26.54 | 86.36 | 2.57 |
Bw1 | 110+ | 7.64 | 0.11 | 0.02 | 0.23 | 6.54 | 13.74 | 2.82 | 0.55 | 3.12 | 22.12 | 91.45 | 2.72 |
Pedon 12 | |||||||||||||
Ap | 0-25 | 7.8 | 0.12 | 0.145 | 2.72 | 4.72 | 12.54 | 2.35 | 0.261 | 3.46 | 22.46 | 82.86 | 1.4 |
A | 25-44 | 7.65 | 0.14 | 0.133 | 2.09 | 3.75 | 12.11 | 2.35 | 0.500 | 3.35 | 22.23 | 82.38 | 2.73 |
A1 | 44-55 | 7.63 | 0.15 | 0.072 | 1.28 | 3.24 | 10.13 | 1.58 | 0.935 | 1.34 | 20.45 | 69.1 | 6.685 |
A2 | 55-68 | 7.42 | 0.17 | 0.061 | 0.52 | 3.21 | 8.84 | 1.57 | 0.826 | 1.13 | 19.97 | 61.84 | 6.68 |
Bw1 | 68-90+ | 7.74 | 0.18 | 0.060 | 0.4 | 2.26 | 7.88 | 1.57 | 0.674 | 0.95 | 18.26 | 60.7 | 6.1 |
Pedon 13 | |||||||||||||
AP | 0-18 | 7.59 | 0.11 | 0.125 | 2.41 | 3.42 | 12.15 | 1.57 | 0.304 | 3.36 | 21.23 | 81.9 | 1.75 |
A | 18-40 | 7.56 | 0.15 | 0.092 | 2.16 | 3.14 | 11.76 | 1.57 | 0.370 | 3.23 | 21.15 | 80.01 | 2.18 |
A1 | 40-60 | 7.55 | 0.17 | 0.081 | 1.64 | 1.54 | 10.44 | 2.35 | 0.391 | 2.41 | 20.01 | 77.95 | 2.5 |
Bw1 | 60+ | 7.50 | 0.24 | 0.072 | 1.52 | 2.94 | 9.41 | 2.35 | 0.761 | 2.24 | 19.75 | 74.74 | 5.15 |
Pedon 14 | |||||||||||||
Ap | 0-15 | 7.59 | 0.14 | 0.123 | 2.23 | 3.21 | 11.85 | 1.58 | 0.326 | 2.71 | 19.18 | 85.85 | 1.98 |
A | 15-50 | 7.29 | 0.066 | 0.092 | 2.81 | 3.05 | 9.22 | 2.74 | 0.346 | 2.59 | 19.1 | 78.0 | 2.32 |
Bw1 | 50-100+ | 7.48 | 0.17 | 0.072 | 2.1 | 2.42 | 9.02 | 3.53 | 1.39 | 1.16 | 17.89 | 84.40 | 9.2 |
| [1] | Abdenna Deressa, Bikila Bote and Hirpha Legesse. 2013. Evaluation of soil cations in agricultural soils of east WollegaZone in Southwestern Ethiopia. Science, Technology and Arts Resarch Journal, 2(1): 10-17. |
| [2] | Alem Hagos Hailu. 2014. Characterization and Classification of Soils and Land Suitability Evaluation of Kabe Subwatershed in South Wollo Zone, Northeastern Ethiopia. An MSc Thesis submitted to the school of graduate studies of Haramaya University. Haramaya, Ethiopia. 35 p. |
| [3] | Alemayehu Seyoum, Dorosh, P. and Sinafikeh Asrat. 2011. Crop production in Ethiopia: Regional patterns and trends. Development strategy and governance division, International Food Policy Research Institute, Ethiopia strategy support program II, working paper 0016. Ethiopia. |
| [4] | Ashenafi Ali, Abayneh Esayas and Sheleme Beyene. 2010. Characterizing soils of DelboWegen watershed, Wolaita Zone, southern Ethiopia, for planning appropriate land management. Journal of Soil Science and Environment Management, 1(8): 184-189. |
| [5] | Badege Bishaw. 2009. Deforestation and land degradation in the Ethiopian highlands: A strategy for physical recovery. Ethiopian e-journal for research and innovation foresight, 1(1): 5-8. |
| [6] | Bationo, A., Hartemink, A., Lungu, O., Naimi, M., Okoth, P., Smaling, E. and Thiombiano, L. 2006. African Soils: Their productivity and profitability of fertilizer use. Background paper prepared for the African fertilizer summit, Abuja, Nigeria. |
| [7] | EEPCo (Ethiopia Electric Power Corporation), 2013. Environmental and Social Impact Assessment of Geothermal Sector Development Project For Aluto Geothermal Site Development. |
| [8] | Esu, I. E (2005). Soil characterization and mapping for food security. A Keynote Address at the 29th annual conf. of SSSN held at University of Nigeria, Abeokuta, from 6th to 10th Dec. 2004. |
| [9] | Eswaran, H. (1977). Soil Analysis for Soil Surveys. In: Soil Resource Inventories. A proceeding of workshop held at Cornell University, Ithaca, USA, pp 315-324. |
| [10] | FAO (2006). Guidelines for Soil Description. Fourth Edition. 109 pp Fetter, C. W (1998). AppliedHydrogeology, Macmillan publishing co. New York. |
| [11] | IFPRI (International Food Policy Research Institute). 2010. Fertilizer and soil fertility potential in Ethiopia. Constraints and opportunities for enhancing the system. |
| [12] | Jagdish P, Ray SK, Gajbhiye K. S. and Singh S. R. 2009. Soil of Selsura Research farm in Wardha District, Maharashtra and their suitability for crops. Agropedology, 19: 84-91. |
| [13] | Kebede Tesfaye. 2010. Assessment of on-farm breeding practices and estimation of genetic and phenotypic parameters for reproductive and survival traits in indigenous Arsi Bale goats. M. Sc. Thesis, Haramaya University, Dire Dewa, Ethiopia. |
| [14] | Ogunwale, J. O, Aliyu, L. and Ojeniyi, S. O (Eds). Soil and water management forpoverty alleviation and sustainable Environment Proceedings of the 31st annual conf. of SSSN/ABUZaria Nig. Nov. 13th to 17th, 2006. |
| [15] | Pulakeshi, H. B., Patil, P. L., Dasog, G. S. 2014. Characterization and classification of soil resources derived from chlorite schist in northern transition zone of Karnataka. Karnataka Journal of Agricultural Science 27(1): 14-21. |
| [16] | Schoonover, J. E., Crim, J. F. 2015. An introduction to soil concepts and the role of soils in watershed management. Journal of Contemporary Water Research and Education 154(1): 21-47. |
| [17] | Sommer, R., Bossio, D., Desta, L., Dimes, J., Kihara, J., Koala, S., Mango, N., Rodriguez, D., Thierfelder, C. and Winowiecki, L. 2013. Profitable and sustainable nutrient management systems for east and southern African smallholder farming systems Challenges and 15 opportunities. A synthesis of the eastern and southern Africa situation in terms of past experiences, present and future opportunities in promoting nutrients use in Africa. |
| [18] | Tekalign Tadese. 1991. Soil, plant, water, fertilizer, animal manure and compost analysis. Working Document No. 13. International Livestock Research Center for Africa, Addis Ababa, Ethiopia. |
APA Style
Megersa, B. A., Kurse, H. N., Megersa, R. W. (2025). Characterization, Classification and Mapping of Soil Resources in Adami Tulu Jido Kombolcha District of East Shewa Zone, Oromia. Science Development, 6(3), 97-113. https://doi.org/10.11648/j.scidev.20250603.17
ACS Style
Megersa, B. A.; Kurse, H. N.; Megersa, R. W. Characterization, Classification and Mapping of Soil Resources in Adami Tulu Jido Kombolcha District of East Shewa Zone, Oromia. Sci. Dev. 2025, 6(3), 97-113. doi: 10.11648/j.scidev.20250603.17
@article{10.11648/j.scidev.20250603.17,
  author = {Bekele Abebe Megersa and Hussein Namu Kurse and Reta Worku Megersa},
  title = {Characterization, Classification and Mapping of Soil Resources in Adami Tulu Jido Kombolcha District of East Shewa Zone, Oromia
},
  journal = {Science Development},
  volume = {6},
  number = {3},
  pages = {97-113},
  doi = {10.11648/j.scidev.20250603.17},
  url = {https://doi.org/10.11648/j.scidev.20250603.17},
  eprint = {https://article.sciencepublishinggroup.com/pdf/10.11648.j.scidev.20250603.17},
  abstract = {A study was undertaken in Adami Tulu Jido Kombolcha District of Oromia region, Ethiopia, to investigate the site, morphological and physico-chemical characteristics, classification and mapping of soils. Fourteen soil pedons at representative sites were described and 66 disturbed and undisturbed soil samples from identified horizons were taken for laboratory analysis. The data obtained showed that the soils varied from moderate to very deep, well drained, the surface soil color at (dry) varied from light gray (10YR 7/2) to very dark brown (7.5YR 2.5/2); at moist varied from brown (10YR4/3) to black (10YR2/1), while the subsurface color varied from white (10YR 8/1) to black (7.5YR 3/1,) at dry conditions and at moist condition the color varied from light gray (7.5YR 7/2) to black (7.5YR 2.5/1), the structure in the surface layers of the pedons 1, 2, 3, 6, 14 had weak fine granular and gradually in subsurface changed to Moderate fine sub angular blocky in the same pedons; Strong fine granular at surface changed to strong fine sub angular blocky in pedon 4; Strong fine angular blocky in pedon 5 and moderate medium granular in pedon 7 and 8 at surface and subsurface without gradual change. The values of the determined soil physical characteristics revealed that sand, silt, clay, bulk density and total porosity ranged from 34 to 81.78%, 9.22 to 48%, 5 to 28%, 0.95 to 1.31 g cm-3, 50.56 to 64.15% respectively. Moreover, the soils were neutral (pH 6.7 to 7.3) to strongly alkaline (pH >8.0), salt free (-1) except pedon 9 and 10 near to lake Abjeta. Soil organic matter content ranged from very low to moderate in and total N ranged very low to moderate, available phosphorus ranged from very low to low respectively. Soil exchangeable Ca2+ ranged from moderate to high (5.13 to 21.8 cmol(+) kg-1), high to very high in exchangeable K (0.65 to 3.46 cmol(+) kg-1), moderate to high in Mg (1.28 to 6.7 cmol(+) kg-1), low to very high in exchangeable Na (0.13 to 10.1 cmol(+) kg-1) and, moderate to high CEC (13.13 to 38.88% cmol(+) kg-1) and moderate to very high PBS (50.92 to 97.69%), respectively. Soil of the district was classified as chromic vertisols, Luvic phaeozems, vitric andosols, Solonetz and mollic andosols.},
 year = {2025}
}
TY  - JOUR
T1  - Characterization, Classification and Mapping of Soil Resources in Adami Tulu Jido Kombolcha District of East Shewa Zone, Oromia

AU  - Bekele Abebe Megersa
AU  - Hussein Namu Kurse
AU  - Reta Worku Megersa
Y1  - 2025/07/28
PY  - 2025
N1  - https://doi.org/10.11648/j.scidev.20250603.17
DO  - 10.11648/j.scidev.20250603.17
T2  - Science Development
JF  - Science Development
JO  - Science Development
SP  - 97
EP  - 113
PB  - Science Publishing Group
SN  - 2994-7154
UR  - https://doi.org/10.11648/j.scidev.20250603.17
AB  - A study was undertaken in Adami Tulu Jido Kombolcha District of Oromia region, Ethiopia, to investigate the site, morphological and physico-chemical characteristics, classification and mapping of soils. Fourteen soil pedons at representative sites were described and 66 disturbed and undisturbed soil samples from identified horizons were taken for laboratory analysis. The data obtained showed that the soils varied from moderate to very deep, well drained, the surface soil color at (dry) varied from light gray (10YR 7/2) to very dark brown (7.5YR 2.5/2); at moist varied from brown (10YR4/3) to black (10YR2/1), while the subsurface color varied from white (10YR 8/1) to black (7.5YR 3/1,) at dry conditions and at moist condition the color varied from light gray (7.5YR 7/2) to black (7.5YR 2.5/1), the structure in the surface layers of the pedons 1, 2, 3, 6, 14 had weak fine granular and gradually in subsurface changed to Moderate fine sub angular blocky in the same pedons; Strong fine granular at surface changed to strong fine sub angular blocky in pedon 4; Strong fine angular blocky in pedon 5 and moderate medium granular in pedon 7 and 8 at surface and subsurface without gradual change. The values of the determined soil physical characteristics revealed that sand, silt, clay, bulk density and total porosity ranged from 34 to 81.78%, 9.22 to 48%, 5 to 28%, 0.95 to 1.31 g cm-3, 50.56 to 64.15% respectively. Moreover, the soils were neutral (pH 6.7 to 7.3) to strongly alkaline (pH >8.0), salt free (-1) except pedon 9 and 10 near to lake Abjeta. Soil organic matter content ranged from very low to moderate in and total N ranged very low to moderate, available phosphorus ranged from very low to low respectively. Soil exchangeable Ca2+ ranged from moderate to high (5.13 to 21.8 cmol(+) kg-1), high to very high in exchangeable K (0.65 to 3.46 cmol(+) kg-1), moderate to high in Mg (1.28 to 6.7 cmol(+) kg-1), low to very high in exchangeable Na (0.13 to 10.1 cmol(+) kg-1) and, moderate to high CEC (13.13 to 38.88% cmol(+) kg-1) and moderate to very high PBS (50.92 to 97.69%), respectively. Soil of the district was classified as chromic vertisols, Luvic phaeozems, vitric andosols, Solonetz and mollic andosols.
VL  - 6
IS  - 3
ER  -
Oromia Agricultural Research Institute, Batu Soil Research Centre, Batu, Ethiopia
Oromia Agricultural Research Institute, Batu Soil Research Centre, Batu, Ethiopia
Oromia Agricultural Research Institute, Batu Soil Research Centre, Batu, Ethiopia
Information