Soil fertility assessment and mapping is the way of assessing soil nutrients on the basis of soil samples test results and preparing maps at required scale. The study tried to map selected plant nutrients phosphorous, potassium, organic carbon and other soil fertility indicators (pH. EC, CEC) for Kofele district, Oromia, Ethiopia. About 161 soil samples were collected across the district and used to map the whole area. Standard laboratory analyses were followed for every soil parameters. In order to predict values for not sampled locations the Ordinary Kriging interpolation was used by ArcGIS10.1 software. The potassium level in the study site has two classes’ medium and high which covers 79.98% and 20.02%, respectively. The district has four categories of soilpH but the majority of the area falls in strongly acidic. Generally, the pH of the study were very strongly acidic (5.63% of the area, strongly acidic (63.85% of the area), extremely acidic (0.35% of the area) and moderately acidic (30.16% of the area). The available phosphorus level is categorized as low, medium and high which is 0.71%, 98.36%, and 0.93%, respectively. The dominating class is medium. Cation Exchange Capacity can also be categorized in three classes namely low (9.14%), moderate (90.84%) and high (0.016%) in soils of the area. Soil Electrical Conductivity is ranged from 0.085 to 0.383 mmhos/cm at 25oCi.e, are salt free. Soil Organic Matter content ranged from 1.10% to 4.79%namely from low to moderate in rating classes. The organic matter content of soils of the study area are dominated by moderate and low with percent share of 79.73%, 20.27%, respectively. Exchangeable potassium (K) can also be categorized in two classes namely medium 79.98% and high 20.02% in soil of the area.
This is an Open Access article, distributed under the terms of the Creative Commons Attribution 4.0 International License (http://creativecommons.org/licenses/by/4.0/), which permits unrestricted use, distribution and reproduction in any medium or format, provided the original work is properly cited.
Soil fertility depletion is considered as the fundamental biophysical cause for declining food production in SSA countries in general and Ethiopia in particular
[18]
Sanchez, P. A., Sheperd, K. D., Soul, M. J., Place, F. M., Buresh, R. J., Izac, A. M. N., Mokwunye, A. U, Kwesiga, F. R., Ndirtu, C. G. and Woomer, P. L. 1997. Soil fertility replenishment in Africa. An investment in natural resource capital. pp. 1-46. In: Buresh, R. J. Sanchez, P. A. and Calnoun, F. (eds.). SSSA special publication No. 51. SSSA. Am. Soc. Argon. Madison, Wisconsin, USA. pp: 1-46.
[18]
Farmers in most parts of the country actually work hard, in seasons of the year when the rainfall is favorable for their cropping; regardless of their effort they get very little, which does not help them to escape their subsistence way of living. The fault with this agricultural problem is very intricate in nature, the complexity arises from various condition of the country such as the agro-climate, topography of the lands, the soil types and socio-economic status of the farming community and the combination of these; the overall effect of which is finally reflected by soil fertility decline and reduction in yield of crops
[3]
Alemayehu M, Yohanes F, Dubale P (2006). Effect of indigenous stone bunding on crop yield at MesobitGendeba. J. Land Degr. 45-54.
[3]
.
The issue is to solve the problem, systematic application of scientific methods to assess the fertility status of soils through their physical, chemical and biological properties. Research results have shown that the success in soil management to maintain soil quality depends on understanding of the properties of a given soil. This is a requisite for designing appropriate management strategies and thereby solving many challenges that the Ethiopians are facing in the crop and livestock production sectors and in their efforts towards natural resource management for sustainable development
[25]
WakeneNegassa. 2001. Assessment of important physicochemical properties of DystricUdalf (DystricNitosols) under different management systems in Bakoarea, Western Ethiopia (Published MSc thesis). Alemaya University, Alemaya, Ethiopia.
[25]
. Regional Research Institutes and national and regional soil laboratories, have been progress in terms of resources and output, they are currently carrying out research on various areas of soil and water management, fertilizer recommendations, management of problematic soils, and other relevant areas. However, much of these activities are specific to particular areas selected for study and currently cannot be compiled, compared, or accessed at a national level to enable policymakers and other stakeholders to draw conclusions on the status of soil in Ethiopia as a whole and its implications for food production. Describing the spatial variability across a field was difficult until new technologies such as Global Positioning Systems (GPS) and Geographic Information Systems (GIS) were introduced. GIS is a powerful set of tools for collecting, storing, retrieving, transforming and displaying spatial data
[5]
Burrough PA, Rachael A, McDonnell. Principles of Geographical Information Systems. New York, USA: Oxford University Press; 1998.
[5]
. GIS can be used in producing soil fertility map of an area that helps to understand the status of soil fertility spatially and temporally, which will help in formulating site-specific balanced fertilizer recommendation. These technologies allow mapping fields accurately and computing complex spatial relationships between soil fertility factors. Numerous studies have been conducted based on geo-statistical analysis to characterize the spatial variability of different properties
[6]
Cao SK, Chena KL, Cao GC, et al. The analysis of characteristic and spatial variability for soil organic matter and organic carbon around qinghai lake. Procedia Environmental Sciences. 2011; 10(A): 678 -684.
[14]
Li XG, Li FM, Zed R, et al. Soil physical properties and their relations to organic carbon pools as affected by land use in an alpine pastureland. Geoderma. 2007; 139(1-2): 98-105.
[15]
Lin JS, Shi XZ, Lu XX, et al. Storage and spatial variation of phosphorus in paddy soils of China. Pedosphere. 2009; 19(6): 790-798.
[16]
Liu ZP, Shao MA, Wang YQ. Spatial patterns of soil total nitrogen and soil total phosphorus across the entire Loess Plateau region of China. Geoderma. 2013; 197-198: 67-78.
[12]
Huang B, Sun WX, Zhao YC, et al. Temporal and spatial variability of soil organic matter and total nitrogen in an agricultural ecosystem as affected by farming practices. Geoderma. 2007; 139(3-4): 336-345.
[26]
Weindorf DC, Zhu Y. Spatial variability of soil properties at Capulin Volcano, Mew Mexico, USA: implications for sampling strategy. Pedosphere. 2010; 20(2): 185-197.
[6, 14-16, 12, 26]
.
Thus, information on spatial variability of soil nutrients is important for sustainable management of soil fertility. Among many Geo-statistical methods, ordinary kriging is widely used to map spatial variation of soil fertility. According
[17]
Samira I, Ahmed D, Lhoussaine M. Soil fertility mapping: comparison of three spatial interpolation techniques. International Journal of Engineering Research and Technology. 2014; 3(11): 134-143.
[17]
the ordinary kriging (using either exponential or spherical models) is more accurate for predicting the spatial patterns of the soil properties pH, OM, P, and K than the two other methods (IDW and splines), because it provides a higher level of prediction accuracy
[20]
Song G, Zhang L, Wang K, et al. Spatial simulation of soil attribute based on principle of soil science. IEEE; 2013.
[20]
. Soil testing provides information regarding nutrient availability in soils which forms the basis for the fertilizer recommendations for optimizing crop yields. Soil fertility maps are meant for highlighting the nutrient needs, based on fertility status of soils and adverse soil conditions which need improvement to realize good crop yields
[23]
Verma VK, Patel LB, Toor GS. Spatial distribution of macronutrients in soils of arid tract of Punjab, India. International Journal of Agriculture and Biology. 2005; 7(2): 295-297.
[23]
. Knowledge about an up-to-date status of different soil parameters at different landscapes and mapping their spatial distribution play a vital role in site-specific fertilizer recommendation to enhance production and productivity of the agricultural sector on sustainable basis. However, information on the status and spatial distribution of soil macronutrients are limited for west Arsi zone. Therefore, as part of the regional initiative, this study was conducted with specific objectives to assess and map the status and spatial distribution of soil major nutrients for Kofele district west Arsi Zone. The results of this study are expected to add value to the up-to date scientific documentation of the status of soil fertility for national soil atlas which is being considered the recommended fertilizer source for maximizing crop yields and further to maintain the sustainable agriculture. Although Soil fertility assessment and mapping at Kofele district was initiated as response of where and how to use the soil test based crop response studies results, it has more advantage than this to give information about soil fertility status of the district for different users.
The objectives of the study were as follows:
To map soil fertility parameters and classify soil nutrient status of the study area.
2. Materials and Methods
2.1. Descriptions of Study Areas
The study was conducted at Kofele district which is found in Oromia Regional State and 272 kilometers far from Finfenne, the capital city of Oromia regional state to south direction. Geographically, Kofele district is located between 60 50' 55 to 70 9' 40 North latitudes and 380 39' 08" to 390 3' 4" East longitudes. With total area coverage of 66097.1 hectares.
Land Use and Vegetation
The main land use systems in the district are mixed (crop-livestock) agricultural system. The major crops produced are wheat (TriticumaestivumL.), maize (Zea mays L,), barley (Hordeumvulagare L.), potato (Salantumtuberosum), fababeans, (Viciafaba), fieldpeas (Pisumstivum) andenset (Enseteventricosum). Besides, and other cash crops vegetables are also produced widely. Agriculture is entirely rain fed. There are also different types of natural vegetation, grasses and waterlogged area.
2.2. Soil Sampling
At the beginning of the study, a preliminary soil survey and field observation were carried out using the topographic map (scale 1:50,000) and satellite image dated January 2016/17. Once the topographic map was interpreted, pre-defined sampling locations were navigated and the exact sampling points were determined by letting the GPS mean position for at least three to five minutes. However, as some pre-defined points were found in unsuitable places for sampling (e.g. road, waterway, and household) they were re-located in alternate locations within nearby cropping fields mostly inside a radius of 50 to 100 meters. Each location was recorded with a Garmin Map 70 S GPS using Adindan_UTM_ Zone_37N projected coordinates with 3 to 5 meter accuracy. After reading the coordinate points and elevation of sampling points, slope gradient (%) of the study area was measured using clinometer by standing in the center of the plot. Then, 10 to 15 sub-samples were taken based on the complexity of topography and heterogeneity of the soil type. In order to address effective root depth of most annual crops, composite soil samples were collected from the top soil (0-20 cm) for chemical analysis. For perennial/tree crops such as fruit trees, coffee, etc sampling depth was extended to 0-50 cm downwards. During collection of sub samples, maximum care was taken to address variability of the surrounding in terms of the dominant topography and soil type; for those landscapes having uniform topography and homogenous soil type (basically similar soil colour and texture) a minimum of 10 sub-samples were collected and composited within 10 to 50 m distance between each sub-plots using random sampling technique. Accordingly, about 161 points were successfully sampled in the thirty-nine kebeles (or peasant associations) of the District: during the off-season of 2007 E.C cropping season. Soil Sample Preparation: -Sample preparation was made at Batu Soil Research Center. The samples were air dried and crushed using a mortar and pestle and passed through a 2 mesh sieve.
Methods Followed
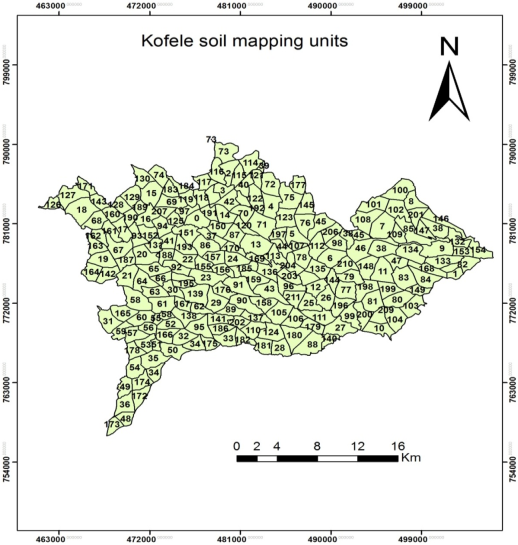
Selecting Uniform Sampling:- Area Soil conditions are influenced by many environmental factors those could be aggravated accordingly through intervention of human beings and natural disasters, therefore while studying soil qualities including fertility status; it is important to investigate the relationship of soil forming factors and others. In this study as much as possible it was attempted to comprehensively investigate different factors such as topographic, land use, climate and soils of the area at required scale. The influencing factors were collected from different sources and prepared for further spatial analysis in order to produce spatial layers/ features of the study area. These factors were compared to each other and areas those have almost similar characteristics were grouped in to the same category by using GIS overlay analysis. These categories were used as mapping units and soil samples were collected from these units. Then the district was divided into 161 units as indicated in figure 2 below.
Based on Booker tropical soil manual 1991 the result of analysis of individual parameters of soils were classified into different categories, i.e. low, medium, high and very high in respect of available contents of each nutrients.
2.4. Map Preparation
After data base of samples prepared boost Statistical evaluation and geospatial evaluation were conducted. Then at the end of the activities soil Fertility map of the district was produced for available phosphorous, CEC meq/100 g soil, organic matter (%), available K and soil pH.
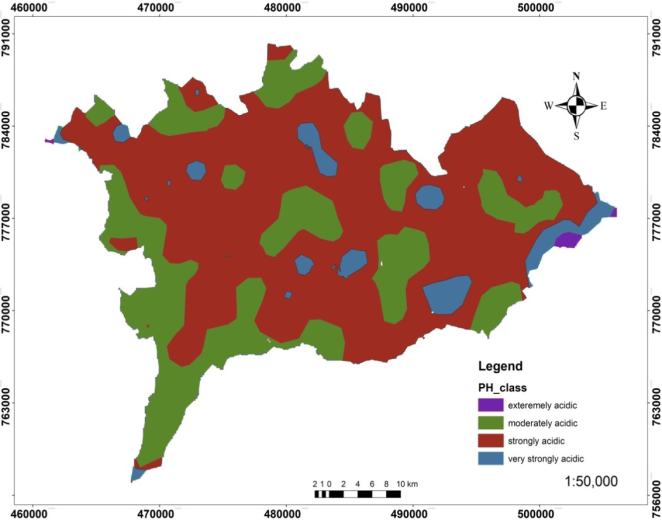
The soil pH of the study area ranged from 4.022 to 5.86 with average value of 4.87. The soil pH value of the area was low and ranged from extremely acidic (pH <4.5) to moderately acidic (5.6 - 6.0) as per the pH rating category suggested by
[11]
Jones, J. Benton. 2003. Agronomic Hand Book: Management of crops, soils and their fertility. Washington, USA: CRC Press.
[11]
(Figure 2). Based on this, 0.35%, 5.63%, 63.85% and 30.16% of the soils were extremely acidic, very strongly acidic, strongly acidic and moderately acidic in reaction, respectively.
3.2. Soil Organic Matter
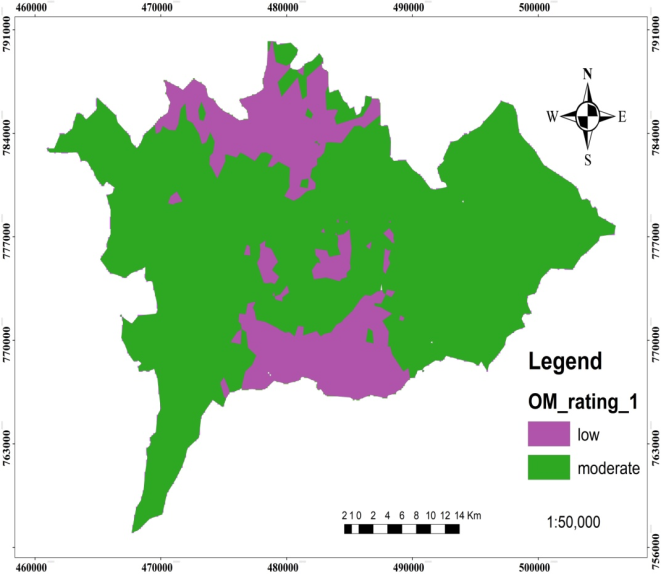
Similar to the other soil parameters discussed so far, the organic matter content of soils through the district showed spatial variation. Across the soil mapping units, it ranged from 1.10% to 4.79%. Following organic matter rating suggested by
[21]
TekalignTadese. 1991. Soil, Plant, Water, Fertilizer, Animal Manure and Compost Analysis. Working Document No. 13. International Livestock Research Center for Africa (ILCA), Addis Ababa, Ethiopia.
[21]
, the organic matter content of soils in the district ranged from low to moderate. Accordingly, out of the total sampled mapping units (161), 20.27% and 79.73% soils mapping units were low and moderate in area coverage, respectively as shown in (Table 1).
The most probable source of variation in OM contents among mapping units might be variation in altitude, intensity of cultivation, cropping system and soil management practices. The low levels of OM in the soil of mapping units might be attributed to continuous cultivation with complete removal of crop residue and limited application of organic fertilizers. This was in line with the findings of several authors
[7]
Duff, B., P. E. Rasmussen and R. W. Smiley, 1995. Wheat/fallow systems in semi-arid regions of the Pacific, north-west America. pp. 85-109. In: Barnett, V. Payne, R. and Steiner, R. (Eds). Agricultural Sustainability: Economic, Environmental and Statistical Considerations. New York, USA: John Wiley and Sons, Inc.
[10]
Grace, P. R., J. M. Oades, H. Keith and T. W. Hancock, 1995. Trends in wheat yields and soil organic carbon in the permanent rotation trial at the Waite Agricultural Research Institute, South Australia. Australian Journal of Experimental Agriculture. 35: 857- 864.
[7, 10]
. The intensive cultivation is expected to aggravate rapid oxidation of the small amount of organic matter returned to soils of the cultivated land units. Furthermore, total removal of crop residues for other purposes, such as animal feed, fuel, cash, and construction, is a common practice in the study area. In consent with the findings in this study,
[24]
WakeneNegassa and HelufGebrekidan, 2003. Forms of phosphorus and status of available micronutrients under different land-use systems of Alfisols in Bako area of Ethiopia. Ethiopian Journal of Natural Resources. 5(1): 17-37.
[4]
AlemayehuKiflu and ShelemeBeyene. 2013. Effect of different land use systems on selected soil properties in south Ethiopia. Journal of Soil Science and Environmental Management, 4(5): 100-107.
[24, 4]
demonstrated that intensive cultivation results in rapid oxidation of soil organic matter. Furthermore, the total removal of crop residues for animal feed and as source of energy was reported as being among the main reasons for low organic matter content in soils of Ethiopia by
[19]
Sheleme Beyene. 2011. Characterization of soils along a toposequence in Gununo area, southern Ethiopia. Journal of Science and Development. 1(1): 31-41.
[19]
.
[27]
YihenewGebreselassie. 2002. Selected chemical and physical characteristics of soils of AdetResaerch Centre and its testing sites in northwestern Ethiopia. EthiopianJournalofNatural Resources, 4(2): 199-215.
[27]
Also confirmed that most cultivated soils of Ethiopia are generally poor in organic matter content.
On the other hand, relatively higher (moderate) content of OM was recorded in soils of mapping units (79.73%). This might be due to the fact that wide land mapping units were repeated uses of fertilizers for production of vegetables during off season and their relatively level to gentle slope gradient where the soil moisture storage is better, resulting in better biomass production. Furthermore, the expected impeded drainage related to topography could also slow down the decomposition process. This result is in agreement with the work of
[1]
AbebeNigussie and EndalkachewKissi. 2012. Physicochemical characterization of Nitisol in Southwestern Ethiopia and its fertilizer recommendation using NuMaSS, Global Advanced Research Journal of Agricultural Science, 1(4): 66-73.
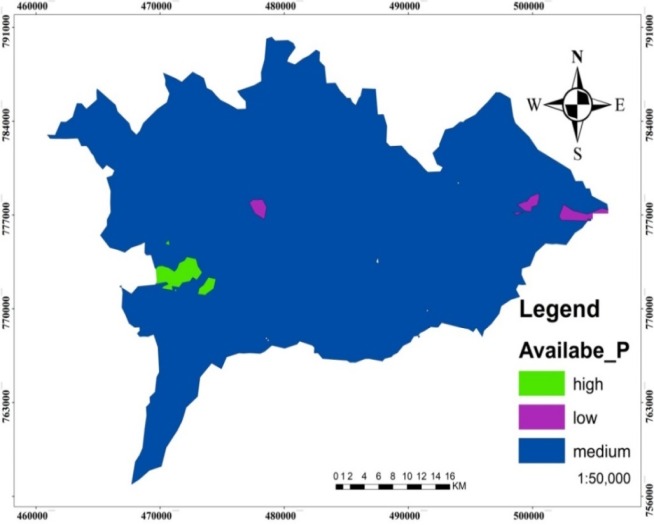
Among mapping units of the study area for available phosphorus content of soils varied from 1.94 ppm to 34.22 ppm. The classification was made according to
[13]
Landon, J. R. 1991. Booker tropical soil manual: A Handbook for Soil Survey and Agricultural Land Evaluation in the Tropics and Subtropics. Longman Scientific and Technical, Essex, New York. 474 p.
[13]
that was on the basis of its suitability for agricultural production and it has three classes as indicated in figure 5. The available phosphorus level in Kofele district was categorized as low, medium and High which accounts about 0.71%, 98.36%, and 0.93% respectively of mapping units of the study area which illustrated in (Table 1). As per ratings set by
[13]
Landon, J. R. 1991. Booker tropical soil manual: A Handbook for Soil Survey and Agricultural Land Evaluation in the Tropics and Subtropics. Longman Scientific and Technical, Essex, New York. 474 p.
[13]
the dominating class is medium which ranges from 5.0 to 15.0 ppm of available phosphorus and accounts about 98.36% of the area where as the least dominant was low which was not more than 0.71% of the area. The map of the available phosphorus for the Kofele district is illustrated in the (Figure 5). The variability in available P contents of soils might be due to different soil management practices, specifically, inherent soil fertility status, type and rate of organic and inorganic fertilizers used in cultivated lands. Besides these factors, variation in parent material, degree of P-fixation, soil pH and slope gradient may also contribute for the difference in available P contents among agricultural soils which in line with the findings of
[22]
Usmael Mohammed, KibebewKibret (PhD), Muktar Mohammed (PhD) and AlemayehuDiriba. 2018. Soil fertility assessment and mapping of Becheke sub watershed in Haramaya district of East Hararghe Zone of Oromia Region, Ethiopia. Journal of Natural Sciences Research, 8(20): 22-23.
Figure 4. Map of Available phosphorus at Kofele district.
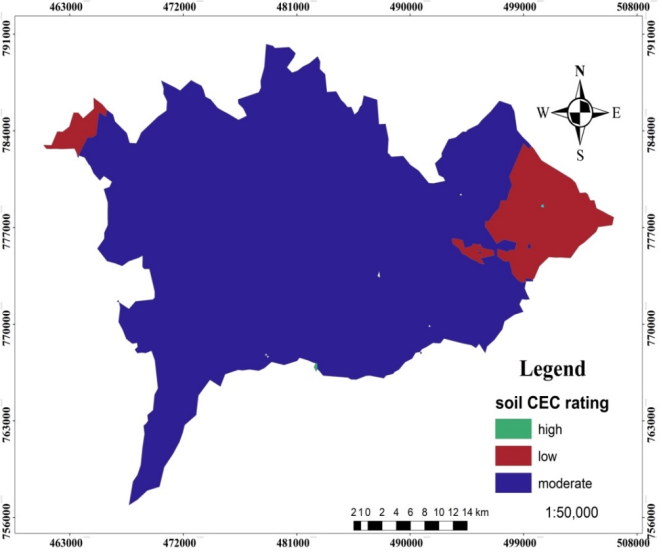
3.4. Cation Exchange Capacity
Measurements of the cation exchange capacity (CEC) show significant soil properties in particular its ability to retain the cation because of their mobility in the soil. The Kofele district soil CEC can be categorized in three classes namely low, moderate and high which accounts 9.14%, 90.84%, and 0.016% land area share as indicated in (Table 1). The spatial patterns of Cation Exchange Capacity are indicated in the (Figure 6).
The variation in CEC values of the studied soils might be the result of observed differences in OM and amount of clay, and soil management practices (intensity of cultivation). The intensive cultivation in the study area, for instance, might have reduced CEC indirectly through its effect on rapid oxidation of the small amount of organic matter in the soil. In line with
[2]
Alemayehu K 2007. Effects of land use and topography on soil properties at Delbo watershed. MSc Thesis, Hawassa University, Ethiopia. P. 64.
[8]
Fantaw Y. and Yimer A. 2011. The effect of crop land fall owing on soil nutrient restoration in the Bale Mountain. Sci. Dev. J. 1(1): 43-51.
[2, 8]
reported that depletion of OM as a result of intensive cultivation contributed to lower CEC of the soils.
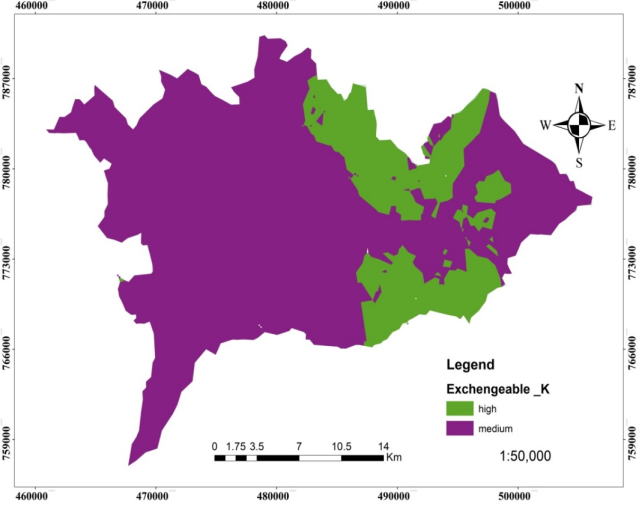
3.5. Exchangeable K
The results of laboratory analysis indicates greater values of potassium in the study site than the plant growth limiting ranges of soil potassium level, which ranges from 0.307 to 1.151 (meq/100g of soil). In the some context the Critical values for K that begin to limit plant growth are around 80 to 200 ppm. In case of this study, the status of potassium level in the surface soil of Kofele district are more than the values which limit the growth of crops in the study area. According to
[9]
FAO (Food and Agriculture Organization of the United Nations), 2006. Guidelines for soil description. 4th Edition. FAO, Rome.
[9]
the soil potassium level of study area has two classes’ medium and high which accounts 78.98% and 20.02% respectively as indicated in (Table 1). Its spatial pattern varies as indicated in (Figure 6).
Table 1. Shows soil parameters classes and their coverage in the study area.
Figure 6. Map of Exchangeable K at Kofele district.
4. Summary and Conclusions
A study was undertaken to assess soil fertility status of soils of Kofele district. The fertility status map of soils of the study area was based on physiographic mapping units and physicochemical properties of the soils. Primarily field observation was undertaken in the study area. Soil color, altitude, slope gradient, topography, land use type and soil management history were used to sub-divide the district into different mapping units. Soils of the study area are silt loam, sandy clay loam, loam and sandy loam in textural classes. Generally, sand size fraction followed by silt fraction dominated the study area.
The pH of the soil ranged from 4.022 to 5.86, indicating variation with status of extremely acidic to moderately acidic reaction which can affect the availability and solubility of some soil nutrients such as P and thus reduce crop yields. Therefore, appropriate rate of lime needs to be applied or cultivating acid tolerant crops is recommended for all extremely acidic, very strongly acidic, strongly acidic and moderately acidic soils of the study area to obtain optimum crop yields. The electrical conductivity values recorded in soils under the different mapping units indicate that the soils are free from salinity problem currently and in the foreseeable future. Soil OM ranges from 1.1% to 4.79% namely from low to moderate. The plant available P status ranged from 1.94 ppm to 34.22 ppm. But some parts of the agricultural soils of the study area were below the optimum level mainly due to the acidity of the soil reaction. Thus, site specific organic or inorganic P fertilizer sources are recommended to boost the agricultural productivity of the study areas. Low CEC shared 9.14%, moderate CEC shared 90.84% and high shared 0.016% of the total area of the mapping units. Soil EC is ranges 0.085 to 0.383 mmhos/cm i.e. totally salt free. The potassium level in the soil at study site has two classes medium and high.
Further calibration and correlation of soil test results with plant response is recommended for site-soil-crop specific fertilizer recommendation with appropriate rate since soil analysis alone cannot go beyond the identification of deficiency, sufficiency or toxicity status of soil nutrients due to complex and dynamic nature of the soil.
Acknowledgments
We would like to acknowledge Oromia Agricultural Research Institute for material support provided during whole the activity. We provide thanks to Batu Soil Research Center for providing necessary attention and follow up to conduct the research successfully.
Author Contributions
Bekele Abebe: Data curation, Formal Analysis, Investigation, Methodology, Software, Supervision, Validation, Writing - original draft, Writing - review & editing
AbebeNigussie and EndalkachewKissi. 2012. Physicochemical characterization of Nitisol in Southwestern Ethiopia and its fertilizer recommendation using NuMaSS, Global Advanced Research Journal of Agricultural Science, 1(4): 66-73.
[2]
Alemayehu K 2007. Effects of land use and topography on soil properties at Delbo watershed. MSc Thesis, Hawassa University, Ethiopia. P. 64.
[3]
Alemayehu M, Yohanes F, Dubale P (2006). Effect of indigenous stone bunding on crop yield at MesobitGendeba. J. Land Degr. 45-54.
[4]
AlemayehuKiflu and ShelemeBeyene. 2013. Effect of different land use systems on selected soil properties in south Ethiopia. Journal of Soil Science and Environmental Management, 4(5): 100-107.
[5]
Burrough PA, Rachael A, McDonnell. Principles of Geographical Information Systems. New York, USA: Oxford University Press; 1998.
[6]
Cao SK, Chena KL, Cao GC, et al. The analysis of characteristic and spatial variability for soil organic matter and organic carbon around qinghai lake. Procedia Environmental Sciences. 2011; 10(A): 678 -684.
[7]
Duff, B., P. E. Rasmussen and R. W. Smiley, 1995. Wheat/fallow systems in semi-arid regions of the Pacific, north-west America. pp. 85-109. In: Barnett, V. Payne, R. and Steiner, R. (Eds). Agricultural Sustainability: Economic, Environmental and Statistical Considerations. New York, USA: John Wiley and Sons, Inc.
[8]
Fantaw Y. and Yimer A. 2011. The effect of crop land fall owing on soil nutrient restoration in the Bale Mountain. Sci. Dev. J. 1(1): 43-51.
[9]
FAO (Food and Agriculture Organization of the United Nations), 2006. Guidelines for soil description. 4th Edition. FAO, Rome.
[10]
Grace, P. R., J. M. Oades, H. Keith and T. W. Hancock, 1995. Trends in wheat yields and soil organic carbon in the permanent rotation trial at the Waite Agricultural Research Institute, South Australia. Australian Journal of Experimental Agriculture. 35: 857- 864.
[11]
Jones, J. Benton. 2003. Agronomic Hand Book: Management of crops, soils and their fertility. Washington, USA: CRC Press.
[12]
Huang B, Sun WX, Zhao YC, et al. Temporal and spatial variability of soil organic matter and total nitrogen in an agricultural ecosystem as affected by farming practices. Geoderma. 2007; 139(3-4): 336-345.
[13]
Landon, J. R. 1991. Booker tropical soil manual: A Handbook for Soil Survey and Agricultural Land Evaluation in the Tropics and Subtropics. Longman Scientific and Technical, Essex, New York. 474 p.
[14]
Li XG, Li FM, Zed R, et al. Soil physical properties and their relations to organic carbon pools as affected by land use in an alpine pastureland. Geoderma. 2007; 139(1-2): 98-105.
[15]
Lin JS, Shi XZ, Lu XX, et al. Storage and spatial variation of phosphorus in paddy soils of China. Pedosphere. 2009; 19(6): 790-798.
[16]
Liu ZP, Shao MA, Wang YQ. Spatial patterns of soil total nitrogen and soil total phosphorus across the entire Loess Plateau region of China. Geoderma. 2013; 197-198: 67-78.
[17]
Samira I, Ahmed D, Lhoussaine M. Soil fertility mapping: comparison of three spatial interpolation techniques. International Journal of Engineering Research and Technology. 2014; 3(11): 134-143.
[18]
Sanchez, P. A., Sheperd, K. D., Soul, M. J., Place, F. M., Buresh, R. J., Izac, A. M. N., Mokwunye, A. U, Kwesiga, F. R., Ndirtu, C. G. and Woomer, P. L. 1997. Soil fertility replenishment in Africa. An investment in natural resource capital. pp. 1-46. In: Buresh, R. J. Sanchez, P. A. and Calnoun, F. (eds.). SSSA special publication No. 51. SSSA. Am. Soc. Argon. Madison, Wisconsin, USA. pp: 1-46.
[19]
Sheleme Beyene. 2011. Characterization of soils along a toposequence in Gununo area, southern Ethiopia. Journal of Science and Development. 1(1): 31-41.
[20]
Song G, Zhang L, Wang K, et al. Spatial simulation of soil attribute based on principle of soil science. IEEE; 2013.
[21]
TekalignTadese. 1991. Soil, Plant, Water, Fertilizer, Animal Manure and Compost Analysis. Working Document No. 13. International Livestock Research Center for Africa (ILCA), Addis Ababa, Ethiopia.
[22]
Usmael Mohammed, KibebewKibret (PhD), Muktar Mohammed (PhD) and AlemayehuDiriba. 2018. Soil fertility assessment and mapping of Becheke sub watershed in Haramaya district of East Hararghe Zone of Oromia Region, Ethiopia. Journal of Natural Sciences Research, 8(20): 22-23.
[23]
Verma VK, Patel LB, Toor GS. Spatial distribution of macronutrients in soils of arid tract of Punjab, India. International Journal of Agriculture and Biology. 2005; 7(2): 295-297.
[24]
WakeneNegassa and HelufGebrekidan, 2003. Forms of phosphorus and status of available micronutrients under different land-use systems of Alfisols in Bako area of Ethiopia. Ethiopian Journal of Natural Resources. 5(1): 17-37.
[25]
WakeneNegassa. 2001. Assessment of important physicochemical properties of DystricUdalf (DystricNitosols) under different management systems in Bakoarea, Western Ethiopia (Published MSc thesis). Alemaya University, Alemaya, Ethiopia.
[26]
Weindorf DC, Zhu Y. Spatial variability of soil properties at Capulin Volcano, Mew Mexico, USA: implications for sampling strategy. Pedosphere. 2010; 20(2): 185-197.
[27]
YihenewGebreselassie. 2002. Selected chemical and physical characteristics of soils of AdetResaerch Centre and its testing sites in northwestern Ethiopia. EthiopianJournalofNatural Resources, 4(2): 199-215.
@article{10.11648/j.scidev.20250603.19,
  author = {Bekele Abebe and Husen Namu},
  title = {Soil Fertility Assessment and Mapping at Kofele District, West Arsi Zone, Oromia Ethiopia
},
  journal = {Science Development},
  volume = {6},
  number = {3},
  pages = {121-130},
  doi = {10.11648/j.scidev.20250603.19},
  url = {https://doi.org/10.11648/j.scidev.20250603.19},
  eprint = {https://article.sciencepublishinggroup.com/pdf/10.11648.j.scidev.20250603.19},
  abstract = {Soil fertility assessment and mapping is the way of assessing soil nutrients on the basis of soil samples test results and preparing maps at required scale. The study tried to map selected plant nutrients phosphorous, potassium, organic carbon and other soil fertility indicators (pH. EC, CEC) for Kofele district, Oromia, Ethiopia. About 161 soil samples were collected across the district and used to map the whole area. Standard laboratory analyses were followed for every soil parameters. In order to predict values for not sampled locations the Ordinary Kriging interpolation was used by ArcGIS10.1 software. The potassium level in the study site has two classes’ medium and high which covers 79.98% and 20.02%, respectively. The district has four categories of soilpH but the majority of the area falls in strongly acidic. Generally, the pH of the study were very strongly acidic (5.63% of the area, strongly acidic (63.85% of the area), extremely acidic (0.35% of the area) and moderately acidic (30.16% of the area). The available phosphorus level is categorized as low, medium and high which is 0.71%, 98.36%, and 0.93%, respectively. The dominating class is medium. Cation Exchange Capacity can also be categorized in three classes namely low (9.14%), moderate (90.84%) and high (0.016%) in soils of the area. Soil Electrical Conductivity is ranged from 0.085 to 0.383 mmhos/cm at 25oCi.e, are salt free. Soil Organic Matter content ranged from 1.10% to 4.79%namely from low to moderate in rating classes. The organic matter content of soils of the study area are dominated by moderate and low with percent share of 79.73%, 20.27%, respectively. Exchangeable potassium (K) can also be categorized in two classes namely medium 79.98% and high 20.02% in soil of the area.},
 year = {2025}
}
TY  - JOUR
T1  - Soil Fertility Assessment and Mapping at Kofele District, West Arsi Zone, Oromia Ethiopia

AU  - Bekele Abebe
AU  - Husen Namu
Y1  - 2025/07/28
PY  - 2025
N1  - https://doi.org/10.11648/j.scidev.20250603.19
DO  - 10.11648/j.scidev.20250603.19
T2  - Science Development
JF  - Science Development
JO  - Science Development
SP  - 121
EP  - 130
PB  - Science Publishing Group
SN  - 2994-7154
UR  - https://doi.org/10.11648/j.scidev.20250603.19
AB  - Soil fertility assessment and mapping is the way of assessing soil nutrients on the basis of soil samples test results and preparing maps at required scale. The study tried to map selected plant nutrients phosphorous, potassium, organic carbon and other soil fertility indicators (pH. EC, CEC) for Kofele district, Oromia, Ethiopia. About 161 soil samples were collected across the district and used to map the whole area. Standard laboratory analyses were followed for every soil parameters. In order to predict values for not sampled locations the Ordinary Kriging interpolation was used by ArcGIS10.1 software. The potassium level in the study site has two classes’ medium and high which covers 79.98% and 20.02%, respectively. The district has four categories of soilpH but the majority of the area falls in strongly acidic. Generally, the pH of the study were very strongly acidic (5.63% of the area, strongly acidic (63.85% of the area), extremely acidic (0.35% of the area) and moderately acidic (30.16% of the area). The available phosphorus level is categorized as low, medium and high which is 0.71%, 98.36%, and 0.93%, respectively. The dominating class is medium. Cation Exchange Capacity can also be categorized in three classes namely low (9.14%), moderate (90.84%) and high (0.016%) in soils of the area. Soil Electrical Conductivity is ranged from 0.085 to 0.383 mmhos/cm at 25oCi.e, are salt free. Soil Organic Matter content ranged from 1.10% to 4.79%namely from low to moderate in rating classes. The organic matter content of soils of the study area are dominated by moderate and low with percent share of 79.73%, 20.27%, respectively. Exchangeable potassium (K) can also be categorized in two classes namely medium 79.98% and high 20.02% in soil of the area.
VL  - 6
IS  - 3
ER  -