Research Article | | Peer-Reviewed

Spatiotemporal Patterns and Projected Changes in Rainfall and Temperature Over the Harari Region, Ethiopia

Received: 22 July 2026     Accepted: 3 August 2026     Published: 31 October 2026
Views:       Downloads:
Abstract

Climate variability and climate change pose major challenges to sustainable development in Ethiopia, particularly in regions that depend heavily on rain-fed agriculture. This study investigated the historical (1985-2025) and projected (2041-2100) spatiotemporal variability of rainfall and temperature across the Harari Region using high-resolution observational datasets (Ethiopian Meteorological Institute (EMI), obtained through the Enhancing National Climate Services (ENACTS) dataset rainfall and temperature) together with statistically downscaled CMIP6 multi-model ensembles under the SSP2-4.5 and SSP5-8.5 scenarios. Historical trends were evaluated using the Modified Mann-Kendall test and Sen's slope estimator, while rainfall variability was characterized using the Coefficient of Variation (CV) and Precipitation Concentration Index (PCI). Results indicate significant warming trends in maximum, minimum, and mean temperatures throughout most months of the historical period. Rainfall exhibited pronounced seasonal variability, with significant decreases during February, March, April, and December, while annual rainfall remained moderately variable (CV = 20.5%) with moderate rainfall concentration (PCI = 11.88). Spatial analyses revealed higher rainfall and lower temperatures over the western highlands and warmer, relatively drier conditions in the eastern lowlands. Future CMIP6 projections indicate continued warming under both emission scenarios, with substantially greater increases under SSP5-8.5. Annual rainfall is projected to increase by approximately 9.6-42.7% under SSP2-4.5 and 14.7-58.2% under SSP5-8.5, although considerable interannual variability persists. The projected warmer and generally wetter climate may enhance water availability but simultaneously increase the risks of floods, soil erosion, heat stress, and agricultural uncertainty. The findings provide high-resolution climate information that can support evidence-based adaptation planning, climate-resilient agriculture, and integrated water resource management in the Harari Region.

Published in Science Discovery Environment (Volume 1, Issue 4)
DOI 10.11648/j.sdenv.20260104.13
Page(s) 194-214
Creative Commons

This is an Open Access article, distributed under the terms of the Creative Commons Attribution 4.0 International License (http://creativecommons.org/licenses/by/4.0/), which permits unrestricted use, distribution and reproduction in any medium or format, provided the original work is properly cited.

Copyright

Copyright © The Author(s), 2026. Published by Science Publishing Group

Keywords

Climate Change, CMIP6, SSP Scenarios, Harari Region, Ethiopia, Mann-Kendall Test, Sen's Slope, Rainfall Variability

1. Introduction
1.1. Background
Climate change is increasingly recognized as one of the most significant environmental challenges of the twenty-first century. Rising temperatures, changes in precipitation regimes, and increasing frequencies of extreme weather events are affecting ecosystems, water resources, food security, and socio-economic development worldwide . Developing countries, particularly those in Sub-Saharan Africa, are disproportionately vulnerable because of their strong dependence on climate-sensitive sectors and limited adaptive capacity .
Ethiopia is highly susceptible to climate variability and change due to its dependence on rain-fed agriculture, complex topography, and high exposure to hydroclimatic hazards . Numerous studies have documented significant warming trends across the country accompanied by substantial spatial heterogeneity in rainfall patterns . These climatic changes have important implications for agricultural productivity, water resource availability, and disaster risk management.
The Harari Region, located in eastern Ethiopia, represents one of the country's most climate-sensitive areas. The region experiences marked seasonal rainfall variability, recurrent drought episodes, and increasing temperature stress. Despite its socio-economic importance and vulnerability, localized climate studies remain limited.
Climate variability and long-term climate change represent major challenges to sustainable development, particularly in regions where livelihoods are closely tied to climate-sensitive sectors such as agriculture and water resources. Sub-Saharan Africa is widely recognized as one of the most vulnerable regions due to its limited adaptive capacity, high climate exposure, and dependence on rain-fed systems . In recent decades, observed changes in temperature and precipitation patterns have intensified climate-related risks, including droughts, floods, and heat extremes, with far-reaching socio-economic consequences.
Ethiopia exemplifies this vulnerability, experiencing recurrent climate shocks that disrupt food systems, water availability, and ecosystem stability. Observational studies indicate a consistent warming trend across the country, with mean annual temperatures increasing at rates between approximately 0.2°C and 0.6°C per decade . This warming is accompanied by a rise in the frequency and intensity of extreme temperature events, which have significant implications for crop productivity, livestock health, and human well-being. In contrast, rainfall trends across Ethiopia exhibit considerable spatial and temporal heterogeneity. While some regions show declining rainfall trends, others display weak or non-significant long-term changes but increased interannual variability, particularly during the Belg season .
Rainfall variability in Ethiopia is strongly influenced by large-scale climate drivers, including the El Niño-Southern Oscillation (ENSO) and the Indian Ocean Dipole (IOD). These teleconnections play a critical role in modulating seasonal rainfall patterns, often leading to droughts during El Niño years and enhanced rainfall during La Niña conditions . The complexity of these interactions contributes to the unpredictability of rainfall onset, cessation, and distribution, which poses significant challenges for agricultural planning and water resource management.
Eastern Ethiopia, including the Harari Region, is particularly vulnerable due to its semi-arid climate, high population density, and fragile agro-ecological systems. Previous studies focusing on eastern Ethiopia highlight increasing drought frequency, erratic rainfall distribution, and heightened climate sensitivity of agricultural systems . However, much of the existing literature is based on coarse-resolution datasets or aggregated regional analyses, which often fail to capture localized climate dynamics and microclimatic variability. This limitation is particularly critical for regions like Harari, where topographic complexity and land-use heterogeneity significantly influence local climate patterns.
A key methodological advancement in climate analysis has been the widespread adoption of non-parametric statistical techniques for trend detection. The Mann-Kendall test and Sen’s slope estimator are among the most commonly used methods for identifying monotonic trends in hydro-climatic time series . These approaches are robust to non-normal data distributions and missing values, making them suitable for climate datasets characterized by variability and uncertainty. Numerous studies in Ethiopia have applied these methods to assess trends in rainfall and temperature, consistently identifying significant warming trends but mixed rainfall signals . However, many of these analyses do not adequately account for serial correlation, which can lead to overestimation of trend significance, highlighting the need for modified approaches.
In addition to trend detection, climate variability indices such as the coefficient of variation (CV) and precipitation concentration index (PCI) provide important insights into the distribution and reliability of rainfall . High CV values indicate greater variability and uncertainty, while PCI helps assess the temporal concentration of rainfall within a year. These indices are particularly relevant for agricultural systems, as they influence planting decisions, crop growth, and yield stability. Despite their importance, the application of such indices at localized scales remains limited in Ethiopia, especially in smaller administrative regions like Harari.
Recent developments in climate modeling have further enhanced the ability to assess future climate risks. The Coupled Model Intercomparison Project Phase 6 (CMIP6) represents a significant advancement over previous modeling frameworks, incorporating improved representations of physical processes and updated socio-economic scenarios known as Shared Socioeconomic Pathways (SSPs) . These scenarios enable a more comprehensive exploration of future climate trajectories under varying levels of greenhouse gas emissions and socio-economic development. Studies using CMIP6 projections for Africa indicate substantial warming across all scenarios, with higher emission pathways leading to more pronounced temperature increases and extreme events .
However, Global Climate Models (GCMs) operate at relatively coarse spatial resolutions, limiting their applicability for local-scale studies. To address this limitation, downscaling techniques have been developed to refine climate projections to finer spatial scales. Statistical downscaling methods, such as Bias Correction Spatial Disaggregation (BCSD), have been widely used due to their computational efficiency and ability to produce high-resolution climate information . In Ethiopia, downscaled climate projections have revealed significant spatial variability in future rainfall and temperature patterns, with implications for water resources, agriculture, and disaster risk management .
Despite these advancements, several critical gaps remain in the literature. First, there is a lack of high-resolution, localized studies that integrate both historical observations and CMIP6-based future projections. Most existing research focuses either on historical analysis or future projections, with limited integration of the two. Second, the majority of studies are conducted at national or large regional scales, which often obscure local heterogeneity and microclimatic variations. Third, there is insufficient emphasis on translating climate analysis into actionable insights for local adaptation planning, particularly in regions with high vulnerability such as Harari.
Another important gap relates to the limited incorporation of spatial analysis techniques in climate studies. While temporal trends are relatively well-documented, spatial patterns of climate variability and change are less explored, particularly at fine resolutions. Understanding spatial heterogeneity is essential for identifying climate hotspots, assessing vulnerability, and designing targeted interventions. Furthermore, uncertainty analysis in climate projections is often underrepresented, despite its importance for robust decision-making.
This study addresses these gaps by providing a comprehensive assessment of spatiotemporal variability and trends in rainfall and temperature over the Harari Region. By integrating high-resolution observational datasets with CMIP6 multi-model projections, the study offers a unified framework for analyzing past and future climate dynamics. The application of robust statistical methods, climate indices, and spatial analysis techniques enables a detailed characterization of climate variability and change at a local scale.
The novelty of this study lies in three key aspects. First, it combines historical trend analysis with future climate projections using the latest CMIP6 datasets, providing a holistic understanding of climate dynamics. Second, it employs high-resolution spatial analysis to capture localized climate variability, addressing the limitations of coarse-scale studies. Third, it explicitly links climate analysis to potential impacts on agriculture, water resources, and climate resilience, enhancing its relevance for policy and decision-making.
1.2. Statement of the Problem
While national-scale climate studies exist for Ethiopia, the Harari Region's unique topography and microclimate require finer-scale analysis. Existing literature for Eastern Ethiopia indicates high inter-annual variability, yet there is a critical gap in high-resolution spatiotemporal mapping of future projections using the latest CMIP6 (Shared Socioeconomic Pathways - SSPs) frameworks specifically for this administrative boundary. Most previous climate studies in Ethiopia have focused on national or large river basin scales, often using coarse-resolution datasets that mask local climatic variability. Furthermore, few studies have integrated historical trend analysis with future CMIP6 projections at the regional scale. There is also limited information on the spatial distribution of climate variability and future climate hotspots within the Harari Region.
1.3. Objectives
General Objective
To analyze historical and projected spatiotemporal variability of rainfall and temperature over the Harari Region.
Specific Objectives
1) To assess historical spatiotemporal trends in rainfall and temperature (Minimum, Maximum, and Mean).
2) To evaluate climate variability using indices such as the Coefficient of Variation (CV) and Precipitation Concentration Index (PCI).
3) To project future changes in rainfall and temperature for the mid-century (2041-2070) and end-century (2071-2100) periods under multiple SSP scenarios (e.g., SSP2-4.5 and SSP5-8.5).
2. Data and Methodology
2.1 Study Area
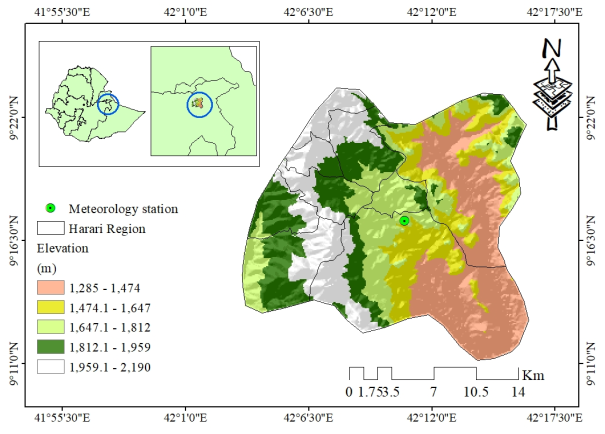
The study area is conducted in Ethiopia Harari Region, it is located in eastern Ethiopia, characterized by elevations ranging from midlands to highlands. The climate exhibits its bimodal rainfall patterns, including: Belg season (Feb-May) and Kiremt season (Jun-Sep). Rainfall variability and increasing temperature trends have significant implications for agriculture and water systems. Figure 1 shown the study areas.
Figure 1. Map of the study area illustrating its Elevation and Meteorological station.
2.2. Data and Sources
1) Observational Data: Station-based rainfall and temperature records from the Ethiopian Meteorological Institute (EMI), obtained through the Enhancing National Climate Services (ENACTS) dataset, were used for climate variability and trend analyses . For this study the data used from 1981- 2022 for the climate analysis and variability.
2) Model Data: Multi-model ensemble simulations from CMIP6, including historical (1985-2014) and future climate scenarios, were used to evaluate projected changes in temperature and precipitation and quantify climate uncertainty .
2.3. Methodology
2.3.1 Statistical Framework and Trend Detection
Historical trends were mapped using the non-parametric Modified Mann-Kendall (MK) test combined with Sen’s Slope Estimator to address potential autocorrelation issues. The Mann-Kendall Statistic (S) is computed via:
S=∑i=1n-1∑j=i+1nsgnxj-xi(1)
Where xi and xj are the data values in years I and j, and sgn (θ) is the sign function that returns 1, 0, or -1.
Sen’s Slope Estimator (beta):
To quantify the magnitude of the change (e.g., degrees Celsius or mm of rain per year), Sen’s slope is calculated as the median of all possible slopes between data pairs:
β=Medianxj-xij-i for all i<j (2)
2.3.2. Evaluation of Climate Variability Indices
The reliability and distribution of rainfall are evaluated using the Coefficient of Variation (CV) and the Precipitation Concentration Index (PCI). These indices help characterize the inter-annual uncertainty and the temporal concentration of rainfall within the Harari Region.
Coefficient of Variation (CV):
The CV is used to measure the inter-annual rainfall variability. A higher CV indicates greater unpredictability:
CV=σμ×100 (3)
Where σ is the standard deviation and μ is the mean of the rainfall series
Table 1. Coefficient of variation classification .

Class (%)

Classification

Remark

< 20

Low

Rain-fed agriculture is possible

20 < CV < 30

Moderate

Rain-fed supported with irrigation

>30

High

Not possible to rain-fed agriculture

Precipitation Concentration Index (PCI):
The Precipitation Concentration Index (PCI) was calculated to assess the monthly distribution of rainfall throughout the year. The PCI is computed using the following formula:
PCI=∑i=112pi2∑i=112pi2×100 (4)
Where pi is the rainfall amount in month i. A PCI values below 10 suggests a uniform distribution, while values above 20 indicate high concentration (seasonal) rainfall. Interpretation ; adapted classifications commonly used in Ethiopian studies):
PCI < 10: Uniform precipitation distribution
11-15: Moderate concentration
16-20: Irregular distribution
> 20: Strong irregularity / highly seasonal
2.3.3. Projection of Future Climate Changes (2041-2100)
Future simulations spanning 2041-2100 were modeled across two distinct socioeconomic pathways: SSP2-4.5 (moderate stabilization path) and SSP5-8.5 (high forcing scenario). To convert global grids into fine resolutions (~5-10 km) fitting the regional geography, Bias Correction Spatial Disaggregation (BCSD) was executed. The absolute temperature anomalies and percentage precipitation shifts are calculated via Delta configurations.
Bias Correction and Delta Method:
The methodology uses Bias Correction Spatial Disaggregation (BCSD) to align model outputs with historical observations. The projected change, often referred to as the "Delta" (Delta), is calculated as:
∆Temp=Tfuture-Thistorical (5)
Where ∆Temp is Change in temperature (usually in°C), Tfuture is Mean temperature during the future projection period and Thistorical Mean temperature during the historical (baseline) period.
Interpretation: If ΔTemp > 0, the future is warmer than the historical period and If ΔTemp < 0, the future is cooler than the historical period.
∆Precip=Pfuture-PhistoricalPhistorical×100 (6)
Where, ∆Precip Percentage change in precipitation (%), Pfuture is Mean precipitation during the future projection period and Phistorical is Mean precipitation during the historical (baseline) period.
3. Result and Discussion
3.1. Historical Descriptive Statistics
Statistical evaluation of the Harari meteorological station baseline data reveals a distinct seasonal distribution matching the bimodal monsoon framework.
Table 2. Descriptive statistics of rainfall Harari station (1981 - 2022).

Month

Count

Mean

Minimum

Maximum

Range

Median

Std Dev.

SE of mean

Variance

CV (%)

PCI Contribution

Jan

42

12.05

0.00

154.00

154.00

1.96

27.14

4.19

736.44

2.25

0.33

Feb

42

12.06

0.00

72.38

72.38

4.57

16.97

2.62

288.03

1.41

0.33

Mar

42

49.84

0.15

226.13

225.98

39.10

48.42

7.47

2344.03

0.97

5.67

Apr

42

111.36

5.08

416.97

411.89

97.49

76.82

11.85

5900.57

0.69

28.32

May

42

81.20

6.59

219.35

212.77

68.04

47.00

7.25

2208.60

0.58

15.06

Jun

42

47.05

9.40

142.81

133.41

40.36

29.83

4.60

889.93

0.63

5.06

Jul

42

84.12

8.83

189.82

180.99

79.40

38.20

5.89

1459.38

0.45

16.16

Aug

42

101.47

34.79

197.95

163.16

93.62

39.23

6.05

1539.30

0.39

23.51

Sep

42

88.25

28.41

217.11

188.70

74.09

40.69

6.28

1655.73

0.46

17.78

Oct

42

47.15

0.86

232.43

231.57

30.59

48.02

7.41

2306.38

1.02

5.08

Nov

42

16.16

0.00

101.74

101.74

7.96

20.27

3.13

410.95

1.25

0.6

Dec

42

9.11

0.00

52.10

52.10

3.40

12.82

1.98

164.27

1.41

0.19

Annual

659.82

~20.5

11.88

Table 2, shows that April is historically the wettest month during the Belg season (Mean = 111.36 mm), while August forms the core peak of the Kiremt monsoon cycle (Mean= 101.47mm). Conversely, the winter Bega months (December-January) experience minimal monthly baselines. The annual PCI value of 11.88 indicates moderate seasonal concentration of rainfall, consistent with the bimodal rainfall regime of the region, with a significant portion concentrated in the Belg and Kiremt seasons, but not extremely irregular. April and August contribute the largest shares to the annual total (approximately 28.3% and 23.5% of the PCI respectively), highlighting their critical role in the water budget. This moderate concentration implies that while rainfall is not uniformly distributed, it remains predictable enough to support rain-fed agriculture during the main Kiremt season, though high inter-annual variability (as shown by CV) remains a challenge.
3.2. Historical Data Analysis and Mann-Kendall Test Result
3.2.1. Summary for Rainfall, and Temperature (Maximum, Minimum) Trend
The Modified Mann-Kendall (MK-test) trend test for rainfall, maximum and minimum temperature is shown on Table 3-6.
Table 3. Summary of Mann-Kendall test and Sen’s slope for historical rainfall.

Month

Tau

p_value

Sig

Trend

Jan

-0.034

0.1127

ns

No trend

Feb

-0.1949

0

***

Decrease ↓

Mar

-0.1612

0

***

Decrease ↓

Apr

-0.0549

0.0038

**

Decrease ↓

May

-0.0222

0.2356

ns

No trend

Jun

-0.0252

0.1866

ns

No trend

Jul

-0.0292

0.1148

ns

No trend

Aug

0.005

0.7869

ns

No trend

Sep

0.0154

0.4134

ns

No trend

Oct

-0.028

0.1526

ns

No trend

Nov

0.0269

0.2094

ns

No trend

Dec

-0.0771

0.0003

***

Decrease ↓

Table 3 shows the Modified Mann-Kendall test revealed a mixed but predominantly declining pattern in monthly rainfall over the historical period. Significant decreasing trends (p < 0.01 or p < 0.001) were detected in February, March, April, and December, indicating reduced precipitation during these months. The remaining months showed no statistically significant trends. This suggests an overall drying tendency, particularly in the early and late parts of the year, which could have implications for water availability and agricultural planning.
Table 4. Summary of Mann-Kendall test and Sen’s slope for historical Tmax.

Month

Tau

p_value

Sig

Trend

Jan

0.0331

0.0737

.

No trend

Feb

0.1822

0

***

Increase ↑

Mar

0.189

0

***

Increase ↑

Apr

0.2032

0

***

Increase ↑

May

0.2069

0

***

Increase ↑

Jun

0.1799

0

***

Increase ↑

Jul

0.2199

0

***

Increase ↑

Aug

0.2701

0

***

Increase ↑

Sep

0.1919

0

***

Increase ↑

Oct

0.2595

0

***

Increase ↑

Nov

0.1838

0

***

Increase ↑

Dec

0.0791

0

***

Increase ↑

Table 4 shows, a consistent and highly significant increasing trend in maximum temperature was observed across nearly all months (p < 0.001), with the exception of January, which showed only a marginal (non-significant) increase. Tau values were positive and notable, especially from July to October. These results point to a clear warming of daytime temperatures, consistent with broader climate change signals and likely to intensify heat stress on ecosystems and human activities.
Table 5. Summary of Mann-Kendall test and Sen’s slope for historical Tmin.

Month

Tau

p_value

Sig

Trend

Jan

-0.0498

0.0072

**

Decrease ↓

Feb

0.0661

0.0007

***

Increase ↑

Mar

-0.0207

0.2637

ns

No trend

Apr

0.0777

0

***

Increase ↑

May

0.1086

0

***

Increase ↑

Jun

0.1324

0

***

Increase ↑

Jul

0.1072

0

***

Increase ↑

Aug

0.1081

0

***

Increase ↑

Sep

0.1361

0

***

Increase ↑

Oct

0.0954

0

***

Increase ↑

Nov

0.0547

0.0036

**

Increase ↑

Dec

-0.041

0.0267

*

Decrease ↓

Table 5 shows, trends in minimum temperature were more variable. Significant increases occurred in most months (February, April-November), while January and December exhibited significant decreases. March showed no trend. This pattern indicates warming nights in the majority of the year, with cooler conditions in the coldest months, potentially altering diurnal temperature ranges and affecting frost-sensitive agriculture or biodiversity.
Table 6. Summary of Mann-Kendall test and Sen’s slope for historical T.aveg.

Month

Tau

p_value

Sig

Trend

Jan

-0.0183

0.3221

ns

No trend

Feb

0.155

0

***

Increase ↑

Mar

0.1336

0

***

Increase ↑

Apr

0.2064

0

***

Increase ↑

May

0.2445

0

***

Increase ↑

Jun

0.2151

0

***

Increase ↑

Jul

0.2001

0

***

Increase ↑

Aug

0.2422

0

***

Increase ↑

Sep

0.2481

0

***

Increase ↑

Oct

0.2866

0

***

Increase ↑

Nov

0.1859

0

***

Increase ↑

Dec

0.0126

0.4957

ns

No trend

Table 6 shows, the Average temperature displayed strong increasing trends in February through November (p < 0.001), with no significant change in January and December. The positive Tau statistics confirm a robust overall warming signal in mean temperatures for most of the year. These findings reinforce the observed shifts in extremes and highlight the need for adaptation strategies in climate-sensitive sectors.
These results collectively demonstrate significant climatic shifts in the study area, characterized by declining rainfall in key months alongside widespread temperature increases. Such changes warrant further investigation into their drivers and socio-economic impacts for manuscript development.
3.2.2. Trend and Spatial Climatology of Annual and Seasonal Rainfall
The trend and spatial distribution of the long-term average rainfall for the three main seasons Kiremt (main rainy season), Belg (short rains), Bega (dry season), and the annual total across the Harari Region.
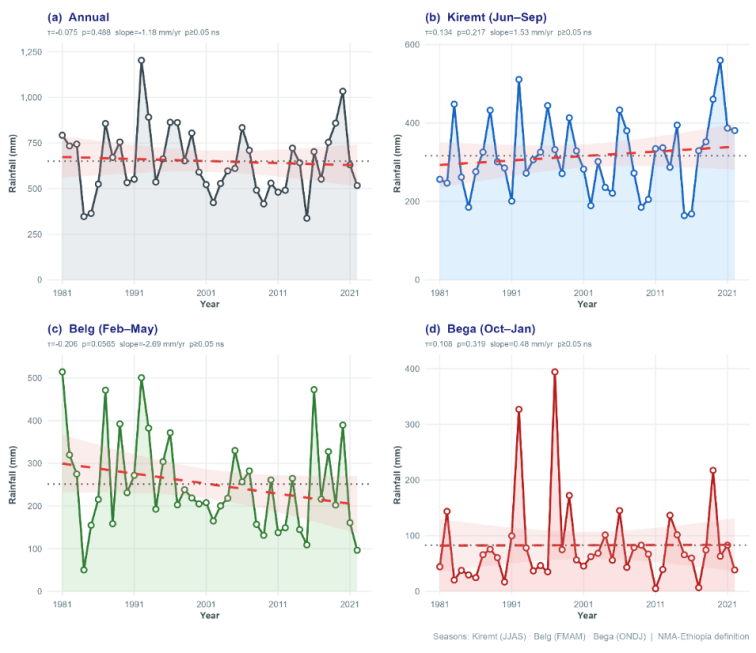
Figure 2 shows, the he annual and seasonal area-averaged rainfall trends over the Hareri region (1981-2022) indicate notable variability and some directional changes. On an annual basis (a), rainfall exhibited high inter-annual fluctuations with a slight non-significant decreasing trend (slope = -1.18 mm/year, p > 0.05). Seasonally, the Kiremt (June-September) main rainy season (b) showed a non-significant increasing trend (slope = 1.53 mm/year, p > 0.05), though with substantial year-to-year variability. In contrast, the Belg (February-May) short rainy season (c) displayed a clearer declining trend (slope = -2.88 mm/year, p < 0.05), suggesting reduced reliability of the early-year rains. The Bega (October-January) dry season (d) had a weak, non-significant increasing tendency (slope = 0.48 mm/year, p > 0.05).
Figure 2. Rainfall Trends over Hareri region.
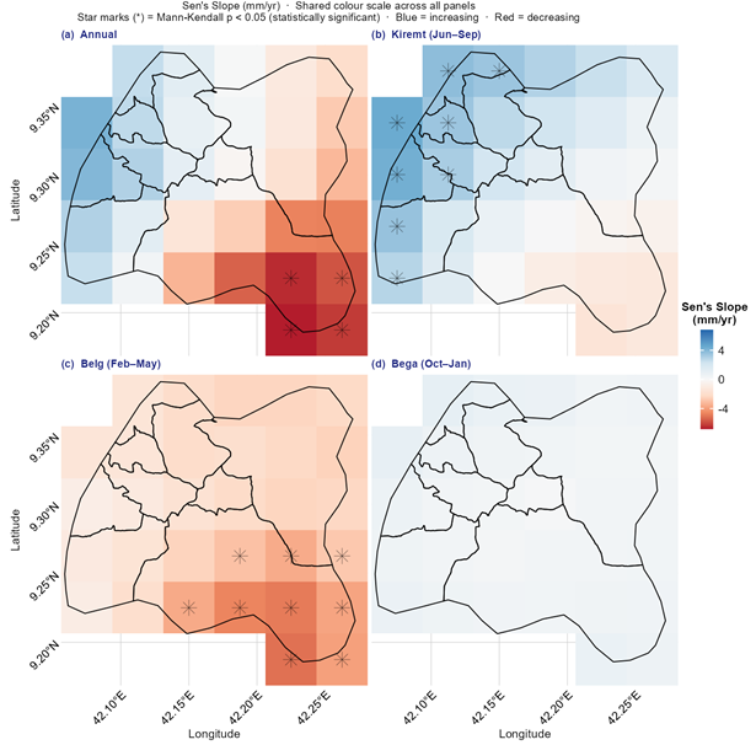
Figure 3, shows a comprehensive overview of the spatial variation in rainfall across the Harari Region. Average annual rainfall increases from east to west. The western and northwestern highland segments function as a wet zone, receiving total annual precipitation exceeding 700 mm. Moisture levels decrease towards the eastern lowlands, where total annual amounts drop below 600 mm.
Figure 3. Spatial trend of annual and seasonal rainfall over the Harari Region.
3.2.3. Spatial Climatology of Annual and Seasonal Maximum Temperature
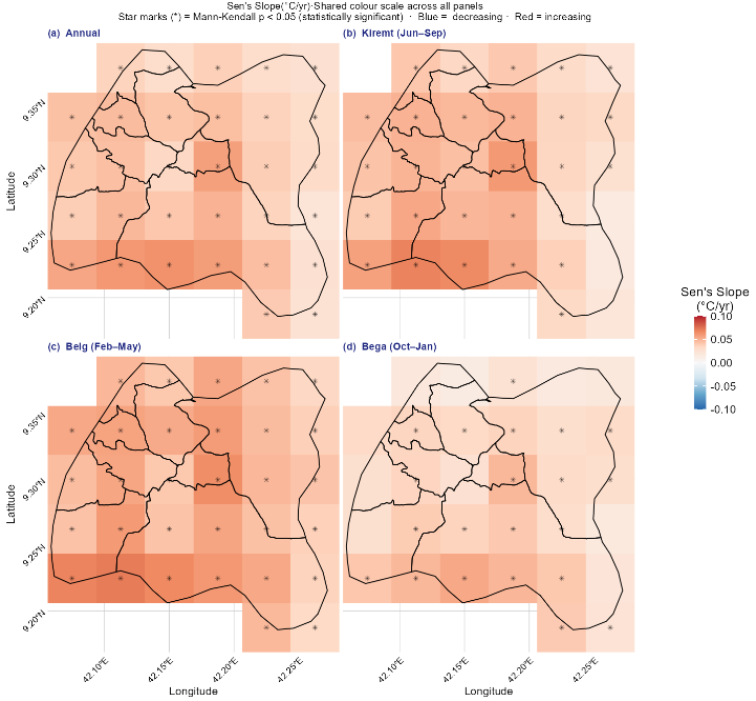
A seasonal and annual spatial maximum temperature gradient over the Harari region is depicted in Figure 4. The region's temperatures are consistently highest in the east and lowest in the west and northwest. The terrain of the area, which consists of mountains in the west and lowlands in the east, is probably to blame for this variation. The entire Woreda experiences a high maximum temperature during the Belg season, whereas the value drops during the Kirmet season.
Figure 4. Spatial trend of annual and seasonal maximum temperature over the Harari Region.
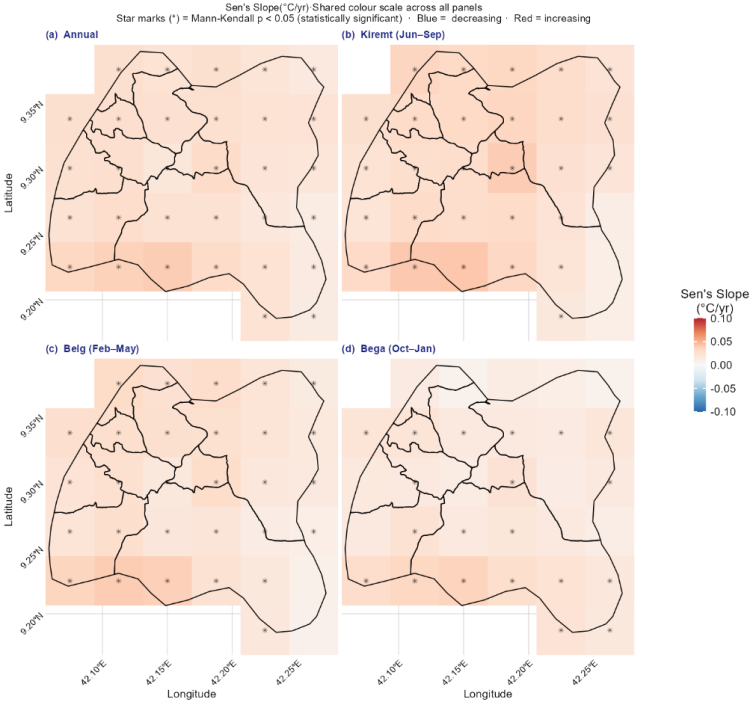
3.2.4. Spatial Climatology of Annual and Seasonal Minimum Temperature
Figure 5, shows the geographical minimum temperature gradient over the Harari region, both seasonally and annually. The east of the area always experiences the warmest temperatures, while the west and northwest experience the coldest. This difference is likely due to the region's topography, which includes plains in the east and mountains in the west. Throughout the Bega season, the lowest temperature throughout the entire Woreda is low, whereas in the Kirmet and Belg seasons, it is high.
Figure 5. Spatial trend of annual and seasonal minimum temperature over the Harari Region.
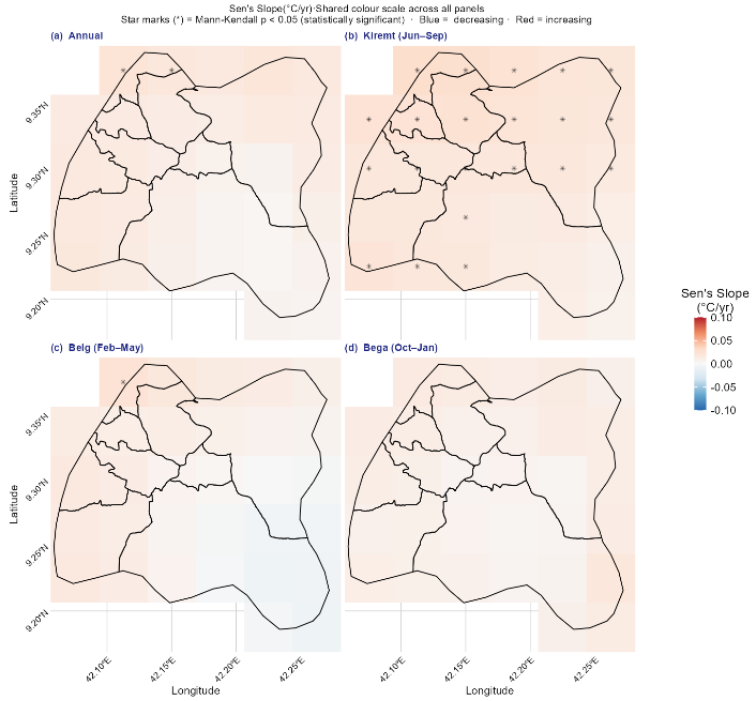
3.2.5. Spatial Climatology of Annual and Seasonal Mean Temperature
Figure 6, shows the mean air temperature. It is warmer in the east than in the west, and the temperature increases from north to south. Sofi and Erer-Harari woreda are a bit warmer than other woredas in the Harari region. On the other hand, woredas like Abadir, Aboker, Hakim, Jinela, DireTeyara, AmirNur, and Shenkor have average air temperatures below 21°C and are relatively colder.
Figure 6. Spatial trend of annual and seasonal mean temperature over the Harari Region.
3.3. Evaluation of Climate Variability Indices
3.3.1. Spatial distribution of Coefficient of Variation (CV) of Annual and Seasonal Rainfall
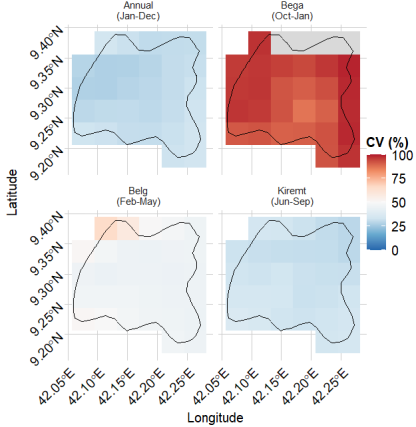
As shown in Figure 7, the CV values for Bega (dry) season exhibited the highest CV, reflecting its climatologically arid nature and the sporadic, unreliable occurrence of rainfall events. This high variability underscores the limited and erratic contribution of Bega rains, making it the least dependable season for any supplementary agricultural or pastoral activities. For Belg (short rains) season also displayed high variability (typically falling in the moderate-to-high CV range), indicating that rainfall during this period is less reliable than during the main rainy season. Belg rains are critical for early planting in some parts of Hareri region, yet their inconsistency poses risks to crop establishment and productivity. In contrast, Kiremt (main rainy) season and the annual totals showed comparatively lower CV values. Kiremt, which accounts for the bulk of annual precipitation in the region, benefits from more consistent large-scale atmospheric systems (e.g., the northward migration of the Inter-Tropical Convergence Zone), resulting in relatively stable rainfall amounts from year to year. Consequently, the annual CV remains moderated by the dominant influence of the Kiremt season.
These findings align with broader patterns documented across Hareri region, where dry (Bega) and short-rainy (Belg) seasons generally exhibit higher inter-annual variability than the main Kiremt season, while annual rainfall variability tends to be lower due to the stabilizing effect of the primary rainy period. In nearby areas such as Harar, annual CV values around 20% have been reported, placing the Harari Region within the moderate variability category overall
The annual rainfall CV follows a pattern similar to the Kiremt season, showing relatively lower variability compared to the Bega and Belg periods. This indicates that while seasonal fluctuations are significant, the total annual precipitation remains more stable due to the consistent contribution of the Kiremt rains.
Figure 7. Coefficient of variation (%) of seasonal (Bega, Belg, and Kiremt) and annual rainfall over the Harari Region.
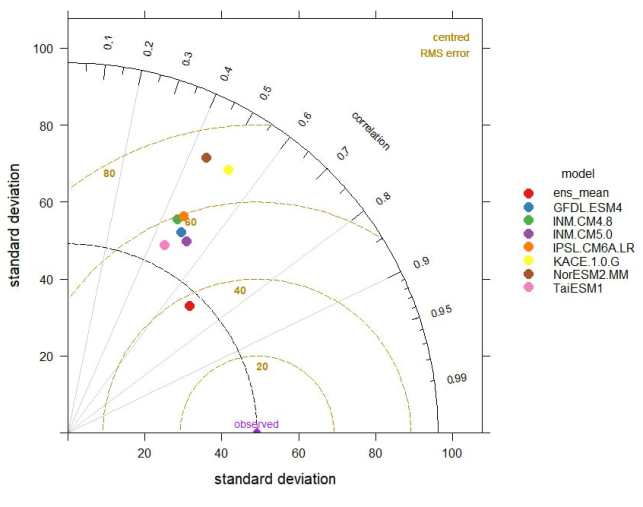
Table 7. Annual and Seasonal Coefficient of Variation (CV) of Rainfall over the Harari Region (1981-2022).

Season / Period

Mean Rainfall (mm)

Std. Dev. (mm)

CV (%)

Variability Class

Implication

Bega (Dry)

84.47

68.12

80.6

High

Highly unreliable

Belg (Short Rains)

254.46

112.35

44.2

High

Risky for early planting

Kiremt (Main Rains)

320.89

98.76

30.8

Moderate to High

Most stable season

Annual

659.82

135.4

20.5

Moderate

Suitable for rain-fed agriculture

Table 7 shows, the spatial distribution of CV indicates that eastern parts of the Harari Region generally experience higher inter-annual variability compared to the western highlands. These findings align with broader patterns documented across Ethiopia, where dry and short-rainy seasons exhibit greater variability than the main Kiremt season. The moderate annual CV (~20.5%) suggests that while seasonal fluctuations pose challenges, the overall annual rainfall remains sufficiently stable to support rain-fed agriculture when supplemented with appropriate adaptation measures.
3.3.2. Precipitation Concentration Index (PCI)
Table 8. Precipitation Concentration Index (PCI) for Annual and Seasonal Rainfall (1981-2022).

Season / Period

Months

Mean Seasonal Rainfall (mm)

PCI Value

Concentration Level

Implication for Agriculture

Bega (Dry)

Oct-Jan

84.47

38.02

High irregularity

Highly sporadic and unpredictable

Belg (Short Rains)

Feb-May

254.46

33.40

High irregularity

Unreliable for crop establishment

Kiremt (Main Rains)

Jun-Sep

320.89

26.58

Moderate irregularity

Most dependable distribution

Annual

Jan-Dec

659.82

11.88

Moderate concentration

Predictable at annual scale

Table 8 shows, the annual PCI of 11.88 indicates moderate concentration of rainfall across the year, reflecting the characteristic bimodal pattern of the Harari Region. However, seasonal PCI values reveal strong intra-seasonal contrasts. The Bega season exhibits the highest irregularity (PCI = 38.02), followed by the Belg season (PCI = 33.40). The Kiremt season shows relatively better rainfall distribution (PCI = 26.58), making it the most reliable period for agricultural activities. April and August were the largest contributors to the annual PCI, accounting for approximately 28.3% and 23.5% of the total squared monthly contributions, respectively. This underscores their dominant role in the regional water budget.
3.3.3. Integrated Interpretation of CV and PCI
The combined analysis of CV and PCI highlights the dual challenge of high inter-annual variability and significant seasonal concentration of rainfall in the Harari Region. While the moderate annual CV and PCI suggest reasonable overall predictability, the pronounced variability and irregularity in the Bega and Belg seasons pose substantial risks for rain-fed agriculture, particularly for smallholder farmers. These findings emphasize the need for climate-smart practices such as supplementary irrigation, drought-resistant crop varieties, and improved water harvesting techniques, especially in the more vulnerable eastern districts. The results are consistent with previous studies in eastern Ethiopia and provide high-resolution evidence to inform localized adaptation strategies under the Climate Resilient Green Economy (CRGE) framework.
3.4. Projection of Future Climate Changes (2041-2100)
For this study used Coupled Model Intercomparison Project Phase 6 (CMIP6) Earth System Models (ESMs) widely used for climate change projections, including simulations under different Shared Socioeconomic Pathways (SSPs) such as SSP1-2.6, SSP2-4.5, and SSP5-8.5. They simulate interactions among the atmosphere, ocean, land surface, sea ice, and biogeochemical cycles to project future climate conditions.
Table 9. CMIP6 Earth System Models (ESMs) Used in This Study, Their Full Names, and Modeling Institutions.

Model Abbreviation

Full Model Name

Modeling Center / Country

GFDL-ESM4

Geophysical Fluid Dynamics Laboratory Earth System Model Version 4

Geophysical Fluid Dynamics Laboratory (NOAA), USA

INM-CM4.8

Institute of Numerical Mathematics Climate Model Version 4.8

Institute of Numerical Mathematics, Russia

INM-CM5.0

Institute of Numerical Mathematics Climate Model Version 5.0

Institute of Numerical Mathematics, Russia

IPSL-CM6A-LR

Institut Pierre-Simon Laplace Climate Model Version 6A – Low Resolution

Institut Pierre-Simon Laplace, France

KACE-1-0-G

Korea Atmospheric Community Earth System Model Version 1.0 – Global

National Institute of Meteorological Sciences, South Korea

NorESM2-MM

Norwegian Earth System Model Version 2 – Medium Resolution

Norwegian Climate Centre, Norway

TaiESM1

Taiwan Earth System Model Version 1

Research Center for Environmental Changes, Taiwan

According to different scholar’s different climate model under ssp scenario are recommended for east Africa especially Ethiopia and they are recommended ensemble one is better for capturing of the climate trend and extreme events on seasonal or annual based . Based on this the ensemble model is used for the analysis. The performance of each model as shown in Figure 8 and 9.
Figure 8. Model Evaluation Taylor Diagram (Standard Deviation vs. Correlation).
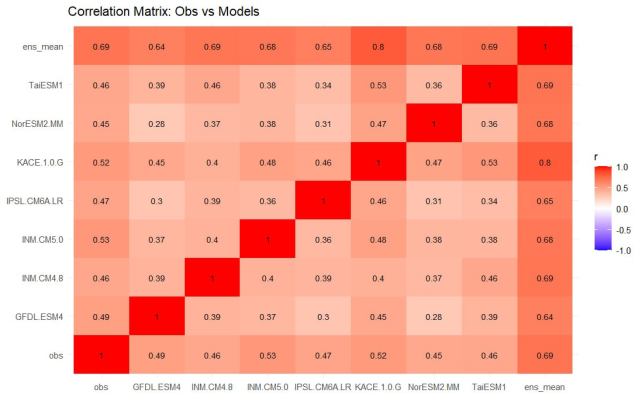
Figure 9. Correlation Matrix: Obs vs Models.
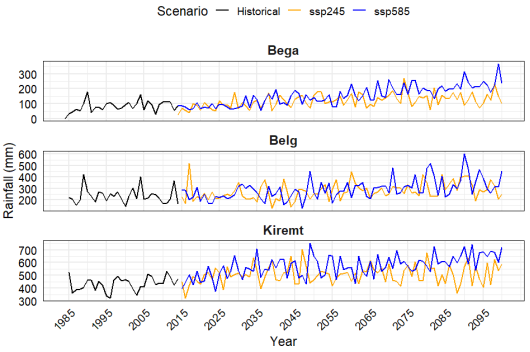
Table 10. Model Validation Statistical Metrics (RMSE, PBIAS%, r, R2, NSE, KGE).

Column1

RMSE

PBIAS%

r

R2

NSE

KGE

GFDL.ESM4

55.87

-6.2

0.49

-0.3

-0.3

0.44

INM.CM4.8

59.23

6.5

0.46

-0.46

-0.46

0.39

INM.CM5.0

52.9

-0.2

0.53

-0.16

-0.16

0.49

IPSL.CM6A.LR

59.37

5.1

0.47

-0.46

-0.46

0.39

KACE.1.0.G

68.69

0.7

0.52

-0.96

-0.96

0.21

NorESM2.MM

72.59

3

0.45

-1.19

-1.19

0.16

TaiESM1

54.64

-9.9

0.46

-0.24

-0.24

0.44

ens_mean

37.33

-0.1

0.69

0.42

0.42

0.68

3.4.1. Rainfall Projections
An ensemble of CMIP6 global climate models was employed to project future rainfall patterns over the study region under the SSP2-4.5 (medium-emission) and SSP5-8.5 (high-emission) scenarios. This approach follows recommendations from recent studies emphasizing the superiority of multi-model ensembles for capturing both mean climate trends and extreme events in Ethiopia, particularly Harer region.
(i). Seasonal Rainfall Trends
Figure 10, presents the projected seasonal rainfall trends for the Bega (October-January), Belg (February-May), and Kiremt (June-September) seasons under the SSP2-4.5 and SSP5-8.5 scenarios relative to the historical period (1985-2014). Overall, the ensemble projections indicate increasing seasonal rainfall across all three seasons throughout the twenty-first century, although the magnitude of change differs among seasons and emission scenarios.
The Bega season, historically the driest season in the Harari Region, exhibits a gradual increase in rainfall under both scenarios. The increase is relatively modest under SSP2-4.5 but becomes more pronounced under SSP5-8.5, particularly after the mid-century period. This finding suggests that dry-season rainfall may become more frequent, potentially reducing drought severity and improving soil moisture availability. However, increased rainfall during the traditionally dry season could also alter agricultural calendars and increase the occurrence of unseasonal rainfall events.
Belg rainfall also demonstrates a positive trend under both scenarios, with stronger increases under SSP5-8.5. Despite the projected increase in seasonal totals, substantial year-to-year variability remains evident. This indicates that although moisture availability during the Belg season may improve, rainfall onset and distribution are likely to remain highly variable, maintaining uncertainty for farmers who depend on early-season rainfall for crop establishment.
The Kiremt season continues to contribute the largest proportion of annual rainfall and shows the greatest projected increase among all seasons. Rainfall increases steadily under SSP2-4.5 but rises more rapidly under SSP5-8.5 during the second half of the century. The projected intensification of Kiremt rainfall could enhance surface water resources and agricultural production; however, it may simultaneously increase the likelihood of floods, soil erosion, and waterlogging, particularly in vulnerable catchments.
Overall, Figure 10 indicates a future shift toward wetter seasonal conditions in the Harari Region, especially under the high-emission pathway. Nevertheless, persistent interannual variability suggests that both droughts and excessive rainfall events will continue to occur, emphasizing the need for climate-smart agricultural planning, improved seasonal forecasting, and adaptive water resource management.
Figure 10. Projected trends in Seasonal rainfall.
(ii). Annual Rainfall Trends
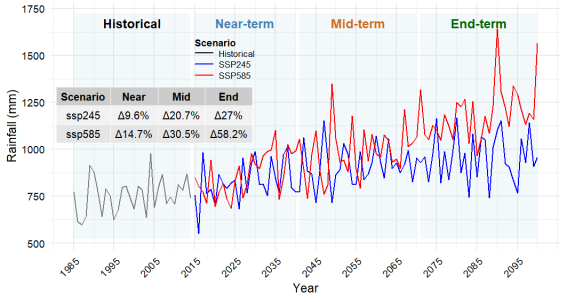
Figure 11, illustrates the projected annual rainfall totals under SSP2-4.5 and SSP5-8.5 scenarios. Both scenarios indicate a long-term increasing trend in annual rainfall compared with the historical climate, although the increase is substantially larger under SSP5-8.5.
The ensemble projections suggest relatively moderate increases during the near-term period, followed by accelerated rainfall increases after approximately 2050 under the high-emission scenario. According to the ensemble statistics presented in the figure, annual rainfall is projected to increase by approximately 9.6%, 20.7%, and 42.7% during the near-, mid-, and end-century periods under SSP2-4.5. Under SSP5-8.5, the corresponding increases reach approximately 14.7%, 30.5%, and 58.2%, demonstrating the strong influence of greenhouse gas emissions on future hydrological conditions.
Despite the increasing trend, annual rainfall exhibits considerable interannual fluctuations throughout the projection period. Several years show rainfall considerably above or below the long-term mean, particularly under SSP5-8.5. This persistent variability suggests that extreme wet years and occasional dry years are likely to remain characteristic features of the regional climate.
The projected increase in annual rainfall could provide opportunities for improved agricultural productivity, groundwater recharge, and reservoir storage. However, higher rainfall intensity and variability may also increase the frequency of flash floods, erosion, and infrastructure damage. Consequently, future adaptation strategies should focus not only on utilizing increased water availability but also on strengthening flood management and climate risk reduction.
Figure 11. Projected trends in annual rainfall.
3.4.2. Temperature Projections
(i). Maximum temperature projection
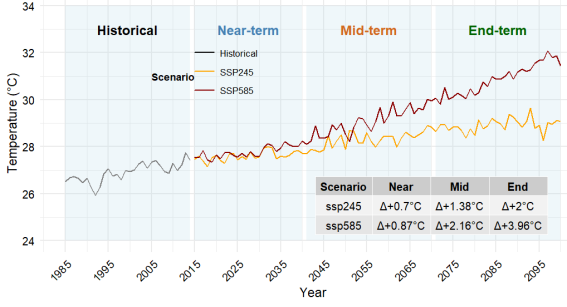
Figure 12, shows projected annual maximum temperature under the two future emission scenarios. Maximum temperature exhibits a consistent warming trend throughout the twenty-first century under both SSP2-4.5 and SSP5-8.5, with warming becoming progressively stronger toward the end of the century.
The ensemble statistics indicate that maximum temperature increases by approximately 0.7°C, 1.38°C, and 2.0°C during the near-, mid-, and end-century periods under SSP2-4.5. Under SSP5-8.5, warming reaches approximately 0.87°C, 2.16°C, and 3.96°C, indicating nearly twice the warming by the end of the century compared with the medium-emission scenario.
The divergence between the two scenarios becomes increasingly evident after the middle of the century, reflecting the growing influence of greenhouse gas concentrations under the high-emission pathway. Elevated maximum temperatures are expected to increase evapotranspiration rates, intensify heat stress on crops and livestock, and raise irrigation water requirements. Furthermore, more frequent and intense hot days could reduce agricultural productivity and increase risks to human health.
These findings emphasize that limiting greenhouse gas emissions could substantially reduce future heat exposure and associated socioeconomic impacts in the Harari Region.
Figure 12. Projected trends in annual maximum temperature.
(ii). Minimum Temperature Projection
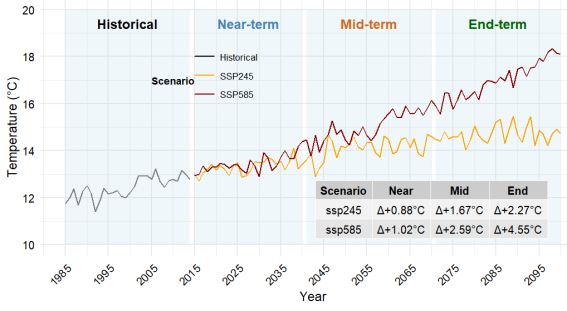
Figure 13 presents projected annual minimum temperature under SSP2-4.5 and SSP5-8.5. Similar to maximum temperature, minimum temperature increases continuously throughout the projection period, although warming is even more pronounced under the high-emission scenario.
Projected minimum temperature increases are approximately 0.88°C, 1.67°C, and 2.27°C for SSP2-4.5 during the near-, mid-, and end-century periods, respectively. Under SSP5-8.5, projected warming reaches approximately 1.02°C, 2.59°C, and 4.55°C.
Figure 13. Projected trends in annual minimum temperature.
(iii). Mean Temperature Projections
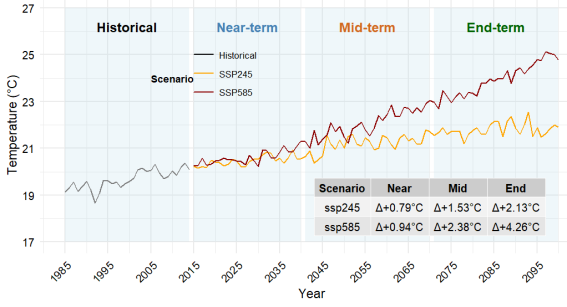
Figure 14 illustrates projected annual mean temperature changes under SSP2-4.5 and SSP5-8.5. Mean temperature increases steadily throughout the century under both scenarios, confirming a robust warming signal across the Harari Region.
The projected increases are approximately 0.7°C, 1.5°C, and 2.1°C under SSP2-4.5 and 0.9°C, 2.3°C, and 4.2°C under SSP5-8.5 during the near-, mid-, and end-century periods, respectively. The warming rate accelerates after approximately 2050 under the high-emission pathway, leading to substantially higher temperatures by the end of the century.
Increasing mean temperature, combined with projected increases in rainfall, suggests that the future climate of the Harari Region will become warmer and wetter. However, higher temperatures will increase potential evapotranspiration, partially offsetting the benefits of increased rainfall. Consequently, crop water demand, irrigation requirements, and drought vulnerability during rainfall deficits may increase despite the projected rise in annual precipitation.
Overall, the projected warming poses significant challenges for agriculture, water resources, ecosystem functioning, and public health. These findings underscore the need for climate adaptation strategies such as drought- and heat-tolerant crop varieties, improved water-use efficiency, enhanced climate services, and integrated water resource management.
Figure 14. Projected trends in annual mean temperature.

4. Conclusion and Recommendation
4.1. Conclusions
This study provides a comprehensive assessment of historical and projected climate variability and change across the Harari Region using high-resolution observational datasets and CMIP6 multi-model projections. Historical analyses reveal statistically significant warming in maximum, minimum, and mean temperatures across most months, while rainfall exhibits strong seasonal variability with declining trends during parts of the Belg season but relatively stable annual totals. Spatial analyses demonstrate pronounced climatic gradients driven by topography, with the western highlands receiving greater rainfall and experiencing lower temperatures than the eastern lowlands.
Climate variability analysis indicates that the Bega and Belg seasons are characterized by high interannual variability and irregular rainfall distribution, whereas the Kiremt season remains the most dependable source of annual precipitation. Future climate projections consistently indicate a warmer climate throughout the twenty-first century under both SSP2-4.5 and SSP5-8.5 scenarios, with substantially greater warming under the high-emission pathway. Rainfall is projected to increase overall; however, persistent year-to-year variability suggests that both droughts and extreme rainfall events will remain important climate risks.
Overall, the findings suggest that although increased rainfall may improve water availability, rising temperatures and greater climate variability could intensify heat stress, flooding, soil erosion, and agricultural production risks. The study provides robust scientific evidence to support localized climate adaptation planning and contributes valuable baseline information for sustainable development and climate resilience in Hareri region.
4.2. Recommendations
Based on these findings, the following actions are recommended to enhance regional resilience:
1) Implement targeted soil and water conservation measures in the western highlands to handle the projected increases in Kiremt rainfall and mitigate flood risks and soil erosion.
2) Develop supplementary irrigation networks in the eastern lowlands (e.g., Sofi and Erer-Harari woredas) to counter high temperature trends and moderate rainfall levels.
3) Due to the high variability (CV) projected for the Belg season, extension services should promote early-maturing, drought-tolerant crop varieties and flexible planting schedules to manage unpredictable seasonal onsets.
4) Incorporate these high-resolution climate projections and identified hotspots into the Harari Region's Climate Resilient Green Economy (CRGE) updates to support long-term urban and agricultural planning.
5) Future research should investigate projected changes in climate extremes, drought and flood characteristics, agricultural productivity, water resources, and socioeconomic vulnerability using high-resolution regional climate models and impact assessment frameworks.
Abbreviations

BCSD

Bias Correction Spatial Disaggregation

CMIP6

The Coupled Model Intercomparison Project Phase 6

CRGE

Climate Resilient Green Economy

CV

Coefficient of Variation

EMI

Meteorological Institute

ENACTS

Enhancing National Climate Services

ENSO

El Niño-Southern Oscillation

GCMs

Global Climate Models GCMs

IOD

Indian Ocean Dipole

KGE

Kling–Gupta Efficiency

MK

Modified Mann-Kendall

NSE

Nash–Sutcliffe Efficiency

PBIAS (%)

Percentage Bias

PCT

Precipitation Concentration Index

RMSE

Root Mean Square Error

SSPs

Socioeconomic Pathways

Acknowledgments
The authors extend their deepest gratitude to the Ethiopian Meteorological Institute (EMI) for generously providing the historical station-based climate data and Enhancing National Climate Services (ENACTS) data for the Harari Region. Their continuous support and data sharing were fundamental to the successful completion of this study.
Special thanks are due to the World Climate Research Programme (WCRP) and all modeling groups contributing to the Coupled Model Intercomparison Project Phase 6 (CMIP6) for making future climate projections publicly available.
Author Contributions
Yimer Assefa Yimam: Conceptualization, Data curation, Formal Analysis, Investigation, Methodology, Resources, Software, Validation, Visualization, Writing – original draft, Writing – review & editing
Melaku Takele Tegene: Data curation, Formal Analysis, Methodology, Software, Validation, Visualization, Writing – review & editing
Data Availability Statement
Datasets and code are available upon reasonable request from the corresponding author.
Conflicts of Interest
The authors declare no conflict of interest.
References
[1] Berhanu, D., et al. (2025). Evaluation of CMIP6 models in simulating seasonal extreme precipitation over Ethiopia. Weather and Climate Extremes, 47, 100752.
[2] Chanie, F. M. (2026). Evaluation of CMIP6 model performance and future climate projections over the Genale Dawa River Basin, Ethiopia. Scientific Reports, 16, 361.
[3] Conway, D., & Schipper, E. L. F. (2011). Adaptation to climate change in Africa: Challenges and opportunities. Environmental Science & Policy, 14(1), 1-5.
[4] Conway, D. (2004). The climate and hydrology of the Upper Blue Nile River. The Geographical Journal, 170(1), 49-62.
[5] Dinku, T., Funk, C., Peterson, P., Maidment, R., Tadesse, T., Gadain, H., & Ceccato, P. (2018). Validation of the Enhancing National Climate Services (ENACTS) gridded rainfall and temperature products over Africa. Climate Services, 13, 1-12.
[6] Diro, G. T., Grimes, D. I. F., & Black, E. (2011). Teleconnections between Ethiopian summer rainfall and global sea surface temperatures. International Journal of Climatology, 31(3), 477-488.
[7] Eyring, V., Bony, S., Meehl, G. A., Senior, C. A., Stevens, B., Stouffer, R. J., & Taylor, K. E. (2016). Overview of the Coupled Model Intercomparison Project Phase 6 (CMIP6) experimental design and organization. Geoscientific Model Development, 9(5), 1937-1958.
[8] Funk, C., Peterson, P., Landsfeld, M., et al. (2015). The climate hazards infrared precipitation with stations—a new environmental record for monitoring extremes. Scientific Data, 2, 150066.
[9] Gebrechorkos, S. H., Hülsmann, S., & Bernhofer, C. (2019). Changes in temperature and precipitation extremes in Ethiopia. International Journal of Climatology, 39(1), 18-30.
[10] Hare, F. K. (1983). Climate and desertification. In M. H. Glantz (Ed.), Drought and hunger in Africa: Denying famine a future (pp. 23-31). Cambridge University Press.
[11] IPCC. (2021). Climate Change 2021: The Physical Science Basis. Cambridge University Press.
[12] IPCC. (2022). Climate Change 2022: Impacts, Adaptation and Vulnerability. Cambridge University Press.
[13] IPCC. (2023). Climate Change 2023: Synthesis Report. IPCC.
[14] Jury, M. R., & Funk, C. (2013). Climatic trends over Ethiopia: Regional signals and drivers. Climate Dynamics, 41(7-8), 1921-1935.
[15] Kendall, M. G. (1975). Rank Correlation Methods (4th ed.). Charles Griffin.
[16] Korecha, D., & Barnston, A. G. (2007). Predictability of June-September rainfall in Ethiopia. Journal of Climate, 20(4), 628-642.
[17] Mann, H. B. (1945). Nonparametric tests against trend. Econometrica, 13(3), 245-259.
[18] Mekasha, A., Tesfaye, K., & Duncan, A. J. (2014). Trends in daily observed temperature and precipitation extremes over three Ethiopian eco-environments. International Journal of Climatology, 34(6), 1990-1999.
[19] Mengistu, A. G., et al. (2025). Future climate and hydrological extremes in Ethiopia: A CMIP6-based analysis. Advances in Meteorology, 2025, Article 5571487.
[20] National Meteorological Agency (NMA). (2007). Climate Change National Adaptation Programme of Action (NAPA) of Ethiopia. Addis Ababa, Ethiopia.
[21] O'Neill, B. C., Tebaldi, C., van Vuuren, D. P., et al. (2016). The Scenario Model Intercomparison Project (ScenarioMIP) for CMIP6. Geoscientific Model Development, 9, 3461-3482.
[22] Oliver, J. E. (1980). Monthly precipitation distribution: A comparative index. The Professional Geographer, 32(3), 300-309.
[23] Sen, P. K. (1968). Estimates of the regression coefficient based on Kendall's tau. Journal of the American Statistical Association, 63(324), 1379-1389.
[24] Setegn, S. G., Rayner, D., Melesse, A. M., Dargahi, B., & Srinivasan, R. (2011). Impact of climate change on the hydroclimatology of the Lake Tana Basin, Ethiopia. Hydrological Processes, 25(9), 1375-1389.
[25] Wood, A. W., Leung, L. R., Sridhar, V., & Lettenmaier, D. P. (2004). Hydrologic implications of dynamical and statistical approaches to downscaling climate model outputs. Climatic Change, 62(1-3), 189-216.
Cite This Article
  • APA Style

    Yimam, Y. A., Tegene, M. T. (2026). Spatiotemporal Patterns and Projected Changes in Rainfall and Temperature Over the Harari Region, Ethiopia. Science Discovery Environment, 1(4), 194-214. https://doi.org/10.11648/j.sdenv.20260104.13

    Copy | Download

    ACS Style

    Yimam, Y. A.; Tegene, M. T. Spatiotemporal Patterns and Projected Changes in Rainfall and Temperature Over the Harari Region, Ethiopia. Sci. Discov. Environ. 2026, 1(4), 194-214. doi: 10.11648/j.sdenv.20260104.13

    Copy | Download

    AMA Style

    Yimam YA, Tegene MT. Spatiotemporal Patterns and Projected Changes in Rainfall and Temperature Over the Harari Region, Ethiopia. Sci Discov Environ. 2026;1(4):194-214. doi: 10.11648/j.sdenv.20260104.13

    Copy | Download

  • @article{10.11648/j.sdenv.20260104.13,
      author = {Yimer Assefa Yimam and Melaku Takele Tegene},
      title = {Spatiotemporal Patterns and Projected Changes in Rainfall and Temperature Over the Harari Region, Ethiopia},
      journal = {Science Discovery Environment},
      volume = {1},
      number = {4},
      pages = {194-214},
      doi = {10.11648/j.sdenv.20260104.13},
      url = {https://doi.org/10.11648/j.sdenv.20260104.13},
      eprint = {https://article.sciencepublishinggroup.com/pdf/10.11648.j.sdenv.20260104.13},
      abstract = {Climate variability and climate change pose major challenges to sustainable development in Ethiopia, particularly in regions that depend heavily on rain-fed agriculture. This study investigated the historical (1985-2025) and projected (2041-2100) spatiotemporal variability of rainfall and temperature across the Harari Region using high-resolution observational datasets (Ethiopian Meteorological Institute (EMI), obtained through the Enhancing National Climate Services (ENACTS) dataset rainfall and temperature) together with statistically downscaled CMIP6 multi-model ensembles under the SSP2-4.5 and SSP5-8.5 scenarios. Historical trends were evaluated using the Modified Mann-Kendall test and Sen's slope estimator, while rainfall variability was characterized using the Coefficient of Variation (CV) and Precipitation Concentration Index (PCI). Results indicate significant warming trends in maximum, minimum, and mean temperatures throughout most months of the historical period. Rainfall exhibited pronounced seasonal variability, with significant decreases during February, March, April, and December, while annual rainfall remained moderately variable (CV = 20.5%) with moderate rainfall concentration (PCI = 11.88). Spatial analyses revealed higher rainfall and lower temperatures over the western highlands and warmer, relatively drier conditions in the eastern lowlands. Future CMIP6 projections indicate continued warming under both emission scenarios, with substantially greater increases under SSP5-8.5. Annual rainfall is projected to increase by approximately 9.6-42.7% under SSP2-4.5 and 14.7-58.2% under SSP5-8.5, although considerable interannual variability persists. The projected warmer and generally wetter climate may enhance water availability but simultaneously increase the risks of floods, soil erosion, heat stress, and agricultural uncertainty. The findings provide high-resolution climate information that can support evidence-based adaptation planning, climate-resilient agriculture, and integrated water resource management in the Harari Region.},
     year = {2026}
    }
    

    Copy | Download

  • TY  - JOUR
    T1  - Spatiotemporal Patterns and Projected Changes in Rainfall and Temperature Over the Harari Region, Ethiopia
    AU  - Yimer Assefa Yimam
    AU  - Melaku Takele Tegene
    Y1  - 2026/10/31
    PY  - 2026
    N1  - https://doi.org/10.11648/j.sdenv.20260104.13
    DO  - 10.11648/j.sdenv.20260104.13
    T2  - Science Discovery Environment
    JF  - Science Discovery Environment
    JO  - Science Discovery Environment
    SP  - 194
    EP  - 214
    PB  - Science Publishing Group
    SN  - 3071-5431
    UR  - https://doi.org/10.11648/j.sdenv.20260104.13
    AB  - Climate variability and climate change pose major challenges to sustainable development in Ethiopia, particularly in regions that depend heavily on rain-fed agriculture. This study investigated the historical (1985-2025) and projected (2041-2100) spatiotemporal variability of rainfall and temperature across the Harari Region using high-resolution observational datasets (Ethiopian Meteorological Institute (EMI), obtained through the Enhancing National Climate Services (ENACTS) dataset rainfall and temperature) together with statistically downscaled CMIP6 multi-model ensembles under the SSP2-4.5 and SSP5-8.5 scenarios. Historical trends were evaluated using the Modified Mann-Kendall test and Sen's slope estimator, while rainfall variability was characterized using the Coefficient of Variation (CV) and Precipitation Concentration Index (PCI). Results indicate significant warming trends in maximum, minimum, and mean temperatures throughout most months of the historical period. Rainfall exhibited pronounced seasonal variability, with significant decreases during February, March, April, and December, while annual rainfall remained moderately variable (CV = 20.5%) with moderate rainfall concentration (PCI = 11.88). Spatial analyses revealed higher rainfall and lower temperatures over the western highlands and warmer, relatively drier conditions in the eastern lowlands. Future CMIP6 projections indicate continued warming under both emission scenarios, with substantially greater increases under SSP5-8.5. Annual rainfall is projected to increase by approximately 9.6-42.7% under SSP2-4.5 and 14.7-58.2% under SSP5-8.5, although considerable interannual variability persists. The projected warmer and generally wetter climate may enhance water availability but simultaneously increase the risks of floods, soil erosion, heat stress, and agricultural uncertainty. The findings provide high-resolution climate information that can support evidence-based adaptation planning, climate-resilient agriculture, and integrated water resource management in the Harari Region.
    VL  - 1
    IS  - 4
    ER  - 

    Copy | Download

Author Information
  • Abstract
  • Keywords
  • Document Sections

    1. 1. Introduction
    2. 2. Data and Methodology
    3. 3. Result and Discussion
    4. 4. Conclusion and Recommendation
    Show Full Outline
  • Abbreviations
  • Acknowledgments
  • Author Contributions
  • Data Availability Statement
  • Conflicts of Interest
  • References
  • Cite This Article
  • Author Information