Research Article | | Peer-Reviewed

Phenolic Compounds of Mareya Micrantha (Benth.) Mull. Arg. and Their Antioxidant Activity

Received: 5 October 2026     Accepted: 19 October 2026     Published: 31 October 2026
Views:       Downloads:
Abstract

Mareya Micrantha Is a West African Medicinal Plant Endowed with Numerous Therapeutic Properties. It Was Characterized by a High Content of Steroidal Derivatives Such as Cucurbitacins (C-30) and Nor-cucurbitacins (C-29). A Phytochemical Study Was Conducted on Its Phenolic Composition and the Antioxidant Activity of These Compounds. To Carry Out This Investigation, Solid-liquid Extraction, Liquid-liquid Fractionation, Chromatographic Column Isolations, and Compound Characterization Were Performed. The Phenolic Compounds Were Identified Using HPLC-UV-DAD Method, and Their Concentrations Were Determined Using Colorimetric Assays and HPLC-UV Method. Isolated Compounds Structures Were Determined by Spectroscopic Analysis (UV, IR, MS, and NMR). Antioxidant Activities Were Evaluated Using Two Different Tests (DPPH and CUPRAC). This Study Led to the Isolation of Amentoflavone and Astragalin Two Known Flavonoids and Two Original Phenolic Compounds Including an Isocoumarin Named Micranthin Acid and a Hydrolysable Tannin Named Mareyanin. This Is the First Descriptive Study of Phenolic Compounds from Mareya Micrantha. Both Original Compounds Showed Greater Antioxidant Activity Than Trolox. These Compounds Are Present in High Concentrations in Extracts from the Leaves of This Plant. They Could Be Considered as the Most Potent Antioxidant and Major Phenolic Compounds of Mareya Micrantha. The Isolated Phenolic Compounds Exhibited Greater Activity Than the Previously Isolated Steroidal Derivatives.

Published in Science Journal of Chemistry (Volume 14, Issue 5)
DOI 10.11648/j.sjc.20261405.14
Page(s) 176-188
Creative Commons

This is an Open Access article, distributed under the terms of the Creative Commons Attribution 4.0 International License (http://creativecommons.org/licenses/by/4.0/), which permits unrestricted use, distribution and reproduction in any medium or format, provided the original work is properly cited.

Copyright

Copyright © The Author(s), 2026. Published by Science Publishing Group

Keywords

Mareya Micrantha, Phenolic Compounds, Flavonoids, Tannins, Isocoumarins, Antioxidant

1. Introduction
Identification of new antioxidant agents is still a big challenge worldwide for their multiple application in food industry, cosmetic and pharmacy as oxidative processes are involved in many human pathologies . Actually, under physiological or psychological stress, the human body produces Reactive Oxygen Species such as Superoxide anions, Hydroxyl radicals, and Hydrogen peroxide which can contribute to the pathogenesis of severe diseases, including cancer . The production of these harmful compounds can be limited by antioxidants compounds derived from medicinal plants . Numerous plants are renowned for their antioxidant properties and their therapeutic efficacy against various diseases. A prime example is Mareya micrantha (Benth.) Müll. Arg, a species recognized for its antioxidant activity, which has nonetheless received limited phytochemical investigation. This plant is widely utilized in traditional West African medicine. In a preliminary study, phytochemical screening led to the isolation of steroid terpenoid derivatives, specifically cucurbitacins and nor-cucurbitacins . These compounds have demonstrated significant antioxidant potential as well as antiproliferative activity against hepatocellular carcinoma . Among plant metabolites, Phenolic compounds belong to a chemical class whose antioxidant properties are well documented in the literature . Therefore, a study was conducted to investigate on phenolic compounds derived from M. micrantha and their antioxidant activity. This study led to identify two original phenolic compounds, whose both chemical and biological characteristics are described here.
2. Materials and Methods
2.1. Material
2.1.1. Plant Material
Leaves of Mareya micrantha were collected in December 2023 from Guezem (6°15′31.68″N, 6°11′35.99″W), Ivory Coast. Botanical identification and authentication were performed by Prof. Joseph Ipou Ipou at the Herbarium of the National Floristic Center, Félix Houphouët-Boigny University (Ivory Coast), by comparison with the historical voucher spe-cimen (No. 8.482, collected on January 23, 1966, by L. Aké Assi) deposited in the facility. The collected leaves were shade-dried in the laboratory at 25°C for four weeks and subsequently pulverized to a particle size of 250 μm using an electric ball grinder.
2.1.2. Experimental Material
Column chromatography (CC) was performed using silica gel (Merck, 70-230 mesh) and Sephadex® LH-20 (GE Healthcare). FT-IR (ATR) spectra were recorded on a Perkin Elmer Spectrum 65 FT-IR spectrometer. 1D and 2D NMR spectra were acquired in CD3OD at 500 MHz for 1H and 125 MHz for 13C using a Bruker Avance 500 spectrometer equipped with a 5 mm TCI cryoprobe. Chemical shifts δ are reported in ppm and coupling constants J are given in Hz.
LC-UV (DAD) profiles were obtained on a Thermo Fisher Ultimate 3000 system equipped with a photodiode array detector (DAD) using a Phenomenex Luna C18 3µ PFP (2) 100 Å (150 × 3.0 mm) column. LC-HRMS analyses were performed on a UHPLC-DAD-QTOF instrument consisting of an ACQUITY UPLC system coupled to a Xevo G2 QTof mass spectrometer (Waters, MA, USA) equipped with an electrospray ionization (ESI) source operating in negative mode. Chromatographic separation was achieved on a UPLC BEH C18 column (100 × 2.1 mm, 1.7 μm, Waters).
2.2. Methods
2.2.1. Extract and Fractions Preparation
The leaf powder (1,000 g) was subjected to maceration extraction (m/v, 1/5) three times (3 x 24h) in the solvent mixture ethanol/water (70: 30, v/v, 15 L). After filtration on WATMANN papers, the extracts were concentrated under reduced pressure using a Rotary evaporator at 40°C to yield the crude hydroethanolic extracts, designated as FM0. The resulting extract was dissolved in 500 mL of distilled water and subsequently subjected to liquid-liquid extraction using hexane (3 × 500 mL) followed by ethyl acetate (4 × 400 mL). Upon evaporation to dryness, the hexane fraction (FM1) and the ethyl acetate fraction (FM2) were obtained. The residual aqueous phase was lyophilized to yield the aqueous extract (FM3).
2.2.2. Total Polyphenols Content
The total polyphenols content was measured according by Folin-Ciocalteu method with some modifications . To 100 µL of extract (1000 mg/L, in MeOH) in a tube were added successively 900 µL of demineralized water, 900 µL of Folin-Ciocalteu reagent (1N), then 200 µL of sodium carbonate (Na2CO3 at 20%). The tubes containing the mixtures are incubated (25°C, 30 min) in the dark. A calibration curve was obtained based on Gallic acid (0-100 µg/mL) as standard, prepared under the same conditions described above. The absorbance of sample was measured with a spectrophotometer (Shimadzu UV-1800) at 760 nm against a methanol used as a blank. The total phenolic content was expressed in milligrams of Gallic acid equivalent per gram of extract (mg. GAE/g dry extract).
2.2.3. Total Flavonoids Content
The total flavonoids content was measured according to the method of Zhishen with slight modifications . To 250 µL of extract (1000 mg/L, in MeOH) in a tube, was added 1 mL of demineralized water. Then, at t0 (0 min), 75 µL of NaNO2 solution (5%) was added; at t1 (5 min), 75 µL of AlCl3 solution (10%); at t2 (10 min), 500 µL of NaOH (1N). Finally, the mixture was completed with 2.5 mL of demineralized water and stirred vigorously. Calibration curve was obtained based on Rutin (0-100 µg/mL) as standard, prepared under the same conditions described above. The absorbance of the sample was measured at 510 nm against a methanol used as a blank. The total flavonoid content was expressed in milligram Rutin equivalent per gram of extract (mg. RE / g dry extract).
2.2.4. Total Hydrolysable Tannins
The total hydrolysable tannins content was measured according to Mole method with some modifications . Separately 5 mL of extract (1000 mg/L, H2O) were introduced into two different test tubes (T1 and T2). Two drops of NaOH (4M) are added to test tube T1. This tube is placed in a boiling water bath for 2 h. It was then cooled and the content was neutralized by adding two drops of HCl (4M). At t0 (0 min), to 500 µl of each tube (T1 and T2), were added 3.5 ml of the ferric chloride solution (1.62 g of FeC13 dissolved in 0.001 M of HCl to give a volume of 1 L). Calibration curve was obtained based on Tannic acid (0-1.2 µg/mL) as standard, prepared under the same conditions described above. Test tubes were shaken and their absorbance were read at 660 nm, against a blank consisting only of the reagents. The total hydrolysable tannin content was expressed in milligram Tannic acid equivalent per gram of extract (mg. TAE / g dry extract).
2.2.5. Isolation of Compounds
Only the ethyl acetate fraction FM2 was fractionated. To be done 9 g of FM2 were dissolved in a hexane/ethyl acetate mixture (3: 7, v/v, 30 mL) under heat (80°C) and then left to stand (25°C) during three hours. A precipitate and a supernatant were formed, then separated into two parts: a liquid phase and an amorphous solid phase. Fraction FM2-1 (5 g) was obtained by evaporating the solvent from the liquid phase, whereas FM2-2 (3 g) was isolated after drying the amorphous phase. A portion of FM2-1 (4 g) was then subjected to silica gel column chromatography (220 g, 27 × 5.1 cm). Elution was performed using a gradient system of solvent C (ethyl acetate) and solvent D (acetone/ethanol/water, 6: 3: 1, v/v/v), variation from 100: 0 to 60: 40 (v/v) at a flow rate of 20 mL/min, to yield sub-fractions FM2-1.1 (60 mL: Tubes 5-8) and FM2-1.2 (20 mL: Tubes 9-10). A sample of FM2-1.1 (0.75 g) was purified by silica gel column chromatography (100 g; column dimensions: 17.5 × 3.5 cm), using gradient system C/D ranging from 90: 10 to 70: 30 (v/v) at a flow rate of 10 mL/min. The resulting fractions were further purified by gel filtration chromatography on a Sephadex® LH20 column (35 g; column dimensions: 12 × 3 cm), eluting with a mixture of methanol and methylene chloride (70: 30, v/v) at a flow rate of 5 mL/min. This led to purified compounds 1 (17 mg) and 2 (20 mg). A sample of subfraction FM2-1.2 (2.5 g) was chromatographed under the same conditions as FM2-1.1, yielding purified compound 3 (8 mg). As for FM2-2, 500 mg of this fraction was washed with ethyl acetate to remove impurities and then purified on Sephadex® LH20 column (35 g; column dimensions: 12 × 3 cm) to give compound 4 (80 mg).
Compound 1: Yellow amorphous powder,  [α]D30,7 = +47 (C: 0.45, MeOH), UV λmax: 209, 268 and 336 nm, FT-IR (ATR): νmax 3200, 1643, 1600, 1564 cm-1. For 1H NMR (CD3OD, 500 MHz) and 13C NMR (CD3OD, 125 MHz) see spectral data, HR-ESI-MS 1:  [M-H]-m/z 537.0822 (Calc. for C30H18O10, 538.0900).
Compound 2: Yellow amorphous powder,  [α]D30.4 = +29 (C: 0.4, MeOH), UV λmax: 203, 264 and 347 nm, FT-IR (ATR): νmax 3356, 1655 and 1598 cm-1. For 1H NMR ((CD3)2CO, 300 MHz) and 13C NMR ((CD3)2CO, 75 MHz) see spectral data, HR-ESI-MS 2:  [M-H]- m/z 447.0927 (Calc. for C21H20O11, 448.1005).
Compound 3: Yellow-orange amorphous powder,  [α]D29,8 = +50 (C: 0.4, MeOH), UV λmax: 270-287 and 357 nm, FT-IR (ATR): νmax 3250, 1666, 1584 cm-1. For 1H NMR (CD3OD, 500 MHz) and 13C NMR (CD3OD, 125 MHz) spectral data, see Table 2, HR-ESI-MS 3:  [M-H]- m/z 291,0141 (Calc. for C13H8O8, 292.0219).
Compound 4: Yellow amorphous powder,  [α]D29,3=+48 (C: 0.06, MeOH), UV λmax: 225, 268 nm; FT-IR (ATR): νmax 3270, 1607 and 1513 cm-1. For 1H NMR (CD3OD, 500 MHz) and 13C NMR (CD3OD, 125 MHz) spectral data, see Table 3, HR-ESI-MS 4:  [M-H]- m/z 799.0630 (Calc. for C34H24O23, 800.0708).
2.3. Antioxidant Activity
2.3.1. Copper Ion Reduction Assay
CUPRAC-BCS method was performed according to Campos method with some modifications . The reaction mixture consisted of 40 µL of samples, 160 µL of bathocuproinedisulfonic acid BCS solution (4.2 mg in 30 mL of distilled water) and 50 µL of CuSO4 solution (18.7 mg in 30 mL of distilled water). Fifteen minutes after mixing the reagents, 50 µL of EDTA (43.8 mg in 30 mL of distilled water) was added to stop the reaction. The blank was obtained from ethanol processed under the same conditions described above. The absorbances were measured at 490 nm using a microplate reader (BMG Labtech spectrometer). The curves showing the percentage reduction of copper were plotted using the following equation (1):
% Reduction (Cu2+)=1-A0/A×100(1)
A: Absorbance of the reaction mixture; A0: Absorbance of the blank.
2.3.2. DPPH Radical Reduction Assay
DPPH method was performed according to Parejo method with moderate changes . The reaction mixture consisted of 150 µL of samples and 150 µL of a DPPH solution (0.238 mM, 4.7 mg in 50 mL EtOH). These mixtures were incubated in the dark for 45 min. Then, their absorbances were read at 25°C, in 96-well plates using a microplate reader (BMG Labtech spectrometer). The curves describing the reduction percentage of DPPH were plotted using the following equation (2):
% Réduction (DPPH)=(1-A/A0)×100(2)
A: Absorbance of the reaction mixture; A0: Absorbance of the blank.
The concentrations to reduce 50% (IC50) of DPPH radical and copper ion (Cu2+) were determined based on 3 independent experiments using the GraphPad Prism software Inc., USA. The IC50 (μg/mL) are expressed as the mean ± standard deviation (SD).
2.3.3. Isolated Compounds Content
Crude extract FM0 and ethyl acetate fraction FM2 solutions were respectively prepared at 10 mg/mL and 5 mg/mL. Solutions of compound 1 and 2 (5, 10, 15, 20, 25 and 50 µg/mL) as well as 3 and 4 (25, 50, 100, 150 and 200 µg/mL) were also prepared. All samples were submitted to HPLC analysis in reverse phase at controlled temperature (40°C). The amount of sample injected is 20 µL. The mobile phase was composed of solvents A (water with 0.1% formic acid) and B (methanol with 0.1% formic acid). The elution rate was set at 0.3 mL/min, with a gradient of: 5% (B) in 5 min, 5 to 95% (B) in 45 min, 95% (B) in 5 min, 95 to 5% (B) in 5 min, and initialization to 5% (B) in 5 min. Chromatograms are recorded using the Chromeleon Thermo Scientific, France software. Calibration curves were obtained from the isolated compounds.
2.4. Statistical Analysis
All analyses were conducted in triplicate, and the data are expressed as mean ± standard deviation (SD). Statistical significance was determined using a one-way analysis of variance (ANOVA), followed by Dunnett's post hoc test for multiple comparisons. Differences were considered statistically significant at p < 0.05. All statistical analyses were performed using GraphPad Prism.
3. Results and Discussion
3.1. Extraction and Compounds Identification
Hydroethanolic extraction yielded the crude extract FM0. The yield was 12.5%. This extract was fractionated and yielding aqueous fraction FM3, acetate fraction FM2 and hexane fraction FM1. The yields were 8%, 3%, and 0.5% respectively. It was observed that the polar fractions (FM2 and FM3) had higher yields than the nonpolar fraction (FM1). It can be suggested that M. micrantha compounds are predominantly polar. Other phytochemical studies report the isolation of nor-cucurbitacin derivatives and glycosylated flavonoid . These compounds are polar and were isolated using polar solvents, such as methanol, ethanol, acetone, and water .
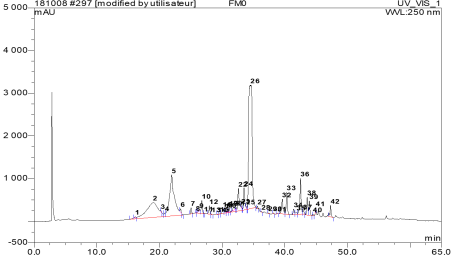
HPLC-UV (DAD) was used to identify the compounds of crude extract FM0. Figure 1 shows the resulting chromatogram. Fractionated compounds were detected at 254 nm. A total of 42 compounds were detected (Table 1).
Figure 1. Chromatogram of crude extract FM0 from M. micrantha.
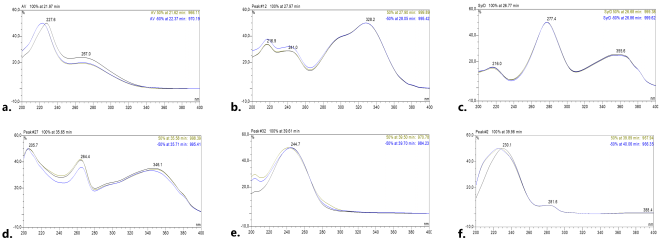
Table 1. Chemical profile of crude extract FM0 from M. micrantha.

Pic

Rt (min)

Abs%

UV λmax (nm)

Chemical family

1

16,15

0,10

221.8

274.6

THs

2

19,01

16,09

221.8

265.3

THs

3

20,24

0,07

229.0

268.3

THs

4

20,88

0,38

221.3

280

THs

5

21,97

18,09

227.6

267.0

THs

6

23,38

0,29

217.3

273.7

THs

7

25,04

0,51

226.1

270

THs

8

25,85

0,02

216.1

238.1

300.7

P.acid

9

26,40

0,10

225.2

276.0

362.4

P. ID

10

26,77

1,84

216

277.4

355.6

P. ID

11

27,15

0,02

223.4

260.0

303.1

P.acid

12

27,97

0,75

216.9

241.0

290

328.2

P.acid

13

28,34

0,03

270.0

374.2

P. ID

14

29,27

0,03

264.9

348.0

Flavon

15

29,70

0,03

276.7

361.0

P. ID

16

30,11

0,53

213.1

267.4

348.3

Flavon

17

30,46

0,30

214.0

275.6

358.4

P. ID

18

30,83

0,17

203.3

264.1

347.5

Flavon

19

31,13

0,28

204.3

264.8

343.7

Flavon

20

31,82

0,46

234.0

322.9

P.acid

21

32,25

0,10

214.0

277.3

355.3

P. ID

22

32,60

4,17

224.9

260.4

377.1

P. ID

23

33,05

0,11

252.7

343.6

Flavon

24

33,51

2,61

227.7

280.3

386.2

P. ID

25

33,85

0,07

260.6

Cub

26

34,57

38,45

255

Cub

27

35,65

0,15

205.7

264.4

346.1

Flavon

28

36,27

0,04

229.0

260

Cub

29

37,36

0,05

245.9

Cub

30

38,16

0,07

252

Cub

31

38,85

0,04

208.7

232.2

280

325.2

P.acid

32

39,61

1,93

244.7

Cub

33

40,33

2,28

226.3

281.4

A. Cub

34

41,42

0,58

236.9

Cub

35

41,90

0,33

203

240

Cub

36

42,52

4,07

243.7

Cub

37

42,94

0,41

233.4

276.8

A. Cub

38

43,59

1,64

228.0

285.5

A. Cub

39

43,93

1,41

240.9

Cub

40

44,52

0,09

227.6

283.4

A. Cub

41

44,95

0,11

240.5

Cub

42

47,31

1,19

243.2

Cub

Rt: retention time, Abs: absorbance, THs: tannin, P: phenolic, ID: indefinite, A: aromatic, Cub: nor-cucurbitacin.
The detected compounds were classified into six families based on the similarity of their UV spectra (Figure 2). Each chemical family was identified by comparing UV absorption spectrum with those of known molecules isolated in Euphorbiaceae.
The spectrum Figure 2a shows two maxima at λmax 227 and 269 nm indicating hydrolysable tannins . The spectrum Figure 2b with maxima at λmax 216, 240, 296 and 328 nm, would be characteristic of phenolic acids . The spectrum Figure 2c with λmax 277 and 365 nm corresponds to phenolics compounds. The spectrum Figure 2d with maxima λmax 204, 264 and 345 nm indicates flavones . Finally, the spectra Figure 2e and Figure 2f with absorptions λmax at 245 nm and 226, 281 nm respectively reveal nor-cucurbitacin derivatives already isolated from M. micrantha .
Figure 2. UV spectra of compounds families of M. micrantha (a: Hydrolysable tannins, b: Phenolic acids, c: Undefined phenolic compounds, d: Flavons, e: Nor-cucurbitacins, f: Aromatic nor-cucurbitacins).
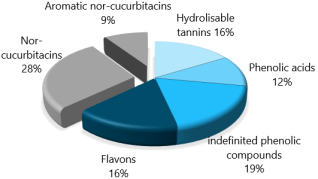
These six chemical families were classified into two groups based on their structural core. The diagram in Figure 3 shows the percentage of compounds in each family.
Figure 3. Chemical families identified from M. micrantha.
The first group comprises phenolic compounds, including hydrolyzable tannins, phenolic acids, and flavonoids. Among these phenolic compounds, one chemical family remained unidentified. Phenolic group accounts 63%. The second group consists of aromatic and non-aromatic nor-cucurbitacin derivatives. This group of compounds belongs to the steroids. It accounts 37%. Phenolic group contains a larger number of compounds than the steroid group. This result would suggest that phenolic compounds have the greatest structural diversity.
Structural diversity alone cannot explain abundance of compounds. Therefore, the total phenolic compounds contents were determined.
3.2. Phenolic Compounds Content
The total phenolic compounds (TPC), total flavonoid compounds (TFC), and total hydrolyzable tannins (HTs) contents were determined using colorimetric assays. The results are expressed in mg/g of extract (Table 2).
Table 2. Total contents of Phenolic compounds.

Extract/Fractions

TPC (mg GAE/g)

TFC (mg RE/g)

THs (mg TAE/g)

Crude extract (FM0)

382.63 ± 19.52b

95.84 ± 5.82b

210.53 ± 3.25c

Hexane (FM1)

68.12 ± 27.03d

9.05 ± 1.57d

11.87 ± 0.61d

Ethyl acetate (FM2)

797.91 ± 3.52a

171.99 ± 1.65a

636.76 ± 20.49a

Aqueous (FM3)

256.32 ± 11.33c

51.16 ± 2.53c

230.41 ± 6.76b

Total contents of Polyphenol TPC, Flavonoids TFC and Hydrolysable tannins THs.
The results are presented as mean ± SD (n = 3) of three replicates, within each column, values carrying different superscript letters indicate statistically significant differences based on Dunnett’s T3 multiple comparisons test (p< 0.05), GAE, RE and TAE (Gallic acid, Rutin and Tannic acid equivalent, respectively).
The TPC ranged from 68.12 - 797.91 mg GAE/g. The maximum value was obtained in the acetate fraction FM2 and the lowest in the hexane fraction FM1. Significant differences were observed. The TPC of the crude extract FM0 (382.63 ± 19.52 mg GAE/g) is greater than of the values (293-225 mg GAE/g) obtained for E. humifusa, E. hirta, E. umbellata and E. spendia which like M. micrantha belong to the Euphorbiaceae family [18-21]. The result shows that M. micrantha phenolic compounds in the crude extract are concentrated in the acetate fraction FM2 due to its high observed TPC value.
Analysis of the phenolic compound classes revealed that TFC and HTs ranged from 9.05 to 171.99 mg RE/g and 11.87 to 636.76 mg TAE/g, respectively. Significant differences were observed. The maximum values of TFC and HTs were obtained in the acetate fraction FM2 and the lowest in hexane fraction FM1. All HTs values were higher than TFC values in the various fractions. This result shows that the acetate fraction was concentrated in flavonoids and hydrolyzable tannins than the other fractions. Hydrolysable tannins are relatively less abundant in M micrantha. Naturally, there are two main groups of hydrolysable tannins ellagitannin and gallotannin [22, 23].
Hydrolyzable tannins, flavonoids, and phenolic acids are phenolic compounds that are known to have antioxidant properties . These compounds may be responsible of M. micrantha antioxidant activity.
3.3. Structure Elucidation of Compounds
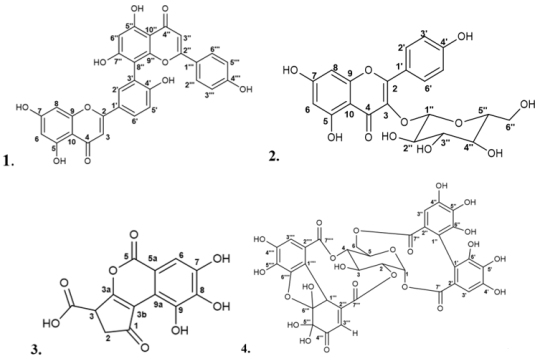
Four pure phenolic compounds (1-4) (Figure 4) were isolated from ethyl acetate fraction FM2. This fraction was selected because it was found to contain a high concentration of polyphenols.
Compounds 1-2 were purified as yellow amorphous powders and showed UV spectra (Appendix: Figures S1.3 and S2.3) with absorption (λmax 209, 268 and 336 nm; λmax: 203, 264 and 347 nm, respectively) similar to those of flavones. 1 and 2 were soluble in dichloromethane and methanol respectively making 2 is more polar than 1. Their HR-ESI-MS analysis yielded molecular ions  [M-H]-m/z 537.0822 (Calc. for C30H18O10, 538.0900) and  [M-H]- m/z 447.0927 (Calc. for C21H20O11, 448.1005) characteristic of biflavone and glycosylated flavone respectively. Their structures were determined to be known compounds by comparing their 1D (1H, 13C) and 2D (COSY, HSQC and HMBC) NMR spectral data (Appendix, Figures S1.7-11 and S2.7-11) with literature values. Compounds 1 and 2 were identified as Amentoflavone and Astragalin, respectively (Figure 4) . Amentoflavone was previously isolated from many species which belong to several families including Euphorbiaceae . Astragaline was isolated and reported in the Euphorbia sp. and Phyllanthus sp. These genera belong to Euphorbiaceae family .
Figure 4. Isolated compounds: 1-Amentoflavone, 2-Astragalin, 3-Micranthin acid and 4-Mareyanin.
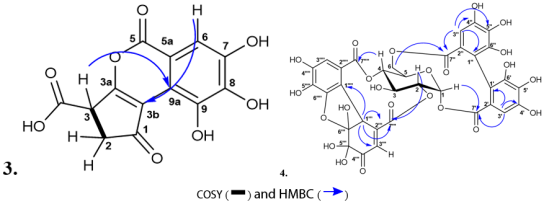
Compound 3 was obtained as a yellow-orange powder so-luble in methanol. Its UV spectrum (Appendix: Figure S3.3) exhibited absorptions at λmax 280 and 357 nm similar to those of the unidentified chemical family. The IR spectrum (Appendix: Figure S3.4) of 3 indicates hydroxyl group (OH) at υmax 3200 cm-1 and unsaturated α, β carbonyl group (C=O) at υmax 1686 cm-1. The HR-ESI-MS analysis of 3 exhibited a quasi-molecular ion peak  [M-H]-m/z 291.0140 (Calc. for C13H8O8, 292.0219) corresponding to ten degrees of unsaturation. This molecular formula establishes a C13 framework, thereby excluding a C15 flavonoid structure. The 1H NMR spectral data of 3 (Table 3) displayed aromatic proton at δH 7.38 (s) assigned to H-6, and alicyclic proton at δH 4.52 (dd, J = 6.7, 1.2 Hz) assigned to H-3 (CH) and methylenic protons at δH 2.79 (dd, J = 18.4, 6.7 Hz) and 2.94 (dd, J = 18.4, 1.2 Hz) ascribed to Ha-2 and Hb-2 respectively. The 13C NMR (J-mod) spectral data (Table 3) of 3 revealed the presence of sp3 methinic carbon and me-thylene at δC 43.9 (C-3) and 38.9 (C-2) respectively. In addition, the 13C NMR (J-mod) spectrum also revealed the presence of sp2 carbons. These included two sp2 carboxydes at δC 163 (C-5) and 177.3 (3-COOH), one sp2 carbonyl at δC 197.3 (C-1) and eight sp2aromatic carbons (δC 110.3, 115.1, 117.5, 142.2, 143.2, 145.2, 146.4 and 150.6). Based on the unsaturated carbons and the molecular formula (Calc. for C13H7O8, 292.0219, with ten degrees of unsaturation) it was suggested three rings in the structure of 3.
The complete structure of 3 was established using the HSQC and HMBC spectrum data, on which 1JC-H, 2JC-H, 3JC-H and 4JC-H carbon-proton correlations were observed. Proton at δH 4.52 correlates with carbons at δC 38.9 (C-2), 142.2 (C-3b), 146.4 (C-3a), 177.3 (3-COOH) and 197.3 (C-1). Geminal protons at δH 2.79 and 2.94 correlate with carbons at δC 43.9 (C-3), 142.2 (C-3b), 146.4 (C-3a), 177.3 (3-COOH) and 197.3 (C-1). These correlations suggested the formation of a five-membered carbon ring. Concerning proton at δH 7.38, it was observed a 1JC-H correlation with carbon at δC 110.3 (C-6), 2JC-H correlation with carbons at δC 115.1 (C-5a), and 145.2 (C-7), 3JC-H with carbons at δC 117.5 (C-9a), 143.2 (C-8), and 163.0 (C-5), but also 4JC-H correlation with carbons at δC 142.2 (C-3b), and 150.6 (C-9). This allows for the six-membered aromatic ring. The connection between the five-membered ring and the aromatic ring was possible through the 4JC-H correlation of aromatic proton at δH 7.38 and carbon at δC 142.2 (C-3b) and between alicyclic proton at δH 4.52 and carbon δC 117.5 (C-9a) (Figure 5). The third ring of 3 was obtained through an ester bond between carbons C-5 and C-3a. A comparison of our spectral data with the literature suggests that Compound 3 is an analogue of Brevifolin acid. The difference between them lies at carbon atoms C1 and C3. Brevifolin acid has a carboxyl group at position C1 and a ketone group at position C3. Compound 3 is an isomer of Brocchlin acid which was isolated from Chrozophora brocchiana (Euphorbiaceae) and described only once .
Compound 3 is an original compound derived from M. micrantha, it was named “Micranthin acid.” It is an isocoumarin.
Compound 4 was obtained as a yellow powder soluble in methanol. Its UV spectrum (Appendix: Figure S4.3) showed two absorptions at λmax 221 nm, and 269 nm similar to hydrolysable tannins.
The IR spectrum (Appendix: Figure S4.4) showed absorption bands for hydroxyl groups (OH) at υmax 3270.6 cm-1, and carbonyl groups at υmax 1698 cm-1 (C=O, ester) and υmax 1607.8 cm-1 (C=O, ketone).
Table 3. 1H-NMR and 13C-NMR spectra data of compound 3.

Position

13C-NMR δ (ppm)

1H-NMR δH (ppm)

1

197.3

C

2

38.9

CH2

2.94 (dd, 18.4, 1.2), 2.79 (dd, 18.4, 6.7)

3

43.9

CH

4.52 (dd, 6.7, 1, 2)

3a

146.4

C

3b

142.2

C

5

163

C

5a

115.1

C

6

110.3

CH

7,38 (s)

7

145.2

C

8

143.2

C

9

150.6

C

9a

117.5

C

3-COOH

177.3

C

Figure 5. COSY and HMBC correlations of compounds 3-4.
Compound 4 molecular formula was established as C34H24O23 by HR-ESI-MS (Appendix: Figure S4.5-6), which showed a deprotonated molecular ion at  [M-H]-m/z 799.0642 (calcd for C34H23O23-, 800.0708). The MS spectrum displayed a characteristic fragment ion at m/z 301, indicative of an ellagitannin core . The 1H NMR spectrum data of 4 (Table 4) revealed aromatic proton signals at δH 7.28 (s), 6.89 (s), 6.76 (s), 6.57 (d, J = 0.5 Hz) and 5.55 (d, J = 0.5 Hz) assigned to H-5’’’’, H-5’, H-5’’, H-5’’’ and H-1’’’ respectively. The signals between δH 4.08 and 5.17, suggested sugar unit. On the 13C NMR (J-mod) spectrum of 4 the shielded sp3 carbons at δC 90.9 (C-1), 71.1 (C-2), 62.2 (C-3), 69.8 (C-4), 61.2 (C-5), and 64.7 (C-6) characteristic of oxygenated carbons of glucose engaged in ester linkages suggested the presence of hydrolysable tannin . The assignment of sp2 carbon signals allowed identification of two carboxydes (C=O, ester) at δC 167.7 (C-7') and 170.1 (C-7'') and twelve aromatic carbons at δC 116.3 (C-1'), 145.3 (C-2'), 145.7 (C-3'), 138.3 (C-4'), 110.5 (C-5'), 117.9 (C-6'), 116.3 (C-1''), 145.3 (C-2''), 145.7 (C-3''), 137.2 (C-4''), 108.7 (C-5'') and 116.3 (C-6''), all characteristic of the hexahydroxydiphenyl (HHDP) ring of ellagic tannins . Also two carboxydes (C=O, ester) were observed at δC 166.8 (C-7''') and 165.8 (C-7'''), one carbonyl (C=O, ketone) at δC 192.3 (C-4''') and carbons at δC 41.6 (C-1'''), 95.8 (C-2'''), 96.3 (C-3'''), 129.9 (C-5'''), 153.4 (C-6'''), 119.6 (C-1''''), 143.2 (C-2''''), 146.3 (C-3''''), 139.5 (C-4''''), 114.3 (C-5'''') and 115.4 (C-6''''), all characteristic of the dehydrohexahydroxydiphenyl (DHHDP) another ring of ellagic tannins .
Table 4. 1H-NMR and 13C-NMR spectra data of compound 4.

Position

13C-NMR δ (ppm)

1H-NMR δH (ppm)

Glucose

1

90.9

CH

6.09 (d, 1.3)

2

71.1

CH

5.02 (dt, 2.9, 1.3)

3

62.2

CH

4.50 (dt, 2.9, 1.4)

4

69.8

CH

5.17 (m)

5

61.2

CH

4.62 (m)

6

64.7

CH2

5.13 (dd, 12.8, 1.4), 4.09 (dd, 12.8, 5.5)

Hexahydroxydiphenyl (HHDP)

1’

116.3

C

2’

117.9

C

3’

110.5

CH

6.89 (s)

4’

138.3

C

5’

145.7

C

6’

145.3

C

7’

167.7

C

1’’

116.3

C

2’’

116.3

C

3’’

108.7

CH

6.76 (s)

4’’

137.2

C

5’’

145.7

C

6’’

145.3

C

7’’

170.1

C

Dehydrohexahydroxydiphenyl (DHHDP)

1’’’

41.6

CH

5.55 (d, 0.5)

2’’’

153.4

C

3’’’

129.9

CH

6.57 (d, 0.5)

4’’’

192.3

C

5’’’

96.3

C

6’’’

95.8

C

7’’’

165.8

C

1’’’’

119.6

C

2’’’’

115.4

C

3’’’’

114.3

CH

7.28 (s)

4’’’’

139.5

C

5’’’’

146.2

C

6’’’’

143.2

C

7’’’’

166.8

C

The HMBC spectrum data allowed ester linkages between glucose and the HHDP ring at carbons C-1 and C-6 and the DHHDP ring at carbons C-2 and C-4. It was demonstrated by correlations observed between proton at δH 6.09 (H-1) and carbon at 167.7 (C-7'), protons at δH 4.09/5.13 (Ha-6/Hb-6) and carbon at 170.1 (C-7'') and correlations between proton at δH 5.02 (H-2) and carbon at 165.8 (C-7''') and proton at δH 5.17 (H-4) and carbon at 166.8 (C-7'''') (Figure 5). The anomeric proton at δH 6.09 (d, J = 1.0 Hz) assigned to H-1 indicated α-D configuration of glucose. The combination of all spectral data allowed the structural characterization of 4 as (1, 6)-HHDP-(2, 4)-DHHDP-α-D-glucose (Figure 5). Comparing these spectral data with the literature, this compound has been identified as an original isomeric compound of Granatin A isolated from Punica granatum (Lythraceae) . Compound 4 has an α-D-glucose configuration, while Granatin A has a β-D-glucose configuration. They would be anomers. Mareyanin was proposed as the trivial name for compound 4 because it is derived from Mareya micrantha.
3.4. Antioxidant Activity of Isolated Compound
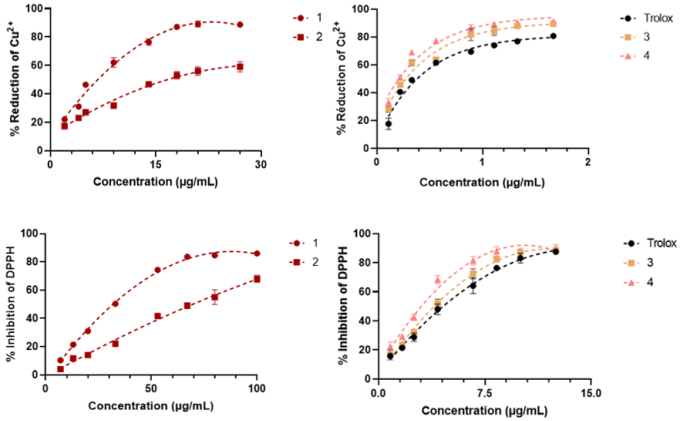
The antioxidant activities of compounds 1-4 were determined using DPPH and CUPRAC methods. The first method is based on DPPH radical reduction. The second method is based on the ion Cu2+ reduction. The results (Figure 6) showed that the isolated compounds exhibit antioxidant activities with both methods. These activities are dose dependent. The inhibition concentration to reduce 50% (IC50) of DPPH radical or Cu2+ ion were determined to compare compound activities (Table 5). The best activity is determined by the lowest IC50.
Figure 6. Cu2+ reduction and DPPH inhibition curves of isolated compounds.

Table 5. Antioxidant activity and quantification of isolated compounds.

Compounds

IC50/Cu2+

IC50/DPPH

Extract FM0

Fraction FM2

(µg/mL)

(µg/mL)

(mg/g of dry extract)

1

6.74±0.24c

34.46±0.50c

˂ 5

6.01±0.10

2

16.84±0.67d

68.88±1.87d

7.58±0.03

23.93±0.26

3

0.31±0.01b

4.24±0.14b

77.73±0.33

81.86±0.27

4

0.22±0.01a

3.26±0.01a

196.76±2.67

˃ 200

Trolox

0.39±0.01b

4.86±0.30b

-

-

Results are presented as mean ± SD (n = 3) of three replicates, within each column, values carrying different superscript letters indicate statistically significant differences based on Dunnett’s T3 multiple comparisons test (p< 0.05), Trolox was positive control use as reference antioxidant compound.
Compounds 3 and 4 exhibited in vitro antioxidant activity superior to that of Trolox (Vitamin E analog), which was used as a reference standard (Table 5). However, this superiority achieved statistical significance only for compound 4. According to both assays (DPPH and CUPRAC), the antioxidant potency followed the decreasing order of 4 > 3 > 1 > 2. Isolated phenolic compounds 1-4 are more active than nor-cucurbitacins derivatives already isolated from M. micrantha previously .
The antioxidant activities of these phenolic compounds would be due to electrons delocalization observed on double bonds and conjugated such as aromatic rings , and on α, β-unsaturated carbonyl groups . The activity is also due to protons of hydroxyl groups and proton of acidic group . These functional groups are observed in the isolated compounds.
Compound concentrations were determined in the crude extract FM0 and the polyphenol enriched fraction FM2 using HPLC-UV method. Among the isolated compounds, compound 4 exhibited the highest concentration in both the crude extract and the ethyl acetate fraction. The compounds followed a decreasing order of concentration: 4 > 3 > 2 > 1 (Table 5). This quantitative profile likely reflects their natural abundance in the plant, which may contribute significantly to its overall antioxidant activity. Notably, this is the first study to characterize the polyphenolic profile of M. micrantha and evaluate its antioxidant potential.
4. Conclusion
Analysis of the polyphenolic compounds in Mareya micrantha leaf extract demonstrated that the plant contains highly structurally diverse constituents. These compounds belong to five distinct classes: flavonoids, isocoumarins, hydrolyzable tannins, phenolic acids, and aromatic nor-cucurbitacins. This plant exhibits a high total polyphenol content. Fractionation and purification of these phytoconstituents led to the isolation of four major compounds: two known flavonoids, Amentoflavone and Astragalin, and two novel compounds, a hydrolyzable tannin named Mareyanin and an isocoumarin designated as Micranthin acid. Overall, the isolated polyphenols demonstrated antioxidant activity superior to that of the nor-cucurbitacins previously described in this species. The antioxidant capacity of Mareya micrantha is considered to be driven chiefly by phenolic compounds, with steroidal components contributing to a lesser degree. Mareya micrantha undoubtedly deserves its reputation as a medicinal plant in West Africa. Further studies will help to identify additional natural compounds with unique chemical structures and antioxidant properties.
Acknowledgments
We acknowledge Dr. Guillaume Marty, Scientific Director of the MetaToul-AgromiX platform at the LRSV (UMR 5546), and Mr. Marc Vedrenne, Head of the ICT NMR platform (both at the University of Toulouse), for their technical support with the mass spectrometry and nuclear magnetic resonance spectroscopy analyses.
Author Contributions
Gnaore Yoh Toussaint Douhore: Conceptualization, Investigation, Resources, Writing – original draft
Kouassi Blaise Kouadio: Data curation, Formal Analysis, Methodology
Yapo Severin Katou: Formal Analysis, Investigation
Aka Faustin Kabran: Supervision, Validation, Visualization, Writing – review & editing
Barthelemy Koffi Attioua: Project administration, Supervision
Conflicts of Interest
The authors declare no conflicts of interest.
References
[1] Jiang, T.; Sun, Q.; Chen, S. Oxidative Stress: A Major Pathogenesis and Potential Therapeutic Target of Antioxidative Agents in Parkinson’s Disease and Alzheimer’s Disease. Progress in Neurobiology 2016, 147, 1-19.
[2] Juan, C. A.; Pérez de la Lastra, J. M.; Plou, F. J.; Pérez-Lebeña, E. The Chemistry of Reactive Oxygen Species (ROS) Revisited: Outlining Their Role in Biological Macromolecules (DNA, Lipids and Proteins) and Induced Pathologies. International Journal of Molecular Sciences 2021, 22 (9), 4642.
[3] Pisoschi, A. M.; Pop, A. The Role of Antioxidants in the Chemistry of Oxidative Stress: A Review. European Journal of Medicinal Chemistry 2015, 97, 55-74.
[4] Douhoré, G. Y. T.; Attioua, K. B.; Soro, Y.; Kabran, F. A.; Kablan, L. C. A.; Vedrenne, M.; Mathieu, C.; Vaca-Garcia, C. Nor-Cucurbitacins from the Leaves of Mareya Micrantha (Benth.) Müll. Arg. (Euphorbiaceae). Fitoterapia 2020, 104538.
[5] Toussaint-Douhoré, G. Y.; Soro, Y.; Ouédraogo, N.; Vaca-Garcia, C.; Koffi-Attioua, B.; Carraz, M. Liver Cancer Antiproliferative Activity of a New Nor-Cucurbitacin from Mareya Micrantha Müll. Arg. Fitoterapia 2023, 166, 105471.
[6] Carocho, M.; Ferreira, I. C. F. R. A Review on Antioxidants, Prooxidants and Related Controversy: Natural and Synthetic Compounds, Screening and Analysis Methodologies and Future Perspectives. Food and Chemical Toxicology 2013, 51 (Supplement C), 15-25.
[7] Singleton, V. L.; Rossi, J. A. Colorimetry of Total Phenolics with Phosphomolybdic-Phosphotungstic Acid Reagents. American Journal of Enology and Viticulture. 1965, pp 144-158.
[8] Zhishen, J.; Mengcheng, T.; Jianming, W. The Determination of Flavonoid Contents in Mulberry and Their Scavenging Effects on Superoxide Radicals. Food Chemistry 1999, 64 (4), 555-559.
[9] Mole, S.; Waterman, P. G. A Critical Analysis of Techniques for Measuring Tannins in Ecological Studies. Oecologia 1987, 72 (1), 137-147.
[10] Campos, C.; Guzmán, R.; López-Fernández, E.; Casado, Á. Evaluation of the Copper (II) Reduction Assay Using Bathocuproinedisulfonic Acid Disodium Salt for the Total Antioxidant Capacity Assessment: The CUPRAC-BCS Assay. Analytical Biochemistry 2009, 392 (1), 37-44.
[11] Parejo, I.; Codina, C.; Petrakis, C.; Kefalas, P. Evaluation of Scavenging Activity Assessed by Co (II)/EDTA-Induced Luminol Chemiluminescence and DPPH· (2, 2-Diphenyl-1-Picrylhydrazyl) Free Radical Assay. Journal of Pharmacological and Toxicological Methods 2000, 44 (3), 507-512.
[12] Okpekon, A. T.; Koffi, K. L.; Bony, F. N.; Gono, K. N.; Kpaïbe, A. S.; Amin, C. N. Activité Antibactérienne et Constituants Chimiques Des Feuilles de Mareya Micrantha (Euphorbiaceae). International Journal of Biological and Chemical Sciences 2023, 17(4), 1619-1630.
[13] Acheampong, A.; Quartey, E.; Acquaye, M. A.; Naazo, A. A.; Baah, K. A.; Amankwaa, L. T.; Buah, P.; Frimpong, S. O. In Vitro Anthelminthic and Anti-Inflammatory Activities, and GC-MS Analysis of Methanol and Acetone Extracts of Mareya Micrantha Leaves. J Pharmacogn Phytochem 2024, 13 (2), 799-805.
[14] Tsai, C. S.; Guede-Guina, F.; Smith, M. O.; Vangah-Manda, M.; Ochillo, R. F. Isolation of Cholinergic Active Ingredients in Aqueous Extracts of Mareya Micrantha Using the Longitudinal Muscle of Isolated Guinea-Pig Ileum as a Pharmacological Activity Marker. J Ethnopharmacol 1995, 45 (3), 215-222.
[15] Grasel, F. dos S.; Ferrão, M. F.; Wolf, C. R. Ultraviolet Spectroscopy and Chemometrics for the Identification of Vegetable Tannins. Industrial Crops and Products 2016, 91, 279-285.
[16] Sun, J.; Liang, F.; Bin, Y.; Li, P.; Duan, C. Screening Non-Colored Phenolics in Red Wines Using Liquid Chromatography/Ultraviolet and Mass Spectrometry/Mass Spectrometry Libraries. Molecules 2007, 12 (3), 679-693.
[17] He, J.-B.; Yuan, S.-J.; Du, J.-Q.; Hu, X.-R.; Wang, Y. Voltammetric and Spectral Characterization of Two Flavonols for Assay-Dependent Antioxidant Capacity. Bioelectrochemistry 2009, 75 (2), 110-116.
[18] Abu, A. B.; Zuraini, Z.; Lacimanan, Y. L.; Sreenivasan, S. Antioxidant Activity and Phytochemical Screening of the Methanol Extracts of Euphorbia Hirta L. Asian Pacific Journal of Tropical Medicine 2011, 4 (5), 386-390.
[19] Kefayati, Z.; Motamed, S. M.; Shojaii, A.; Noori, M.; Ghods, R. Antioxidant Activity and Phenolic and Flavonoid Contents of the Extract and Subfractions of Euphorbia Splendida Mobayen. Pharmacognosy Res 2017, 9 (4), 362-365.
[20] Luyen, B. T. T.; Tai, B. H.; Thao, N. P.; Eun, K. J.; Cha, J. Y.; Xin, M. J.; Lee, Y. M.; Kim, Y. H. Anti-Inflammatory Components of Euphorbia Humifusa Willd. Bioorganic & Medicinal Chemistry Letters 2014, 24 (8), 1895-1900.
[21] Minozzo, B. R.; Lemes, B. M.; Justo, A. da S.; Lara, J. E.; Petry, V. E. K.; Fernandes, D.; Belló, C.; Vellosa, J. C. R.; Campagnoli, E. B.; Nunes, O. C.; Kitagawa, R. R.; Avula, B.; Khan, I. A.; Beltrame, F. L. Anti-Ulcer Mechanisms of Polyphenols Extract of Euphorbia Umbellata (Pax) Bruyns (Euphorbiaceae). J Ethnopharmacol 2016, 191, 29-40.
[22] Guo, L.; Qiang, T.; Ma, Y.; Ren, L.; Dai, T. Purification and Characterization of Hydrolysable Tannins Extracted from Coriaria Nepalensis Bark Using Macroporous Resin and Their Application in Gallic Acid Production. Industrial Crops and Products 2021, 162, 113302.
[23] Tahara, K.; Milkowski, C.; Oda-Yamamizo, C. Elucidation and Reconstitution of Hydrolyzable Tannin Biosynthesis. Plant Biotechnology 2024, 41 (3), 203-212.
[24] Muflihah, Y. M.; Gollavelli, G.; Ling, Y.-C. Correlation Study of Antioxidant Activity with Phenolic and Flavonoid Compounds in 12 Indonesian Indigenous Herbs. Antioxidants (Basel) 2021, 10 (10), 1530.
[25] Ganbaatar, C.; Gruner, M.; Tunsag, J.; Batsuren, D.; Ganpurev, B.; Chuluunnyam, L.; Sodbayar, B.; Schmidt, A. W.; Knölker, H.-J. Chemical Constituents Isolated from Zygophyllum Melongena Bunge Growing in Mongolia. Natural Product Research 2016, 30 (14), 1661-1664.
[26] Yu, S.; Yan, H.; Zhang, L.; Shan, M.; Chen, P.; Ding, A.; Li, S. F. Y. A Review on the Phytochemistry, Pharmacology, and Pharmacokinetics of Amentoflavone, a Naturally-OccurringBiflavonoid. Molecules 2017, 22 (2), 299.
[27] Riaz, A.; Rasul, A.; Hussain, G.; Zahoor, M. K.; Jabeen, F.; Subhani, Z.; Younis, T.; Ali, M.; Sarfraz, I.; Selamoglu, Z. Astragalin: A Bioactive Phytochemical with Potential Therapeutic Activities. Adv Pharmacol Sci 2018, 2018.
[28] Hawas, U. W. Antioxidant Activity of Brocchlin Carboxylic Acid and Its Methyl Ester from Chrozophora Brocchiana. Natural Product Research 2007, 21 (7), 632-640.
[29] Yoshida, T.; Hatano, T.; Okuda, T.; Memon, M. U.; Shingu, T.; Inoue, K. Spectral and Chromatographic Analyses of Tannins. I. 13C Nuclear Magnetic Resonance Spectra of Hydrolyzable Tannins. Chem.Pharm.Bull. 1984, 32 (5), 1790-1799.
[30] Steinmetz, W. E. NMR Assignment and Characterization of Proton Exchange of the Ellagitannin Granatin B. Magnetic Resonance in Chemistry 2010, 48 (7), 565-570.
[31] Tanaka, T.; Nonaka, G.-I.; Nishioka, I. Punicafolin, an Ellagitannin from the Leaves of Punica Granatum. Phytochemistry 1985, 24 (9), 2075-2078.
[32] Ouellette, R. J.; Rawn, J. D. 8 - Alcohols and Phenols. In Principles of Organic Chemistry; Ouellette, R. J., Rawn, J. D., Eds.; Elsevier: Boston, 2015; pp 209-238.
[33] Messi, A. N.; Ngo Mbing, J.; Ndongo, J. T.; Nyegue, M. A.; Tchinda, A. T.; Yemeda, F. L.; Frédérich, M.; Pegnyemb, D. E. Phenolic Compounds from the Roots of Ochna Schweinfurthiana and Their Antioxidant and Antiplasmodial Activities. Phytochemistry Letters 2016, 17, 119-125.
[34] Zeng, Y.; Chen, X.; Zhao, D.; Li, H.; Zhang, Y.; Xiao, X. Estimation of pKa Values for Carboxylic Acids, Alcohols, Phenols and Amines Using Changes in the Relative Gibbs Free Energy. Fluid Phase Equilibria 2012, 313, 148-155.
[35] Chen, J.; Yang, J.; Ma, L.; Li, J.; Shahzad, N.; Kim, C. K. Structure-Antioxidant Activity Relationship of Methoxy, Phenolic Hydroxyl, and Carboxylic Acid Groups of Phenolic Acids. Sci Rep 2020, 10 (1), 1-9.
Cite This Article
  • APA Style

    Douhore, G. Y. T., Kouadio, K. B., Katou, Y. S., Kabran, A. F., Attioua, B. K. (2026). Phenolic Compounds of Mareya Micrantha (Benth.) Mull. Arg. and Their Antioxidant Activity. Science Journal of Chemistry, 14(5), 176-188. https://doi.org/10.11648/j.sjc.20261405.14

    Copy | Download

    ACS Style

    Douhore, G. Y. T.; Kouadio, K. B.; Katou, Y. S.; Kabran, A. F.; Attioua, B. K. Phenolic Compounds of Mareya Micrantha (Benth.) Mull. Arg. and Their Antioxidant Activity. Sci. J. Chem. 2026, 14(5), 176-188. doi: 10.11648/j.sjc.20261405.14

    Copy | Download

    AMA Style

    Douhore GYT, Kouadio KB, Katou YS, Kabran AF, Attioua BK. Phenolic Compounds of Mareya Micrantha (Benth.) Mull. Arg. and Their Antioxidant Activity. Sci J Chem. 2026;14(5):176-188. doi: 10.11648/j.sjc.20261405.14

    Copy | Download

  • @article{10.11648/j.sjc.20261405.14,
      author = {Gnaore Yoh Toussaint Douhore and Kouassi Blaise Kouadio and Yapo Severin Katou and Aka Faustin Kabran and Barthelemy Koffi Attioua},
      title = {Phenolic Compounds of Mareya Micrantha (Benth.) Mull. Arg. and Their Antioxidant Activity},
      journal = {Science Journal of Chemistry},
      volume = {14},
      number = {5},
      pages = {176-188},
      doi = {10.11648/j.sjc.20261405.14},
      url = {https://doi.org/10.11648/j.sjc.20261405.14},
      eprint = {https://article.sciencepublishinggroup.com/pdf/10.11648.j.sjc.20261405.14},
      abstract = {Mareya Micrantha Is a West African Medicinal Plant Endowed with Numerous Therapeutic Properties. It Was Characterized by a High Content of Steroidal Derivatives Such as Cucurbitacins (C-30) and Nor-cucurbitacins (C-29). A Phytochemical Study Was Conducted on Its Phenolic Composition and the Antioxidant Activity of These Compounds. To Carry Out This Investigation, Solid-liquid Extraction, Liquid-liquid Fractionation, Chromatographic Column Isolations, and Compound Characterization Were Performed. The Phenolic Compounds Were Identified Using HPLC-UV-DAD Method, and Their Concentrations Were Determined Using Colorimetric Assays and HPLC-UV Method. Isolated Compounds Structures Were Determined by Spectroscopic Analysis (UV, IR, MS, and NMR). Antioxidant Activities Were Evaluated Using Two Different Tests (DPPH and CUPRAC). This Study Led to the Isolation of Amentoflavone and Astragalin Two Known Flavonoids and Two Original Phenolic Compounds Including an Isocoumarin Named Micranthin Acid and a Hydrolysable Tannin Named Mareyanin. This Is the First Descriptive Study of Phenolic Compounds from Mareya Micrantha. Both Original Compounds Showed Greater Antioxidant Activity Than Trolox. These Compounds Are Present in High Concentrations in Extracts from the Leaves of This Plant. They Could Be Considered as the Most Potent Antioxidant and Major Phenolic Compounds of Mareya Micrantha. The Isolated Phenolic Compounds Exhibited Greater Activity Than the Previously Isolated Steroidal Derivatives.},
     year = {2026}
    }
    

    Copy | Download

  • TY  - JOUR
    T1  - Phenolic Compounds of Mareya Micrantha (Benth.) Mull. Arg. and Their Antioxidant Activity
    AU  - Gnaore Yoh Toussaint Douhore
    AU  - Kouassi Blaise Kouadio
    AU  - Yapo Severin Katou
    AU  - Aka Faustin Kabran
    AU  - Barthelemy Koffi Attioua
    Y1  - 2026/10/31
    PY  - 2026
    N1  - https://doi.org/10.11648/j.sjc.20261405.14
    DO  - 10.11648/j.sjc.20261405.14
    T2  - Science Journal of Chemistry
    JF  - Science Journal of Chemistry
    JO  - Science Journal of Chemistry
    SP  - 176
    EP  - 188
    PB  - Science Publishing Group
    SN  - 2330-099X
    UR  - https://doi.org/10.11648/j.sjc.20261405.14
    AB  - Mareya Micrantha Is a West African Medicinal Plant Endowed with Numerous Therapeutic Properties. It Was Characterized by a High Content of Steroidal Derivatives Such as Cucurbitacins (C-30) and Nor-cucurbitacins (C-29). A Phytochemical Study Was Conducted on Its Phenolic Composition and the Antioxidant Activity of These Compounds. To Carry Out This Investigation, Solid-liquid Extraction, Liquid-liquid Fractionation, Chromatographic Column Isolations, and Compound Characterization Were Performed. The Phenolic Compounds Were Identified Using HPLC-UV-DAD Method, and Their Concentrations Were Determined Using Colorimetric Assays and HPLC-UV Method. Isolated Compounds Structures Were Determined by Spectroscopic Analysis (UV, IR, MS, and NMR). Antioxidant Activities Were Evaluated Using Two Different Tests (DPPH and CUPRAC). This Study Led to the Isolation of Amentoflavone and Astragalin Two Known Flavonoids and Two Original Phenolic Compounds Including an Isocoumarin Named Micranthin Acid and a Hydrolysable Tannin Named Mareyanin. This Is the First Descriptive Study of Phenolic Compounds from Mareya Micrantha. Both Original Compounds Showed Greater Antioxidant Activity Than Trolox. These Compounds Are Present in High Concentrations in Extracts from the Leaves of This Plant. They Could Be Considered as the Most Potent Antioxidant and Major Phenolic Compounds of Mareya Micrantha. The Isolated Phenolic Compounds Exhibited Greater Activity Than the Previously Isolated Steroidal Derivatives.
    VL  - 14
    IS  - 5
    ER  - 

    Copy | Download

Author Information
  • Abstract
  • Keywords
  • Document Sections

    1. 1. Introduction
    2. 2. Materials and Methods
    3. 3. Results and Discussion
    4. 4. Conclusion
    Show Full Outline
  • Acknowledgments
  • Author Contributions
  • Conflicts of Interest
  • References
  • Cite This Article
  • Author Information