
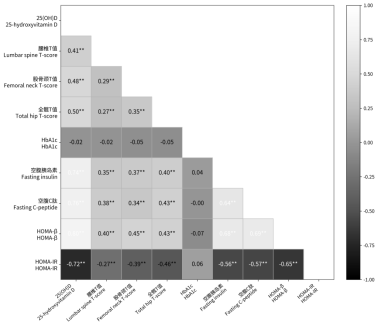
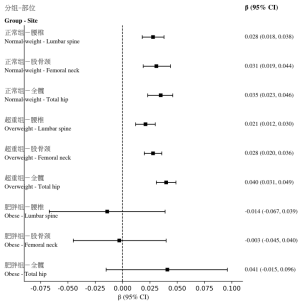
Objective to explore the relationship between serum 25-hydroxyvitamin D [25 (OH)D] and bone mineral density (BMD) in patients with type 2 diabetes mellitus (T2DM) complicated with osteoporosis at different body mass index (BMI) levels, and to assess the modifying effect of BMI. Methods A total of 338 hospitalized patients with T2DM and osteoporosis from January 2021 to January 2024 were enrolled. According to BMI, patients were divided into normal-weight, overweight, and obese groups. Multiple linear regression analyses were performed with lumbar spine, femoral neck, and total hip T-scores as dependent variables and 25 (OH)D as the independent variable, adjusting for age, sex, and glycated hemoglobin (HbA1c). An interaction term between 25 (OH)D and BMI was included. Sensitivity analysis was conducted using the lowest T-score. Results In the normal-weight and overweight groups, 25 (OH)D was positively correlated with lumbar spine, femoral neck, and total hip T-scores, with the strongest correlation observed at the total hip. No significant correlation was found in the obese group. Interaction analysis indicated that BMI modified the association between 25 (OH)D and total hip T-score. The results of sensitivity analysis were consistent. Conclusion Serum 25 (OH)D is positively correlated with BMD in patients with T2DM complicated with osteoporosis. This association may be modified by BMI, being more evident in normal-weight and overweight patients but not statistically significant in obese patients.
| Published in | Science Research (Volume 14, Issue 6) |
| DOI | 10.11648/j.sr.20261406.14 |
| Page(s) | 419-425 |
| Creative Commons |
This is an Open Access article, distributed under the terms of the Creative Commons Attribution 4.0 International License (http://creativecommons.org/licenses/by/4.0/), which permits unrestricted use, distribution and reproduction in any medium or format, provided the original work is properly cited. |
| Copyright |
Copyright © The Author(s), 2026. Published by Science Publishing Group |
Type 2 Diabetes Mellitus, Osteoporosis, 25-hydroxyvitamin D, Bone Mineral Density, Body Mass Index
指标 | 正常组 (n=138) | 超重组 (n=165) | 肥胖组 (n=35) | H/χ2值 | P值 |
|---|---|---|---|---|---|
年龄(岁) | 59.18±5.70 | 59.17±5.23 | 59.03±5.07 | 0.507 | 0.776 |
女性[n(%)] | 72 (52.2) | 81 (49.1) | 25 (71.4) | 7.415 | 0.025 |
BMI (kg/m2) | 22.22±1.68 | 25.04±0.77 | 32.02±2.67 | 274.488 | <0.001 |
25(OH)D(ng/mL) | 19.13±9.12 | 26.12±9.39 | 37.73±3.19 | 88.107 | <0.001 |
HbA1c | 8.17±1.71 | 8.21±1.72 | 7.86±1.84 | 1.489 | 0.475 |
腰椎T值 | -3.13±0.59 | -2.92±0.56 | -2.65±0.49 | 19.377 | <0.001 |
股骨颈T值 | -3.26±0.73 | -3.00±0.56 | -2.75±0.38 | 22.749 | <0.001 |
全髋T值 | -2.96±0.70 | -2.89±0.66 | -2.46±0.50 | 16.019 | <0.001 |
空腹胰岛素 | 4.40±1.25 | 5.22±1.48 | 6.86±1.26 | 71.325 | <0.001 |
空腹C肽 | 1.66±0.31 | 1.82±0.31 | 2.24±0.24 | 79.310 | <0.001 |
HOMA-IR | 3.92±0.80 | 3.58±0.82 | 2.82±0.35 | 55.695 | <0.001 |
HOMA-β | 46.79±10.01 | 53.72±11.08 | 66.02±7.14 | 80.337 | <0.001 |
BMI分层 | 部位 | 样本量 | β | 95%置信区间 | P值 |
|---|---|---|---|---|---|
正常组 | 腰椎 | 138 | 0.028 | 0.018~0.038 | <0.01 |
正常组 | 股骨颈 | 138 | 0.031 | 0.019~0.044 | <0.01 |
正常组 | 全髋 | 138 | 0.035 | 0.023~0.046 | <0.01 |
超重组 | 腰椎 | 165 | 0.021 | 0.012~0.030 | <0.01 |
超重组 | 股骨颈 | 165 | 0.028 | 0.020~0.036 | <0.01 |
超重组 | 全髋 | 165 | 0.040 | 0.031~0.049 | <0.01 |
肥胖组 | 腰椎 | 35 | -0.014 | -0.067~0.039 | 0.60 |
肥胖组 | 股骨颈 | 35 | -0.003 | -0.045~0.040 | 0.90 |
肥胖组 | 全髋 | 35 | 0.041 | -0.015~0.096 | 0.15 |
部位 | 交互项β | 95%置信区间 | P值 |
|---|---|---|---|
腰椎 | -0.000 | -0.002~0.001 | 0.76 |
股骨颈 | -0.001 | -0.003~0.001 | 0.23 |
全髋 | 0.002 | 0.000~0.004 | 0.02 |
变量 | β | 95%置信区间 | P值 |
|---|---|---|---|
25(OH)D | 0.031 | 0.024~0.037 | <0.01 |
| [1] | Hofbauer, LC, Busse, B, Eastell, R, et al. Bone fragility in diabetes: novel concepts and clinical implications. LANCET DIABETES ENDO. 2022; 10 (3): 207-220. |
| [2] | Alhowiti NM, Mackawy AMH, Al Wanian WM, et al. Type 2 diabetes mellitus and osteoporosis: site-specific bone mineral density variations and metabolic correlations in postmenopausal Saudi women [J]. Medicina (Kaunas), 2025, 61(5): 789. |
| [3] | Jiang, L, Song, X, Yan, L, et al. Molecular insights into the interplay between type 2 diabetes mellitus and osteoporosis: implications for endocrine health. FRONT ENDOCRINOL. 2024; 15 1483512. |
| [4] | Ferrari SL, Abrahamsen B, Napoli N, et al. Diagnosis and management of bone fragility in diabetes: an emerging challenge. Osteoporos Int. 2018; 29(12): 2585-2596. |
| [5] | Chakhtoura M, Bacha DS, Gharios C, et al. Vitamin D supplementation and fractures in adults: an umbrella review of randomized controlled trials [J]. J Clin Endocrinol Metab, 2022, 107(3): 882-898. |
| [6] | Sim G, Kim Y, Lee SM, et al. Role of vitamin D in prevention of type 2 diabetes mellitus: A systematic review and meta-analysis [J]. Exp Ther Med, 2024, 28(6): 451. |
| [7] | Barbarawi M, Zayed Y, Barbarawi O, et al. Effect of vitamin D supplementation on the incidence of diabetes mellitus [J]. J Clin Endocrinol Metab, 2020, 105(8): 2857-2868. |
| [8] | Niroomand M, Fotouhi A, Irannejad N, et al. Does high-dose vitamin D supplementation impact insulin resistance and risk of development of diabetes? A randomized clinical trial [J]. Diabetes Res Clin Pract, 2019, 148: 1-9. |
| [9] | Turcotte AF, O'Connor S, Morin SN, et al. Association between obesity and risk of fracture, bone mineral density and bone quality: a systematic review and meta-analysis [J]. PLoS One, 2021, 16(6): e0252487. |
| [10] | Drincic AT, Armas LA, Van Diest EE, et al. Volumetric dilution, rather than sequestration best explains the low vitamin D status of obesity. OBESITY. 2012; 20 (7): 1444-8. |
| [11] | Allam H, Hasan H, AbuOdeh R, et al. Interplay of Vitamin D, Inflammation, and Bone Health in Emirati Patients with Type 2 Diabetes: A Cross-sectional Study Saudi J Med Med Sci. 2025; 13 (4): 260-269. |
| [12] | Hoffmann K, Bryl W, Bhongade B, et al. Vitamin D supplementation and selected metabolic parameters in patients with type 2 diabetes and obesity: a prospective observational study [J]. Front Endocrinol (Lausanne), 2026, 16: 1750040. |
| [13] | Brunetti G, Faienza MF, D'Amelio P, et al. Recent updates on diabetes and bone [J]. Int J Mol Sci, 2025, 26(17): 8140. |
| [14] | World Health Organization. Definition, diagnosis and classification of diabetes mellitus and its complications: report of a WHO consultation. Part 1: diagnosis and classification of diabetes mellitus [R]. Geneva: World Health Organization, 1999: 1-59. |
| [15] | 中华医学会骨质疏松和骨矿盐疾病分会, 章振林. 原发性骨质疏松症诊疗指南(2022) [J]. 中国全科医学, 2023, 26(14): 1671-1691. |
| [16] | 国家卫生健康委员会. 肥胖症诊疗指南(2024年版) [J]. 中国循环杂志, 2025, 40(1): 6-30. |
| [17] | International Diabetes Federation. IDF Diabetes Atlas [M]. 10th ed. Brussels: International Diabetes Federation, 2021: 1-141. |
| [18] | Sun H, Saeedi P, Karuranga S, et al. IDF Diabetes Atlas: global, regional and country-level diabetes prevalence estimates for 2021 and projections for 2045 [J]. Diabetes Res Clin Pract, 2022, 183: 109119. |
| [19] | Compston JE, McClung MR, Leslie WD. Osteoporosis. Lancet. 2019; 393(10169): 364-376. |
| [20] | Kanis JA, Norton N, Harvey NC, et al. SCOPE 2021: a new scorecard for osteoporosis in Europe. Arch Osteoporos. 2021; 16(1): 82. |
| [21] | Napoli N, Chandran M, Pierroz DD, et al. Mechanisms of diabetes mellitus-induced bone fragility. Nat Rev Endocrinol. 2017; 13(4): 208-219. |
| [22] | Schwartz AV, Vittinghoff E, Bauer DC, et al. Association of BMD and FRAX score with risk of fracture in older adults with type 2 diabetes. JAMA. 2011; 305(21): 2184-2192. |
| [23] | Shanbhogue VV, Hansen S, Frost M, et al. Bone disease in diabetes: another manifestation of microvascular disease?. Lancet Diabetes Endocrinol. 2017; 5(10): 827-838. |
| [24] | Bouillon R, Marcocci C, Carmeliet G, et al. Skeletal and Extraskeletal Actions of Vitamin D: Current Evidence and Outstanding Questions. Endocr Rev. 2019; 40(4): 1109-1151. |
| [25] | Pittas AG, Dawson-Hughes B, Sheehan P, et al. Vitamin D Supplementation and Prevention of Type 2 Diabetes. N Engl J Med. 2019; 381(6): 520-530. |
| [26] | Wang H, Chen W, Li D, et al. Vitamin D and Chronic Diseases. Aging Dis. 2017; 8 (3): 346-353. |
| [27] | Guo Y, Jiang S, Li H, et al. Obesity induces osteoimmunology imbalance: Molecular mechanisms and clinical implications. Biomed Pharmacother. 2024; 177: 117139. |
| [28] | Cho Y, Choi S, Yun YH, et al. Association between BMI variability and risk of fracture among Korean men and women: a population based study. Arch Osteoporos. 2021; 16(1): 67. |
APA Style
Yin, X., Sun, X., Gao, F., Yang, X., Guo, N., et al. (2026). Effect of Body Mass Index on the Relationship Between Serum 25-Hydroxyvitamin D and Bone Mineral Density in Patients With Type 2 Diabetes Mellitus and Osteoporosis. Science Research, 14(6), 419-425. https://doi.org/10.11648/j.sr.20261406.14
ACS Style
Yin, X.; Sun, X.; Gao, F.; Yang, X.; Guo, N., et al. Effect of Body Mass Index on the Relationship Between Serum 25-Hydroxyvitamin D and Bone Mineral Density in Patients With Type 2 Diabetes Mellitus and Osteoporosis. Sci. Res. 2026, 14(6), 419-425. doi: 10.11648/j.sr.20261406.14
@article{10.11648/j.sr.20261406.14,
  author = {Xiuping Yin and Xiao Sun and Fang Gao and Xinxin Yang and Ningning Guo and Guangya Wang},
  title = {Effect of Body Mass Index on the Relationship Between Serum 25-Hydroxyvitamin D and Bone Mineral Density in Patients With Type 2 Diabetes Mellitus and Osteoporosis},
  journal = {Science Research},
  volume = {14},
  number = {6},
  pages = {419-425},
  doi = {10.11648/j.sr.20261406.14},
  url = {https://doi.org/10.11648/j.sr.20261406.14},
  eprint = {https://article.sciencepublishinggroup.com/pdf/10.11648.j.sr.20261406.14},
  abstract = {Objective to explore the relationship between serum 25-hydroxyvitamin D [25 (OH)D] and bone mineral density (BMD) in patients with type 2 diabetes mellitus (T2DM) complicated with osteoporosis at different body mass index (BMI) levels, and to assess the modifying effect of BMI. Methods A total of 338 hospitalized patients with T2DM and osteoporosis from January 2021 to January 2024 were enrolled. According to BMI, patients were divided into normal-weight, overweight, and obese groups. Multiple linear regression analyses were performed with lumbar spine, femoral neck, and total hip T-scores as dependent variables and 25 (OH)D as the independent variable, adjusting for age, sex, and glycated hemoglobin (HbA1c). An interaction term between 25 (OH)D and BMI was included. Sensitivity analysis was conducted using the lowest T-score. Results In the normal-weight and overweight groups, 25 (OH)D was positively correlated with lumbar spine, femoral neck, and total hip T-scores, with the strongest correlation observed at the total hip. No significant correlation was found in the obese group. Interaction analysis indicated that BMI modified the association between 25 (OH)D and total hip T-score. The results of sensitivity analysis were consistent. Conclusion Serum 25 (OH)D is positively correlated with BMD in patients with T2DM complicated with osteoporosis. This association may be modified by BMI, being more evident in normal-weight and overweight patients but not statistically significant in obese patients.},
 year = {2026}
}
TY  - JOUR
T1  - Effect of Body Mass Index on the Relationship Between Serum 25-Hydroxyvitamin D and Bone Mineral Density in Patients With Type 2 Diabetes Mellitus and Osteoporosis
AU  - Xiuping Yin
AU  - Xiao Sun
AU  - Fang Gao
AU  - Xinxin Yang
AU  - Ningning Guo
AU  - Guangya Wang
Y1  - 2026/11/10
PY  - 2026
N1  - https://doi.org/10.11648/j.sr.20261406.14
DO  - 10.11648/j.sr.20261406.14
T2  - Science Research
JF  - Science Research
JO  - Science Research
SP  - 419
EP  - 425
PB  - Science Publishing Group
SN  - 2329-0927
UR  - https://doi.org/10.11648/j.sr.20261406.14
AB  - Objective to explore the relationship between serum 25-hydroxyvitamin D [25 (OH)D] and bone mineral density (BMD) in patients with type 2 diabetes mellitus (T2DM) complicated with osteoporosis at different body mass index (BMI) levels, and to assess the modifying effect of BMI. Methods A total of 338 hospitalized patients with T2DM and osteoporosis from January 2021 to January 2024 were enrolled. According to BMI, patients were divided into normal-weight, overweight, and obese groups. Multiple linear regression analyses were performed with lumbar spine, femoral neck, and total hip T-scores as dependent variables and 25 (OH)D as the independent variable, adjusting for age, sex, and glycated hemoglobin (HbA1c). An interaction term between 25 (OH)D and BMI was included. Sensitivity analysis was conducted using the lowest T-score. Results In the normal-weight and overweight groups, 25 (OH)D was positively correlated with lumbar spine, femoral neck, and total hip T-scores, with the strongest correlation observed at the total hip. No significant correlation was found in the obese group. Interaction analysis indicated that BMI modified the association between 25 (OH)D and total hip T-score. The results of sensitivity analysis were consistent. Conclusion Serum 25 (OH)D is positively correlated with BMD in patients with T2DM complicated with osteoporosis. This association may be modified by BMI, being more evident in normal-weight and overweight patients but not statistically significant in obese patients.
VL  - 14
IS  - 6
ER  -
Department of Endocrinology and Diabetes II, Cangzhou Central Hospital, Cangzhou, China

Information


 Share This Article
 Twitter
 Linked In
 Facebook

 Copy
 Download