Research Article | | Peer-Reviewed

Seasonal Rainfall Variability and Its Impact on Wheat Crop Production Over North Showa Zone, Amhara Region, Ethiopia

Received: 27 May 2025     Accepted: 18 June 2025     Published: 28 July 2025
Views:       Downloads:
Abstract

Rainfall play an important role in crop management and monitoring, as it directly influences planting calendar, irrigation needs, crop growth and yield outcomes. This study was attempted to analyze seasonal rainfall variability and its impact on wheat crop production to understand association of seasonal rainfall characteristics with wheat crop production over North Showa Zone Amhara Region. Both time series station and satellite gridded rainfall data sets were obtained from Ethiopian Meteorology Institute from 1985 to 2021. Wheat crop production for main rainy season (Meher) was obtained from Ethiopian Statistical Service from 2010-2021, collected from household farm association level. Analysis of rainfall data sets was provided with climate data tool (CDT V8), R studio and Microsoft excel and ArcGIS 10.8. Coefficient of variation, precipitation concentration index and Standardized anomaly index (SAI) were applied to analyze long year seasonal and annual rainfall variability. Man-Kendall trend analysis methods were applied for rainfall trend analysis. Correlation coefficient on the other side has been applied to analyze rainfall variability impact on wheat crop production. The findings of this paper indicate irregular variation of spring (Belg) rainfall, moderate to low variation in summer and annual rainfall over the study area. Using correlation and coefficient of determination (R²) analyses, significant spatial variability was observed in the rainfall-crop relationship. Strong positive correlations were found in districts such as Ensaro (r = 0.7, R² = 0.4384) and Tarmaber (r = 0.7, R² = 0.5223), where over 40% and 50% of the variability in wheat production can be attributed to rainfall, respectively. Conversely, weaker correlations were evident in areas like Mojana Wodera (r = 0.5, R² = 0.2049), and Ankober (r = -0.3, R² = 0.097), suggesting that in these districts, rainfall plays a less dominant role in determining crop production, with other factors such as soil fertility and agricultural practices possibly having a greater influence.

Published in Advances in Applied Sciences (Volume 10, Issue 3)
DOI 10.11648/j.aas.20251003.12
Page(s) 45-64
Creative Commons

This is an Open Access article, distributed under the terms of the Creative Commons Attribution 4.0 International License (http://creativecommons.org/licenses/by/4.0/), which permits unrestricted use, distribution and reproduction in any medium or format, provided the original work is properly cited.

Copyright

Copyright © The Author(s), 2025. Published by Science Publishing Group

Keywords

Wheat Crop Production, Seasonal Rainfall Variability, North Showa Zone, Amhara Region, Ethiopia

1. Introduction
Rainfall is a dominant climatic factor that affects agricultural production through its impact on the timing of agricultural operations. The timing of agricultural operation directly depends on the onset and cessation of seasonal rainfall mostly (summer and spring) seasons. Rainfall changes and its threats to food security and sustainable development are stronger in poorer regions of the world. Delayed onset of the rains, early withdrawal, or short but intense rainfall events separated by long dry spells are the cause of rainfall failure . Rainfall is one of the main climatic variables that influence both the spatial and temporal patterns of water availability for agriculture and food security and most of African countries 85% of population is defendant on rain-fed agriculture .
Rainfall patterns such as intensity, onset, secession and length of season change with nature of geographical region, topography and season . The importance of the past, present and future scenarios of rainfall onset is to guide in identifying the best planting dates in future, especially expected late-onset, delayed cessation in the region under 1.5°C and 2°C Global Warming levels . In Ethiopia rainfall is the main important climate parameter. 85% of labour force in Ethiopia is employed in rain-fed agriculture which highly depends on varying amounts of rainfall availability vital for crop production .
In Ethiopia, an onset and cessation of seasonal rainfall vary considerably within few kilometers distance due in case of altitudinal variations, orientation of mountain chains and their physical influenceon atmospheric flow . Spatio-temporally Ethiopia is well-known for its high rainfall variability due to geographical location and topographic complications . The risk related to climate variability poses a direct impact from the start of land preparation to the last harvest . The erratic rainfall patterns, including onset and cessation dates and spreading of rainfall, govern crop yields and regulate the choice of the crops to grow . Kiremt account for 65-95% of Ethiopia from total rainfall .
Amhara region is characterized by unpredictable rainfall, great land degradation, and a high degree of poverty, erratic rainfall patterns, and frequent dangerous events reason to crop failure and threaten the food safety and livelihoods of the people in the area . Accurate information on the onset and cessation of seasonal rainfall have the capability to reduce the risks and costs of re-sowing seeds due to the season’s false onset . North showa zone is one of the 11 zones found in the Amhara region with varying rugged topography reflecting high climate variability of the main concern on rainfall variability relating its impact on major crop . Onset-date of rainy season is the date at which the available water content of the root zone at the beginning of the cropping season reaches 50% .
Therefore, this study was planned to analyze seasonal rainfall variability and its impact on wheat crop production over North Showa zone of Amhara region. Major crops grown over this zone are Wheat, Beans, barley, teff, lintel and others. For this study wheat crop is selected to characterize as the major crops growing in the main (summer) rainy season. Regression analysis was is preferred to characterize the correlation between seasonal rainfall variability and wheat crop production.
2. Methodology
2.1. Description of the Study Area
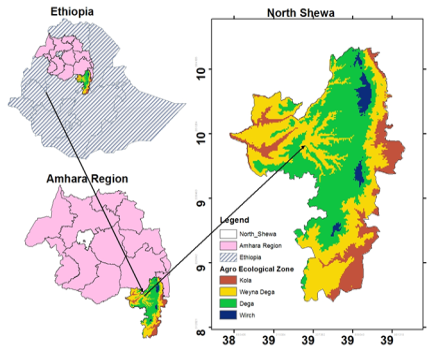
Figure 1. Map of Study Area.
North Shewa Zone is one of the eleven zones in Amhara Regional State, Ethiopia. This Zone is bordered on the south and the west by the Oromia Region, on the North by South Wollo, on the Northeast by the Oromia Zone, and on the east by the Afar Region. The region is distinguished by highly complex topography in the northern and central highlands. The highest point in this Zone is Mount Abuye Meda (4012 meters); other prominent peaks include Mount Megezez . The topography comprises uneven and ragged mountainous highlands in the northern and central part of the zone, extensive plains and also deep gorges and cliffs in the periphery as shown Figure 1. North Shewa Zone climate extends from semi-desert lowlands in the south, west and east periphery to cold high mountainous part in the center with extreme ranges of temperature and rainfall. The movement of the inter-tropical convergence zone (ITCZ) and the influence of the Indian Monsoon throughout the year, mainly determine the climate pattern of the zone . The annual average rainfall varies between 400-700 mm and the annual average temperature ranges between 8 to 35.7°C .
According to rainfall pattern over North Showa zone is bimodal but often unreliable due to erattic nature of Belg rainfall. High rainfall and low temperature over the Wurch and Dega area in the central part of North Shewa Zone and low rainfall, high temperature over the low land’s periphery of south, west and east of the study area. Based on its elevation traditionally study area is characterized by four agro-ecological zones mostly 42.53% Dega, 34.3% Weynadega, 21.72% Kola and only 1.45% of Wurch as shown in table 1. As shown in table 1 below most parts of the zone are hilly or mountainous, but there are some plains. The topographic feature of the administration zone range from 927 m. a. s. l in south, west and East peripheries and 2450 m. a. s. l in the central part of the zone . The study area is characterized by quasi-double maxima rainfall pattern, with a small peak in April and maximum peak in August .
Table 1. Traditional Agroecology Zones of study Area.

grid code

TAEZ_Class (m)

Area in Hectares

Area Distribution (%)

1

Kola (500-1500)

779611.60

21.72

2

Weynadega (1500-2300)

1231298.75

34.30

3

Dega (2300-3200)

1526914.74

42.53

4

Wurch (>3200)

52064.88

1.45

Total Area=3589890 ha

2.2. Data
This study involved rainfall and crop yield data sets. Daily and monthly rainfall data sets were collected from Ethiopian Meteorology Institute. For this study station and 4 km x 4 km daily gridded rainfall data were used from Ethiopian Meteorology Institute (EMI) from 1985-2020. Gridded rainfall data set were used as data gap filler for respective station rainfall and for indication of spatial analysis such as climatology. Fourteen meteorological stations were selected based on data availability, quality and relative length of time and geographic location considering fair distribution of stations throughout the study area. Stations selected for this study were based on missing data less than 20% of the given period.
Crop yield data from 2010-2021 was collected from Ethiopian statistical Services survey emanated from house hold level mostly from farmer associations. Selection of crop data was implemented based on rainfall influence of wheat for main (summer) season to analyze the impact of temporal variability of onset and cessation pattern of seasonal rainfall on their growth and yield. For the given zone main (Kiremt) rainfall is the main source of water for major cereal crops.
2.3. Methods
Rainfall and Crop yield Variability analysis: Standardized anomaly index, precipitation concentration index and coefficient of variation, correlation and Regression based wheat production relation will be used as descriptors of rainfall variability with crop production. Standardized Anomaly Index (SAI) is calculated as the difference between the annual total of a particular year and the long term average rainfall records divided by the standard deviation of the long term data. This index is used to examine the nature of the trends and enables the determination of the dry and wet years in the record. Its formula is given as
(1)
Where Xi is the annual rainfall of the particular year; X is the long-term mean annual rainfall throughout observation and σ is the standard deviation of annual rainfall throughout the observation. SAI value classification is presented in table 2.
Table 2. SAI Classification.

SAI Value

Category

Above 2.0

Extremely Wet

1.5 to 1.99

Very Wet

1.0 to 1.49

Moderately Wet

-.99 to .99

Near Normal

-1.0 to -1.49

Moderately Dry

-1.5 to -1.99

Severely Dry

-2 or less

Extremely Dry

SAI = standardized anomaly index.

Coefficient of variation (CV): The variability of rainfall is computed by using the coefficient of variation. The values of coefficient of variation show the change from the mean values of rainfall. The formula for the coefficient of variation:
CV=SX̅×100(2)
Where S is standard deviation andX̅is mean
Table 3. Index of Coefficient of Variation.

CV values

Class of variability

< 20%

Low variability

20% - 30%

Moderately variability

>30%

High variability

CV = coefficient of variation

Precipitation Concentration Index (PCI): is a measure of comparative distribution. It is a means to signify the spatial variability of rainfall patterns. PCI is rainfall concentration in terms of distribution and variability and can be expressed using the following equations.
PCIannual= i=112Pi2(i=112Pi)2*100(3)
PCIseasonal=i=14Pi2(i=14Pi)2* 33
Table 4. PCI Value and Classification.

PCI Value

Category

Below 10

Uniform precipitation distribution

11-15

Moderate rainfall concentration

16-20

An irregular distribution

Above 20

A strong irregular precipitation distribution.

PCI = precipitation concentration index.

Correlation and Regression:- Correlation and regression analysis applies to examine relationships between monthly and seasonal rainfall and crop yields . The patterns of inter-annual rainfall variability and fluctuations in cereal production are also presented graphically to gain a better insight into rainfall-crop production relationships in the region. Its Correlation is a statistics that describes the association between two variables. The correlation statistic can be used for continuous variables or binary variables or a combination of continuous and binary variables. In contrast, t-tests examine whether there are significant differences between two group means. It is often used in hypothesis testing to determine whether a process or treatment actually has an effect on the population of interest, or whether two groups are different from one another. The Pearson correlation method is the most common method to use for numerical variables; it assigns a value between - 1 and 1, where 0 is no correlation, 1 is total positive correlation, and - 1 is total negative correlation. The formula for the t-test for correlation coefficient as shown in equation (4) below:
t=n-21-r2r(4)
Standardized Precipitation Index (SPI): The Standardized Precipitation Index is the number of standard deviations that observed cumulative precipitation deviates from the climatological average. It can be calculated for any time scale; various monthly and multi-monthly time scales. To compute the index, a long-term time series of precipitation accumulations over the desired time scale are used to estimate an appropriate probability density function. The associated cumulative probability distribution is then estimated and subsequently transformed to a normal distribution. The SPI indicator, which was developed by and described in detail measures precipitation anomalies at a given location, based on a comparison of observed total precipitation amounts for an accumulation period of interest (e.g. 1, 3, 12, 48 months), with the long-term historic rainfall record for that period. The historic record is fitted to a probability distribution (the “gamma” distribution), which is then transformed into a normal distribution such that the mean SPI value for that location and period is zero. For any given region, increasingly severe rainfall deficits (i.e., meteorological droughts) are indicated as SPI decreases below ‒1.0, while increasingly severe excess rainfall are indicated as SPI I increases above 1.0. The World Meteorological Organization has recommended that the SPI be used by all National Meteorological and Hydrological Services around the world to characterize meteorological droughts .
SPI= x-x̅δ (5)
Where x is precipitation for the station
x̅= Mean precipitation, δ =Standard Deviation
Table 5. SPI, Drought Classification (McKee et al 1993, 1995).

SPI value

Classification

2.0 or more

Extremely wet

1.5 to 1.99

Very wet

1.0 to1.49

Moderately wet

-0.99 to 0.99

Near normal

-1 to -1.49

Severely dry

-2.0 and less

Extremely dry

2.4. Rainfall Variability and Crop Production Trend Analysis
The Mann-Kendall statistical test for trend is used to assess whether a set of data values is increasing over time or decreasing over time, and whether the trend in either direction is statistically significant. Trends, for all the period, were calculated using the Mann-Kendall test is calculated by the equation:
S=i=1n-1j=i+1nsgnxj-xi(6)
In equation (6) above n denotes the number of data points, sgnxj-xi is sign function and xjand xi are time series in the j and i where (j>i).
sgnxj-xi=+1 if xj-xi>00 if (xj-xi)=0 -1 if xj-xi<0(7)
and the variance will be computed as
VarS=nn-12n+5-i=1pti(ti -1)(2ti+5)18(8)
In equation (8) n denotes number of data points, p stands for the number of tide groups and ti stands for number of data values. Standard normal test statistics Zs will compute with the equation:
Zs=s-1VarS  if S>00 if S=0s+1VarS  if S<0    (9)
This test detects the presence of a monotonic tendency in a chronological series of a variable (rainfall and Selected crops). It is a nonparametric method; that is, it makes no assumptions about the underlying distribution of the data, and its rank-based measure is not influenced by extreme values. This method mainly gives three types of information: Kendall Tau, or Kendall rank correlation coefficient, measures the monotony of the slope, Kendall's Tau varies between - 1 and 1; it is positive when the trend increases and negative when the trend decreases, the Sen slope, which estimates the overall slope of the time series. This slope corresponds to the median of all the slopes calculated between each pair of points in the series. The trend is statistically significant when the p-value is less than 0.05. Every value is compared to every value preceding it in the time series, which gives a total of n (n - 1) / 2 pairs of data, where n is the number of observations in the set. P value < 0.05 tells that there is (monotonic) trend and if τ is +ve, increasing trend, P value > 0.05, tells no monotonic trend, away from monotonic trend.
3. Results and Discussions
3.1. Missing Station Rainfall Data Sets
This paper addresses the methodology for filling missing rainfall data for specific dates using ENACTS (Enhanced National Climate Services) gridded data, ensuring the accuracy and reliability of the dataset. Selection Criteria for Stations includes Stations with missing values exceeding 20% of the data for the given period were excluded in other word only stations with less than 20% missing data were considered for analysis. ENACTS data is used to fill missing rainfall data for specific dates. This data is sourced from the Ethiopian Meteorology Institute.
4km by 4 km, covering the period from 1985 to 2020. A validity test was conducted to compare the gridded data with actual station data. This comparison demonstrated strong performance metrics, indicating the reliability of the gridded data for filling in the missing values. The comparison between the ENACTS gridded data and station point data is summarized in Table 6. The statistical metrics indicating the performance of the gridded data includes a correlation coefficient of 0.942 indicates a very high positive correlation between the gridded data and station data, suggesting strong agreement. A Bias value of 0.902 suggests that the gridded data slightly underestimates the rainfall values compared to the station data. Brier Skill Score (BR2) value of 0.795 shows good skill in predicting the correct rainfall amounts, further supporting the gridded data's reliability.
The high resolution and extended period covered by the dataset, along with the strong statistical performance metrics, validate its use in the study area. The methodology ensures that the resulting dataset maintains high accuracy and reliability, crucial for various applications in climate and hydrological applications using Climate date Tool (CDT) .
Table 6. Validation of Spatial daily Rainfall (1985-2020).

Name

Statistics

Description

Perfect. Score

CORR

0.942

Correlation

1

BR2

0.795

Coefficient of determination (R2) multiplied by the regression slope

1

BIAS

0.902

Bias

1

ME

-0.316

Mean Error

0

RMSE

1.85

Root Mean Square Error

0

NSE

0.884

Nash-Sutcliffe Efficiency

1

MNSE

0.766

Modified Nash-Sutcliffe efficiency

1

The scatter plot in Figure 2 shows a high degree of correlation between the gridded and station point rainfall datasets. This high correlation visually confirms the reliability of using the ENACTS gridded data to fill in the missing values. Points are closely clustered along the 1: 1 line, indicating that the gridded data is in strong agreement with the station data, further supporting the quantitative correlation coefficient of 0.942.
The cumulative density function (CDF) map in Figure 2 also proves the spatial average performance of the gridded data. Both the gridded data and station data closely follow the CDF curve, approaching unity, which represents a perfect score. The CDF shows that the distribution of rainfall values in the gridded data matches well with the distribution observed in the station data across the spatial domain, indicating that the gridded data can accurately replicate the observed rainfall patterns. By integrating these methods and tools, the study robustly supports the use of ENACTS gridded data for filling missing rainfall data, ensuring comprehensive and accurate climate datasets.
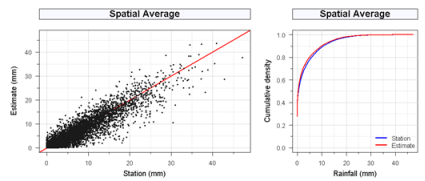
Figure 2. Scatter plot and CDF (Station Vs Estimate).
3.2. Rainfall Variability
3.2.1. Seasonal Patterns of Rainfall
There was a spatio-temporal variation in the mean seasonal and annual rainfall on different parts of the study area suggests rainfall patterns varied both in space (across different locations) and in time (across different seasons and years). The mean annual rainfall varies from 868.9 mm with a standard deviation of 120.93 mm at Mehal Meda station to 1853.875 mm with a standard deviation of 450.5 mm at Debre Sina station. Similarly, the main rainy season (Kiremt) mean rainfall ranges from 315.46 mm with a standard deviation of 127.88 mm at Mehal Meda to 1084.524 mm with a standard deviation of 285.91 mm at Debre Sina station. The long-term mean Belg rainfall varies from 150 mm with a standard deviation of 71.50 mm at Jihur station to 452.658 mm with a standard deviation of 197.15 mm at Debre Sina station, as shown in Table 7. Similarly, the long-term Bega spatial rainfall ranges from 33 mm with a standard deviation of 25 mm to 218.5 mm with a standard deviation of 228 mm at Debre Sina station.
Spatially, the mean annual rainfall total ranges from 400 mm to 1800 mm, the Kiremt mean total ranges from 200 mm to 1200 mm, Belg mean total rainfall ranges from 100 mm to 400 mm, and the Bega season rainfall ranges from 20 mm to 220 mm, as shown in Figure 3.
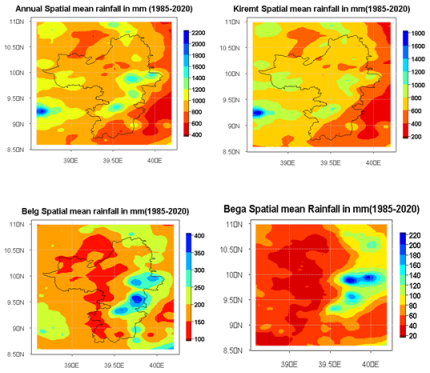
Figure 3. Annual and Seasonal Averages Spatial Rainfall Distribution.
The rainfall variability showed low annual and Kiremt variability (CV<20%) at stations like Debrebirhan, Deneba, Enewari, Jihur, MehalMeda, and Mendida, as indicated by the coefficient of variation in Table 7 below. Seladingay station exhibited exceptionally low annual rainfall variability with a CV of 19.6% (CV<20%) and moderate Kiremt rainfall variability with a CV of 26.98%. Stations such as Alem Ketema, Aluamba, and Mezezo showed high annual rainfall variability (CV>30%). Moderate annual and Kiremt rainfall variability (CV = 20-30%) was observed at stations like Chacha, Debresina, and Lemi. An exceptional case was Ataye station, which showed moderate annual rainfall variability (CV=26.071%) and high Kiremt rainfall variability (CV=36.065%).
On the other hand, both station-level and spatial-level Belg and Bega rainfall showed high variability, with coefficients of variation ranging from 30-95% and 50-120%, respectively, as shown in Table 7. and Figure 4. This implies more inter-annual variability of spring and Bega season rainfall than summer and annual rainfall. The results of this study align with the findings of those reported that less variability of rainfall was observed in the summer season compared to other seasons in different parts of Ethiopia. Areas with low mean rainfall generally exhibit high rainfall variability . Except for the Efeson (Ataye) and Mezezo stations, this showed high variability of Kiremt rainfall. Most stations exhibited low to moderate variability. Overall, seasonal rainfall variability was higher than annual variability. The results also consistent with those of in central Ethiopia .
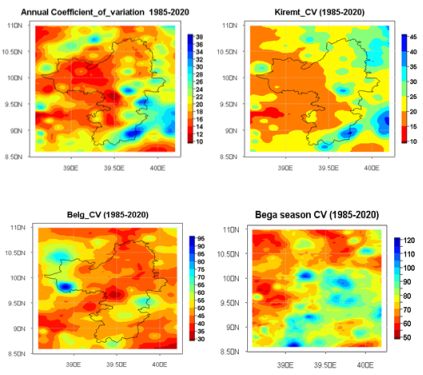
Figure 4. Spatial Rainfall Coefficient of Variation.
Table 7. Rainfall Coefficient of Variation (1985-2021).

Station

Bega

Belg

Kiremt

Annual

CV (%)

Std

Mean

CV (%)

Std

Mean

CV (%)

Std

Mean

CV (%)

Std

Mean

AlemKetema

209

138

66

62

105

171

27

243

373

32

359

1129

AliyuAmba

98

170

173

69

271

384

28

206

721

30

392

1294

Ankober

82

156

191

53

238

431

26

250

957

22

347

1580

Chacha

163

55

34

68

95

137

26

193

756

23

216

929

DebreBerhan

89

34

39

33

52

158

15

112

739

11

104

938

DebreSina

104

321

310

43

197

453

26

286

1085

24

451

1854

Deneba

80

32

40

48

89

184

16

124

328

17

170

978

Efeson

81

91

113

45

115

36

247

26

275

1055

Eneware

77

29

37

49

91

187

20

166

821

18

190

1055

Jihur

106

30

28

47

72

150

19

137

707

15

131

886

Lemi

79

32

41

123

307

251

26

258

488

30

386

1289

MehalMeda

71

32

45

40

69

172

20

128

315

14

121

869

Mendida

110

56

51

37

65

173

20

153

774

16

160

999

Mezezo

79

183

232

59

239

400

39

436

1038

35

614

1750

Seladingay

75

48

64

40

67

166

24

215

917

20

221

1128

3.2.2. Precipitation Concentration Index (PCI)
The table 8 provides an analysis of precipitation distribution patterns using the Precipitation Concentration Index (PCI) across various stations in the study area, segmented into three time periods: Annual, Kiremt (main rainy season), and Belg (secondary rainy season). The data illustrates a uniform precipitation distribution pattern during the Belg season. All stations exhibit relatively consistent PCI values ranging from 9.0% to 9.6%, indicating that rainfall is evenly spread across this period. During the Kiremt season, the PCI values show moderate rainfall concentration at all stations. The values range from 10.8% to 12.2%, suggesting that while there is some variability, rainfall distribution is still relatively moderate and does not exhibit extreme concentration.
The analysis of annual PCI values presents a more varied picture for example Stations such as Aluamba, Ankober, Debresina, and Mezezo show moderate rainfall distribution with PCI values below 20%, indicating a relatively even spread of rainfall throughout the year. Stations like Ataye (Efeson) and Seladingay exhibit irregular precipitation distribution, with PCI values of 16.8% and 18.3% respectively, indicating less consistency in rainfall distribution. On the other side Stations including Alem Ketema, Chacha, Deneba, Enewari, Jihur, Lemi, Mehal Meda, and Mendida have PCI values exceeding 20%, indicating a strongly irregular annual rainfall distribution. This suggests that these areas experience periods of heavy rainfall followed by dry spells, rather than a more balanced distribution throughout the year. The findings of this study align with previous research conducted by other scholars those reported similar patterns of rainfall distribution in different parts of the Amhara and Oromia regions of West Hararge zone.
The uniform precipitation distribution in the Belg season, moderate concentration in the Kiremt season, and the varied annual rainfall distribution patterns highlight the complexity and regional variability of rainfall in the study area. The strongly irregular annual rainfall distribution in several stations underscores the challenges in water resource management and agricultural planning in these regions. This study's consistency with prior research underscores its relevance and contributes to a broader understanding of precipitation patterns in Ethiopia.
Table 8. Precipitation Concentration Index.

Station

PCI (%)

Annual

Kiremt

Belg

Alem Ketema

21.5

10.8

9.2

Aluamba

13.4

10.9

9

Ankober

14.5

11

9.1

Chacha

23

11.6

9.3

Debrebirhan

22.1

11.6

9.5

Debre Sina

15.1

10.8

9.4

Deneba

21.5

11.1

9.2

Efeson (Ataye)

16.8

12.2

9.6

Enewari

22.2

11.2

9.3

Jihur

22.1

11.2

9

Lemi

23

11.5

9.3

Mehal Meda

21.4

11.9

9.2

Mendida

23.1

11.6

9.1

Mezezo

15.1

10.8

9.5

Seladingay

18.3

11.1

9.3

3.2.3. Seasonal and Annual Rainfall Anomaly
The annual Standardized Anomaly Index (SAI) varies significantly across different stations and years. At Mezezo station, the SAI reached a high of +3.18 in 1997, indicating very wet conditions, while Jihur station recorded a low of -3.13 in 2009, signifying extremely dry conditions. For the Kiremt season, the SAI ranged from +2.81 at Efeson (Ataye) station in 2014 (very wet) to -2.97 at Jihur station in 1987 (extremely dry).
The Belg season showed an even more dramatic variation, with the SAI peaking at +4.97 at Lemi station in 1987 (wettest) and plummeting to -2.2 at Debrebirhan station in 2009 (extremely dry). Figure 5 illustrates that 1987 experienced the highest negative (extremely dry) Kiremt rainfall anomaly. This extreme dryness was largely attributed to the occurrence of El Niño, which significantly impacted Kiremt rainfall that year.
Major droughts in Ethiopia in 1957, 1965, 1973, 1983-84, 1987, and 1993-94 occurred following El Niño events. Similarly, 2015 experienced severe drought conditions due to El Niño. The Standardized Rainfall Anomaly (SRA) was used to determine inter-annual rainfall fluctuations across various stations.
The standardized Anomaly index (SAI) of rainfall results indicated that the proportion of annual negative anomalies ranged from 44.4% at Debrebirhan to 61.1% at Aluamba. For the Kiremt season, negative anomalies varied between 38.9% at Jihur and 58.3% at Aluamba, while Belg season negative anomalies ranged from 50% at Deneba to 63.9% at Mezezo. These percentages are based on data from the selected stations during the period from 1985 to 2020 Figure 5.
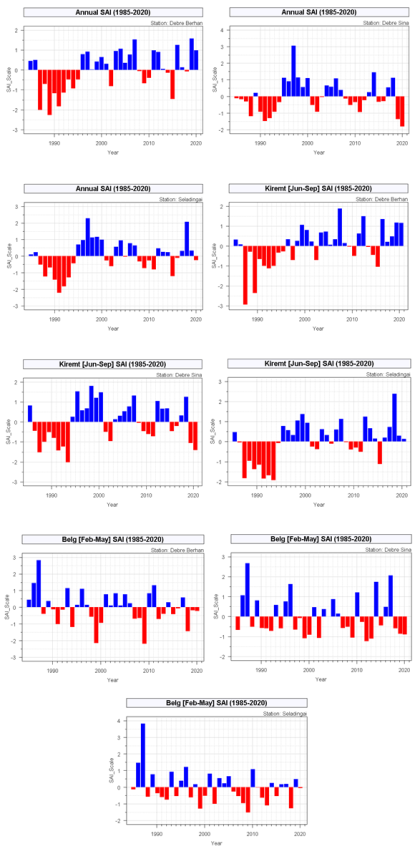
Figure 5. Annual and Seasonal Rainfall Standardized Anomaly (SAI) of selected stations.
3.3. Rainfall Trend Analysis
Annual and Seasonal Rainfall Trends
The trends of seasonal and annual rainfall were analyzed over a 37-year period (1985-2021) across 14 meteorological stations in the study area. The station data were carefully selected, ensuring that missing values did not exceed 20% of the total data for each station. The trend analysis was conducted using the Mann-Kendall trend test statistics (Z). A positive Z value indicates an increasing trend, while a negative Z value indicates a decreasing trend. Additionally, Kendall's Tau was used to compare the results, with values ranging and 1; a positive value corresponds to an increasing trend, while a negative value corresponds to a decreasing trend.
Trends were considered statistically significant when the p-value was less than 0.05, whether the trend was increasing or decreasing. Based on the results, the Bega rainfall trends exhibited non-significant increasing trends at stations such as Alem Ketema, Lemi, Mendida, and Seladingay, while the remaining stations, as illustrated in Figure 6, showed non-significant decreasing trends for the Bega season rainfall. The trends for Belg, Kiremt, and annual rainfall are summarized in Table 9, and the graphical plots for all seasonal rainfall are presented sample stations in Figure 6 below.
For the Belg season, the study area demonstrated significantly decreasing trends at the Alem Ketema and Ankober stations, while non-significant trends were observed at the remaining stations. In contrast, the Kiremt season exhibited significant increasing trends in rainfall at stations including Ankober, Debre Berhan, Enewari, Jihur, Lemi, Mehal Meda, Mendida, Mezezo, and Seladingay. Stations such as Alem Ketema, Debre Sina, and Deneba showed non-significant increasing trends in Kiremt rainfall. Conversely, Aliyu Amba displayed significantly decreasing trends for both Kiremt and annual rainfall, while Chacha exhibited non-significant decreasing trends for these parameters
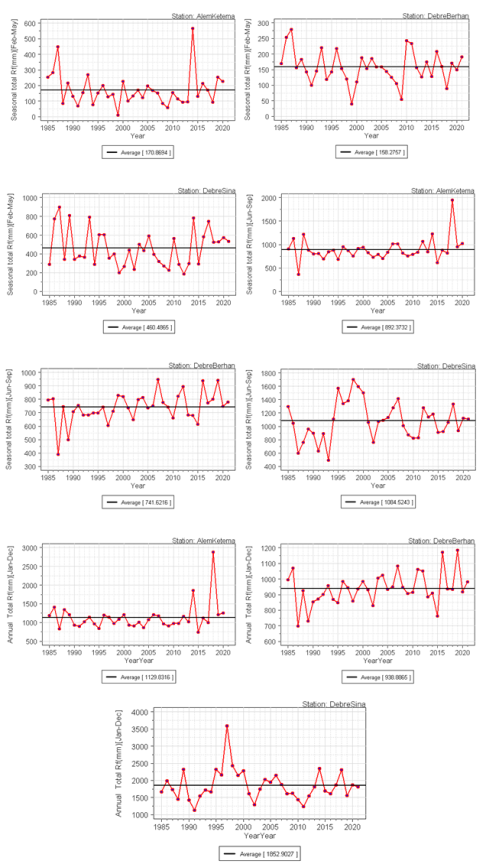
Figure 6. Rainfall Trend for selected sample stations (Belg, Kiremt and Annual).
On an annual basis, the stations at Alem Ketema, Deneba, Jihur, and Mezezo exhibited non-significant increasing trends, while Debre Berhan, Enewari, Mehal Meda, Mendida, and Seladingay showed significantly increasing trends. Stations like Ankober, Chacha, and Debre Sina reflected non-significant decreasing trends, with Aliyu Amba showing a significant decreasing trend in annual rainfall. The analysis highlights variability in seasonal and annual rainfall across the study area, offering critical insights into long-term climate patterns and their implications for agriculture and water resource management.
Table 9. Man Kendall Trend Test (1985-2021).

Station

Kiremt

Belg

Annual

Zs

P-value

Tau

Sen's slope

Zs

P-value

Tau

Sen's slope

Zs

P-value

Tau

Sen's slope

Alemketema

1.93

0.05

0.12

3.10

-0.94

0.35

-0.06

-0.75

0.99

0.32

0.08

1.82

Alyiuamba

-8.49

0.00

-0.26

-7.98

-4.85

0.00

-0.38

-11.32

-9.20

0.00

-0.46

-24.88

Ankober

5.02

0.00

0.27

9.68

-8.01

0.00

-0.31

-9.39

-1.08

0.28

-0.07

-2.53

Chacha

-0.45

0.66

-0.45

0.66

2.94

0.00

-0.17

-2.12

-1.96

0.05

-0.08

2.29

DebreBerhan

4.90

0.00

0.22

3.20

-0.90

0.37

-0.05

-0.49

5.42

0.00

0.20

2.76

DebreSina

1.09

0.28

0.08

3.00

-1.19

0.23

-0.07

-1.81

-0.27

0.79

-0.02

-0.61

Deneba

0.28

0.78

0.02

0.32

0.93

0.35

0.04

0.64

0.67

0.50

0.03

0.63

Eneware

5.86

0.00

0.30

6.64

3.82

0.00

0.19

2.34

5.87

0.00

0.30

7.79

Jihur

2.37

0.02

0.12

1.65

-1.74

0.08

-0.09

-0.74

1.14

0.25

0.08

1.47

Lemi

2.76

0.01

0.12

3.23

-0.30

0.77

-0.02

-0.26

0.00

1.00

0.00

0.06

MehalMeda

2.90

0.00

0.24

3.45

-2.52

0.01

-0.10

-0.99

3.18

0.00

0.20

3.45

Mendida

4.67

0.00

0.25

5.37

-1.82

0.07

-0.08

-0.93

3.91

0.00

0.22

5.53

Mezezo

2.42

0.02

0.17

8.34

-1.39

0.16

-0.09

-2.30

1.67

0.10

0.13

7.25

Seladingai

5.98

0.00

0.28

7.44

-0.19

0.85

-0.02

-0.13

3.22

0.00

0.17

4.73

3.4. Wheat Crop Yield in North Showa Zone, Amhara Region
3.4.1. Kiremt (Meher) Season Wheat Yield
The Meher wheat yield across different districts (Woreda) from 2010 to 2021 showed significant variability both across years and between districts. The Meher (Main) Season Crop, which refers to any temporary crop harvested between Meskerem (September) and Yekatit (February), is the primary season for wheat production in most of the study area. During this period, the average wheat yield ranged from a low of 13.8 quintals per hectare in Ankober to a high of 33.8 quintals per hectare in Minjar-Shenkora, with an overall regional mean yield of 20.6 quintals per hectare. The standard deviation (STDV) reflects the degree of variation in wheat yield within each district. Ankober showed lower variability with an STDV of 7.41, while Minjar-Shenkora exhibited higher variability with an STDV of 9.91. The coefficient of variation (CV), which provides a measure of relative variability, was highest in Merahbete (72.4%) and lowest in Tarema Ber (24.05%).
The annual data reveals considerable fluctuations in yields. For example, the lowest recorded yield was in Merahbete district in 2011, with only 2.5 quintals per hectare, while the highest yield was recorded in Minjar-Shenkora district in 2018, with 52.6 quintals per hectare. These fluctuations reflect the varying climatic conditions, management practices, and other factors influencing wheat production across different years and regions shown in table 10 below.
Table 10. Annual Meher wheat Yield (Q/ha) 2010-2021.

Year

Merahbete

Ensaro(Lemi)

Moretna Jiru

Menz Gera Midir

Tarema Ber

Mojana Wodera

Angolelana Tera

Minjar Shenkora

Ankober

Basona Worena

Siya Debirna Wayu

2010

6.1

17.3

4.2

10.3

13.3

11.2

13.1

21.7

5.3

16.4

18.3

2011

2.5

7.0

14.9

8.4

9.1

20.7

9.5

34.7

2

32

4.7

2012

9

13.8

4.8

12.7

12.5

19

20.3

30.5

7.8

20.2

4.5

2013

12.5

11.6

13.2

18

11.7

14.6

15.8

31.4

8.3

19.7

12.7

2014

15.9

19.2

11.2

32.1

18.3

26.3

15.1

33.7

13.1

27.6

13.1

2015

22.6

19.3

10

14.9

11.7

24.1

38.3

41.9

18

20.8

17.4

2016

12.9

7.4

17.7

17.1

12.2

27.4

25.7

19

18.7

25.6

29

2017

10.1

6.3

5.5

13.9

15.2

23.9

25.5

43.8

13.1

29.5

31

2018

15.9

19.5

29.5

12.4

29.2

29.2

29.4

52.6

29.2

17.6

33.7

2019

8.4

31.8

23.7

18.6

16.9

22

47.1

21.4

12.9

23.5

45.8

2020

31.5

23.9

37.4

16.7

33.1

20.1

31.3

37.8

18.4

22.3

42.7

2021

43

30.0

34.2

30

35.4

25.9

30

36.6

18.8

17

34.9

Mean

15.9

17.3

17.2

17.1

18.2

22.0

25.1

33.8

13.8

22.7

24.0

Areal Mean Wheat Yield (Q/ha)

20.6

STDV.

11.51

8.51

11.52

7.22

9.09

5.29

11.02

9.91

7.41

5.07

14.10

CV (%)

72.4

49.2

67

42.2

49.9

24.05

43.9

29.3

53.7

22.3

58.8

3.4.2. Kiremt (Meher) Season Wheat Yield Variability
The analysis of wheat yield variability during the Kiremt (Meher) season, as presented in Table 10, demonstrates significant fluctuations across the different districts (Woredas) over the study period from 2010 to 2021. The variability index was calculated by subtracting the 12-year mean yield of each district from the annual yields. This method highlights deviations from the average, providing insights into yield stability or volatility. For instance, in 2016, Minjar-Shenkora district experienced a substantial negative deviation of -14.8 quintals per hectare from its 12-year mean, indicating a challenging year for wheat production. Conversely, Merehabete district saw a significant positive deviation of 27.1 quintals per hectare in 2021, reflecting a particularly favorable growing season. As seen in Table 11, the coefficient of variation (CV) further underscores this variability. Moderate variation was observed in Mojana Wodera district (CV = 24.05%), Minjar-Shenkora district (CV = 29.3%), and Basona Worena district (CV = 22.3%).
The remaining districts exhibited high variability, indicating less consistent wheat yields over the years. This variability can be attributed to several factors, including climatic conditions, soil fertility, and farming practices, which vary significantly across the region. The trend analysis, depicted in Figure 7, shows an overall increase in the area’s mean wheat yield over the 12-year period, with the long-term average yield being 20.6 quintals per hectare. These findings emphasize the need for tailored agricultural interventions to enhance wheat yield stability in districts with higher variability.
Table 11. Meher season Wheat Yield Variability.

Year

Merha bete

Ensaro

Moretna jiru

Gera midir

Tarm aber

Mojana wodera

Angolela natera

Ankober

Basona werana

Siyade Brina wayu

Minjar Shenkora

2010

-9.8

0

-13

-6.8

-4.9

-10.8

-12.0

-8.5

-6.3

-5.7

-12.1

2011

-13.4

-10.3

-2.3

-8.7

-9.1

-1.3

-15.6

-11.8

9.3

-19.3

0.9

2012

-6.9

-3.5

-12.4

-4.4

-5.7

-3.0

-4.8

-6

-2.5

-19.5

-3.3

2013

-3.4

-5.7

-4

0.9

-6.5

-7.4

-9.3

-5.5

-3

-11.3

-2.4

2014

0.0

1.9

-6

15

0.1

4.3

-10.0

-0.7

4.9

-10.9

-0.1

2015

6.7

2

-7.2

-2.2

-6.5

2.1

13.2

4.2

-1.9

-6.6

8.1

2016

-3.0

-9.9

0.5

0

-6

5.4

0.6

4.9

2.9

5.0

-14.8

2017

-5.8

-11

-11.7

-3.2

-3

1.9

0.4

-0.7

6.8

7.0

10

2018

0.0

2.2

12.3

-4.7

11

7.2

4.3

15.4

-5.1

9.7

18.8

2019

-7.5

14.5

6.5

1.5

-1.3

0.0

22.0

-0.9

0.8

21.8

-12.4

2020

15.6

6.6

20.2

-0.4

14.9

-1.9

6.2

4.6

-0.4

18.7

4

2021

27.1

12.7

17

12.9

17.2

3.9

4.9

5

-5.7

10.9

2.8

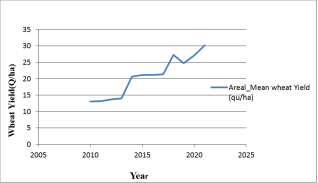
Figure 7. Areal Mean Wheat Yield Trend.
3.5. Correlation Between Kiremt (Meher) Season Wheat Yield and Rainfall
The correlation analysis between Kiremt season rainfall and Meher wheat crop yield across various districts reveals significant variability in the relationship (2010-2021). Among the districts, 22.2% exhibited a negative correlation, including Alem Ketema (-0.4) and Ankober (-0.3). In these areas, higher rainfall potentially reduces yields due to adverse conditions such as waterlogging. Conversely, 22.2% of the districts showed a strong positive correlation, such as Ensaro (0.7) and Tarmaber (0.7), where increased rainfall generally boosts wheat productivity.
Further 44.4% of the districts demonstrated moderate positive correlations, including Basona Worana (0.6), Deneba (0.6), Mojana Wodera (0.5), and Moretina Jiru (0.6). In these regions, rainfall has a beneficial but less pronounced impact on yields. Lastly, 22.2% of the districts, such as Angolela Tera (0.2) and Mehal Meda (0.2), showed a weak positive correlation, indicating that rainfall has a limited influence on crop yields, with other factors likely playing a more significant role shown in Appendix Table 1, classification in Table 12 below.
Over Ensaro district Figure 8, a strong positive correlation (r = 0.7) is observed, with an R² of 0.4384, indicating that 43.84% of the yield variability can be explained by rainfall. Similarly, Moretina Jiru, as shown in Figure 9 with an r of 0.6 and an R² of 0.3977, suggests that nearly 40% of the yield variability can be attributed to rainfall, highlighting its significant impact. On Figure 10, Tarmaber district shows a strong correlation (r = 0.7), with an even higher R² of 0.5223, meaning 52.23% of the variation in wheat yield is influenced by rainfall patterns during the Kiremt season.
However, in districts like Mojana Wodera (Figure 11), where r = 0.5 and R² = 0.2049, only 20.49% of the wheat yield variability is explained by rainfall, reflecting a weaker, though still positive, relationship. In Ankober indicated as Figure 12 the correlation is negative (r = -0.3) with a very low R² of 0.097, suggesting that rainfall plays a minimal role in wheat yield variability, and other factors may have a stronger influence. Siyadebirna Wayu (Figure 13) and in Figure 14, Basona Werana both exhibit moderate positive correlations (r = 0.6), with R² values of 0.3163 and 0.3118, respectively, indicating that around 31% of the yield variability in these districts is explained by rainfall.
Table 12. Correlation of Wheat Crop yield and Kiremt mean Rainfall.

Group

Districts

Correlation Coefficient (r)

Interpretation

Negative Correlation

Alem Ketema, Ankober

-0.4, -0.3

Higher rainfall may reduce yields due to waterlogging or other issues.

Weak Positive Correlation

Angolela Tera, Mehal Meda

0.2, 0.2

Limited influence of rainfall on yields; other factors likely more significant.

Moderate Positive Correlation

Basona Worana, Deneba, Mojana Wodera, Moretina Jiru

0.5, 0.6, 0.6, 0.6

Beneficial impact of rainfall on yields, with variability in strength.

Strong Positive Correlation

Ensaro, Tarmaber

0.7, 0.7

Increased rainfall strongly boosts crop productivity.

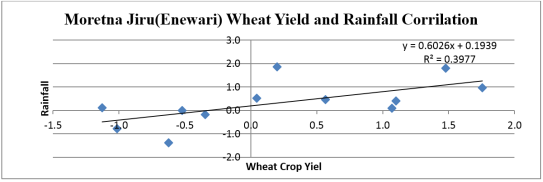
Figure 8. Correlation between Meher Wheat crop production and summer on Ensaro district (2010-2021).
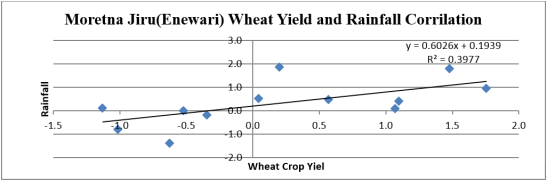
Figure 9. Correlation between Meher Wheat crop production and summer on Moretina Jiru district (2010-2021).
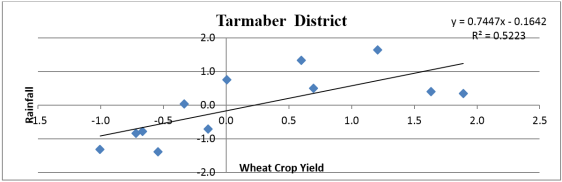
Figure 10. Correlation between Meher Wheat crop production and summer on Tarmaber district (2010-2021).
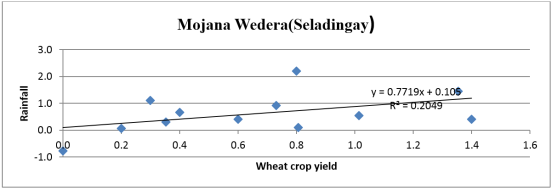
Figure 11. Correlation between Meher Wheat crop production and summer on Mojana Wodera district (2010-2021).
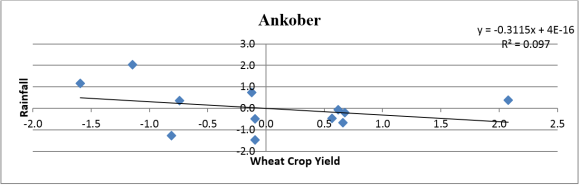
Figure 12. Correlation between Meher Wheat crop production and summer Rainfall on Ankober district (2010-2021).
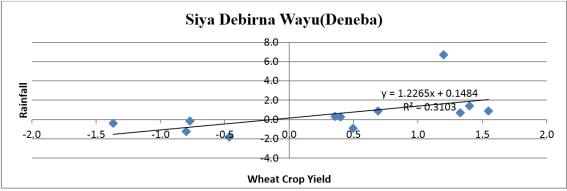
Figure 13. Correlation between Meher Wheat crop production and summer Rainfall on Siyadebrina Wayu district (2010-2021).
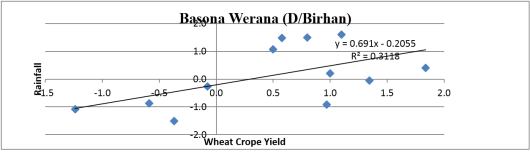
Figure 14. Correlation between Meher Wheat crop production and summer Rainfall on Basona Werana district (2010-2021).
4. Conclusion
The analysis revealed significant variability in seasonal rainfall both spatially and temporally across the study area. Some stations experienced consistent rainfall patterns, while others showed marked differences in seasonal totals and distribution, indicating vulnerability to climate fluctuations. The performance evaluation of the gridded rainfall data against station data reflected strong statistical agreement, validating the use of the gridded dataset in this study with correlation coefficient of 0.942 indicates a very high positive correlation between the gridded and station data, suggesting that the gridded data accurately captures the spatial and temporal distribution of rainfall in the study area.
The analysis of seasonal and annual rainfall variability in the study area revealed significant spatial and temporal differences in rainfall distribution. The rainfall patterns, including the Belg, Kiremt, and Bega seasons, exhibit varying degrees of variability across different stations, which impacts agricultural activities, particularly wheat production. Stations like Debre Sina and Enewari experience higher and more stable rainfall, while others, such as Mehal Meda, exhibit lower and more erratic rainfall patterns. The Belg season displays more irregular rainfall distribution, while the Kiremt season tends to have more consistent, though still variable, rainfall patterns. Bega season rainfall shows the highest variability, contributing to challenges in agricultural planning.
The correlation between Kiremt rainfall and wheat crop varies across districts, with negative correlations observed in areas prone to waterlogging and positive correlations in regions where rainfall is beneficial for crop growth. This research underscores the importance of integrating trend and anomaly analyses to better understand and manage the impacts of rainfall variability on agricultural productivity.
This study recommends adapting agricultural practices to local rainfall characteristics, promoting drought-resistant crops in variable areas, and improving early warning systems, especially for Belg and Bega seasons. Climate-smart farming methods like water harvesting and soil conservation should be encouraged. The validated gridded rainfall data can support planning in data-scarce areas. Crop choices should align with rainfall-yield relationships to reduce climate risks. Investment in irrigation, insurance, and agricultural extension services is essential. Continued monitoring and farmer training on seasonal forecasts are also important for managing rainfall variability.
Acknowledgments
This research did not receive any specific grant or funding support. I would like to express my sincere gratitude to the Ethiopian Meteorology Institute for providing access to rainfall datasets and for offering valuable training on data analysis tools. I also like to express my thanks note to Ethiopian Statistical Service supplying free historical Wheat crop data. I have great thankful to the reviewers, their insightful comments and constructive suggestions have significantly improved the quality of this manuscript.
Author Contributions
Getahun Bekele Wolde is the sole author. The author read and approved the final manuscript.
Conflicts of Interest
I declare that I have no conflicts of interest.
References
[1] P. Camberlin, V. Moron, R. Okoola, and N. Philippon, “Components of rainy seasons variability in Equatorial East Africa : onset, cessation, rainfall frequency and intensity,” no. January, 2009.
[2] T. M. Weldegerima, T. T. Zeleke, B. S. Birhanu, B. F. Zaitchik, and Z. A. Fetene, “Analysis of Rainfall Trends and Its Relationship with SST Signals in the Lake Tana Basin, Ethiopia,” Adv. Meteorol., vol. 2018, 2018,
[3] S. Mulugeta, C. Fedler, and M. Ayana, “Analysis of Long-Term Trends of Annual and Seasonal Rainfall in the Awash River Basin, Ethiopia,” no. October, 2019,
[4] B. A. Ogwang, H. Chen, X. Li, and C. Gao, “The Influence of Topography on East African October to December Climate : Sensitivity Experiments with RegCM4,” vol. 2014, 2014.
[5] N. Ama et al., “Projected effects of 1.5°C and 2°C global warming levels on the intra-seasonal rainfall characteristics over the Greater Horn of Africa Projected effects of 1.5°C and 2°C global warming levels on the intra-seasonal rainfall characteristics ove,” 2020.
[6] Alhamshry et al., “Seasonal Rainfall Variability in Ethiopia and Its,” pp. 1-19, 2020.
[7] W. Legese, D. Koricha, and K. Ture, “Characteristics of Seasonal Rainfall and its Distribution Over Bale Highland, Southeastern Ethiopia,” J. Earth Sci. Clim. Change, vol. 09, no. 02, 2018,
[8] W. Tefera et al., “Chemical characterization and seasonality of ambient particles (PM2.5) in the city centre of addis ababa,” Int. J. Environ. Res. Public Health, vol. 17, no. 19, pp. 1-16, 2020,
[9] S. Mesike and T. Esekhade, “Rainfall variability and rubber production in Nigeria,” no. January 2014, 2016,
[10] Z. T. Segele, “Characterization and variability of Kiremt rainy season over Ethiopia Characterization and variability of Kiremt rainy season over Ethiopia,” no. August, 2014,
[11] M. M. Alemu and G. T. Bawoke, “Analysis of spatial variability and temporal trends of rainfall in Amhara Region, Ethiopia,” J. Water Clim. Chang., vol. 11, no. 4, pp. 1505-1520, 2020,
[12] A. H. Shekuru, A. B. Berlie, and Y. K. Bizuneh, “Variability and Trends of Temperature and Rainfall Over Three Agro- Ecological Zones in North Shewa, Central Ethiopia,” Res. Sq., pp. 1-22, 2020.
[13] W. A. Atiah, F. K. Muthoni, and B. H. Kotu, “Trends of Rainfall Onset, Cessation, and Length of Growing Season in Northern Ghana : Comparing the Rain Gauge, Satellite, and Farmer ’ s Perceptions,” no. December, 2021,
[14] P. O. Omay, O. Christopher, Z. Atheru, and Z. Atheru, “Changes and Variability in rainfall onset, cessation and length of rainy season in the IGAD region of Eastern Africa,” 2022.
[15] D. Ayalew, K. Tesfaye, G. Mamo, B. Yitaferu, and W. Bayu, “Variability of rainfall and its current trend in Amhara region, Ethiopia,” vol. 7, no. 10, pp. 1475-1486, 2012,
[16] N. S. Met, O. Adewale, and T. O. Dauda, “N. Met. S,” vol. 19, no. 1, pp. 66-76, 2021.
[17] A. Tilahun, “The Contribution of Ethiopian Orthodox Tewahido Church in Forest Management and Its Best Practices to be Scaled up in North Shewa Zone of Amhara Region, Ethiopia,” Agric. For. Fish., vol. 4, no. 3, p. 123, 2015,
[18] A. Waktola, “Exploratory Study of two regions in Ethiopia to Identify target areas and partners for intervention,” no. 6, 1999.
[19] G. Urgessa, “Spatial and Temporal Uncertainty of Rainfall in Arid and Semi-Arid Areas of Ethiopia,” Sci. Technol. Arts Res. J., vol. 2, no. 4, p. 106, 2014,
[20] A. Ababa, A. Ababa, V. Enso, S. Zone, A. R. State, and G. A. Mera, “Analysis of Meteorological Drought Using SPI and Large Scale Climate Hydrology : Current Research Analysis of Meteorological Drought Using SPI and Large-Scale Climate Variability (ENSO) -A Case Study in North Shewa Zone, Amhara Regional,” Weather Clim. Extrem., vol. 9, no. February, pp. 261-274, 2019,
[21] D. Korecha and A. Sorteberg, “Validation of operational seasonal rainfall forecast in Ethiopia,” Water Resour. Res., vol. 49, no. 11, pp. 7681-7697, 2013,
[22] W. Bewket, “Rainfall variability and crop production in Ethiopia Case study in the Amhara region,” pp. 823-836, 2009.
[23] D. A. Wilhite and C. L. Knutson, “Drought management planning : Conditions for success,” Options Méditerranéennes, Ser. A, no. 80, pp. 141-148, 2006.
[24] G. M. McKeon et al., “Northern Australian Savannas: Management for Pastoral Production,” J. Biogeogr., vol. 17, no. 4/5, p. 355, Jul. 1990,
[25] Mark Svoboda ; Michael Hayes ; Deborah A. Wood, “Standardized Precipitation Index User Guide,” J. Appl. Bacteriol., vol. 63, no. 3, pp. 197-200, 1987.
[26] M. Svoboda, M. Hayes, and D. Wood, “Spi Index for Diferent Locations,” World Meteorol. Organ., vol. 1090, 2012, [Online]. Available:
[27] T. B. Mckee, N. J. Doesken, and J. Kleist, “The relationship of drought frequency and duration to time scales,” no. January, pp. 17-22, 1993.
[28] M. J. Hayes, M. D. Svoboda, D. A. Wilhite, and O. V Vanyarkho, “Monitoring the 1996 Drought Using the Standardized Precipitation Index,” pp. 429-438, 1996.
[29] T. Dinku, R. Faniriantsoa, S. Islam, and G. Nsengiyumva, “The Climate Data Tool : Enhancing Climate Services Across Africa,” vol. 3, no. February, pp. 1-16, 2022,
[30] A. Asfaw, B. Simane, A. Hassen, and A. Bantider, “Variability and time series trend analysis of rainfall and temperature in northcentral Ethiopia: A case study in Woleka sub-basin,” Weather Clim. Extrem., vol. 19, no. June 2017, pp. 29-41, 2018,
[31] Y. Mohammed, F. Yimer, M. Tadesse, and K. Tesfaye, “Meteorological drought assessment in north east highlands of Ethiopia,” Int. J. Clim. Chang. Strateg. Manag., vol. 10, no. 1, pp. 142-160, 2018,
[32] G. Bayable, G. Amare, G. Alemu, and T. Gashaw, “Spatiotemporal variability and trends of rainfall and its association with Pacific Ocean Sea surface temperature in West Harerge Zone, Eastern Ethiopia,” Environ. Syst. Res., vol. 10, no. 1, 2021,
[33] C. Historical et al., “CHARACTERIZING HISTORICAL CLIMATE VARIABILITY AND ITS INTERCONNECTION WITH MAJOR CROPS PRODUCTION IN THE SOUTH GONDAR ZONE, AMHARA, ETHIOPIA by sisay kelemu Ayehu Background of the Study,” vol. 9, no. 9, pp. 132-158, 2021.
Cite This Article
  • APA Style

    Wolde, G. B. (2025). Seasonal Rainfall Variability and Its Impact on Wheat Crop Production Over North Showa Zone, Amhara Region, Ethiopia. Advances in Applied Sciences, 10(3), 45-64. https://doi.org/10.11648/j.aas.20251003.12

    Copy | Download

    ACS Style

    Wolde, G. B. Seasonal Rainfall Variability and Its Impact on Wheat Crop Production Over North Showa Zone, Amhara Region, Ethiopia. Adv. Appl. Sci. 2025, 10(3), 45-64. doi: 10.11648/j.aas.20251003.12

    Copy | Download

    AMA Style

    Wolde GB. Seasonal Rainfall Variability and Its Impact on Wheat Crop Production Over North Showa Zone, Amhara Region, Ethiopia. Adv Appl Sci. 2025;10(3):45-64. doi: 10.11648/j.aas.20251003.12

    Copy | Download

  • @article{10.11648/j.aas.20251003.12,
      author = {Getahun Bekele Wolde},
      title = {Seasonal Rainfall Variability and Its Impact on Wheat Crop Production Over North Showa Zone, Amhara Region, Ethiopia
    },
      journal = {Advances in Applied Sciences},
      volume = {10},
      number = {3},
      pages = {45-64},
      doi = {10.11648/j.aas.20251003.12},
      url = {https://doi.org/10.11648/j.aas.20251003.12},
      eprint = {https://article.sciencepublishinggroup.com/pdf/10.11648.j.aas.20251003.12},
      abstract = {Rainfall play an important role in crop management and monitoring, as it directly influences planting calendar, irrigation needs, crop growth and yield outcomes. This study was attempted to analyze seasonal rainfall variability and its impact on wheat crop production to understand association of seasonal rainfall characteristics with wheat crop production over North Showa Zone Amhara Region. Both time series station and satellite gridded rainfall data sets were obtained from Ethiopian Meteorology Institute from 1985 to 2021. Wheat crop production for main rainy season (Meher) was obtained from Ethiopian Statistical Service from 2010-2021, collected from household farm association level. Analysis of rainfall data sets was provided with climate data tool (CDT V8), R studio and Microsoft excel and ArcGIS 10.8. Coefficient of variation, precipitation concentration index and Standardized anomaly index (SAI) were applied to analyze long year seasonal and annual rainfall variability. Man-Kendall trend analysis methods were applied for rainfall trend analysis. Correlation coefficient on the other side has been applied to analyze rainfall variability impact on wheat crop production. The findings of this paper indicate irregular variation of spring (Belg) rainfall, moderate to low variation in summer and annual rainfall over the study area. Using correlation and coefficient of determination (R²) analyses, significant spatial variability was observed in the rainfall-crop relationship. Strong positive correlations were found in districts such as Ensaro (r = 0.7, R² = 0.4384) and Tarmaber (r = 0.7, R² = 0.5223), where over 40% and 50% of the variability in wheat production can be attributed to rainfall, respectively. Conversely, weaker correlations were evident in areas like Mojana Wodera (r = 0.5, R² = 0.2049), and Ankober (r = -0.3, R² = 0.097), suggesting that in these districts, rainfall plays a less dominant role in determining crop production, with other factors such as soil fertility and agricultural practices possibly having a greater influence.},
     year = {2025}
    }
    

    Copy | Download

  • TY  - JOUR
    T1  - Seasonal Rainfall Variability and Its Impact on Wheat Crop Production Over North Showa Zone, Amhara Region, Ethiopia
    
    AU  - Getahun Bekele Wolde
    Y1  - 2025/07/28
    PY  - 2025
    N1  - https://doi.org/10.11648/j.aas.20251003.12
    DO  - 10.11648/j.aas.20251003.12
    T2  - Advances in Applied Sciences
    JF  - Advances in Applied Sciences
    JO  - Advances in Applied Sciences
    SP  - 45
    EP  - 64
    PB  - Science Publishing Group
    SN  - 2575-1514
    UR  - https://doi.org/10.11648/j.aas.20251003.12
    AB  - Rainfall play an important role in crop management and monitoring, as it directly influences planting calendar, irrigation needs, crop growth and yield outcomes. This study was attempted to analyze seasonal rainfall variability and its impact on wheat crop production to understand association of seasonal rainfall characteristics with wheat crop production over North Showa Zone Amhara Region. Both time series station and satellite gridded rainfall data sets were obtained from Ethiopian Meteorology Institute from 1985 to 2021. Wheat crop production for main rainy season (Meher) was obtained from Ethiopian Statistical Service from 2010-2021, collected from household farm association level. Analysis of rainfall data sets was provided with climate data tool (CDT V8), R studio and Microsoft excel and ArcGIS 10.8. Coefficient of variation, precipitation concentration index and Standardized anomaly index (SAI) were applied to analyze long year seasonal and annual rainfall variability. Man-Kendall trend analysis methods were applied for rainfall trend analysis. Correlation coefficient on the other side has been applied to analyze rainfall variability impact on wheat crop production. The findings of this paper indicate irregular variation of spring (Belg) rainfall, moderate to low variation in summer and annual rainfall over the study area. Using correlation and coefficient of determination (R²) analyses, significant spatial variability was observed in the rainfall-crop relationship. Strong positive correlations were found in districts such as Ensaro (r = 0.7, R² = 0.4384) and Tarmaber (r = 0.7, R² = 0.5223), where over 40% and 50% of the variability in wheat production can be attributed to rainfall, respectively. Conversely, weaker correlations were evident in areas like Mojana Wodera (r = 0.5, R² = 0.2049), and Ankober (r = -0.3, R² = 0.097), suggesting that in these districts, rainfall plays a less dominant role in determining crop production, with other factors such as soil fertility and agricultural practices possibly having a greater influence.
    VL  - 10
    IS  - 3
    ER  - 

    Copy | Download

Author Information
  • Department of Aviation Meteorology Service, Ethiopian Meteorology Institute, Addis Ababa, Ethiopia

  • Abstract
  • Keywords
  • Document Sections

    1. 1. Introduction
    2. 2. Methodology
    3. 3. Results and Discussions
    4. 4. Conclusion
    Show Full Outline
  • Acknowledgments
  • Author Contributions
  • Conflicts of Interest
  • References
  • Cite This Article
  • Author Information