Research Article | | Peer-Reviewed

Low-Pressure Vapor–Liquid Equilibrium Measurements and Thermodynamic Modelling of Binary Systems Containing p-Cymene and Alcohols

Received: 11 July 2026     Accepted: 27 July 2026     Published: 27 August 2026
Views:       Downloads:
Abstract

This study investigated terpene (p-cymene) solvent as the potential replacement for traditional petrochemical solvents such as n-hexane that have been used for decades in chemical industries. The traditional solvents cause harm in human being and environment. The selected terpene solvent has been identified as potential natural green solvent due to that they are environmental benign, non-toxic, biodegradable, sustainable and produce minimum vapours. New isobaric vapour-liquid equilibrium (VLE) data were measured at 50 kPa for binary systems containing the p-cymene with selected six alcohols. The investigated binary systems comprised p-cymene + {ethanol or 1-propanol or 2-propanol or 1-butanol or 1-pentanol or 1-hexanol}. The experimental measurements were conducted using low pressure recirculation dynamic equilibrium still. All systems exhibited positive deviations from Raoult’s law, attributed to weak interactions between the non-polar terpene molecules and strongly hydrogen-bonding alcohols. The degree of non-ideality decreased with increasing alcohol chain length owing to improved dispersion interactions between the terpene and alcohol molecules. Most p-cymene systems did not exhibit azeotropic behaviour; however, a minimum-boiling azeotrope was observed for the p-cymene + 1-hexanol system. The experimental data were successfully correlated using the NRTL and Wilson activity coefficient models, both of which provided excellent agreement with the measured equilibrium data. The generated VLE data contribute to the optimisation of separation processes using p-cymene as green solvents. The terpene solvent shows the good separation, which it can be used as alternative solvent over tradition solvent n-hexane.

Published in American Journal of Chemical Engineering (Volume 14, Issue 4)
DOI 10.11648/j.ajche.20261404.16
Page(s) 138-155
Creative Commons

This is an Open Access article, distributed under the terms of the Creative Commons Attribution 4.0 International License (http://creativecommons.org/licenses/by/4.0/), which permits unrestricted use, distribution and reproduction in any medium or format, provided the original work is properly cited.

Copyright

Copyright © The Author(s), 2026. Published by Science Publishing Group

Keywords

Terpene, Green Solvents, Activity Coefficient Model, Isobaric, Alcohols

1. Introduction
Growing environmental concerns associated with volatile organic compounds (VOCs) have stimulated interest in renewable and environmentally benign solvents. Biomass-derived solvents have emerged as attractive alternatives owing to their low toxicity, biodegradability, and renewable origin . Various classes of green solvents have been proposed, including water, supercritical fluids, ionic liquids, terpenes, deep eutectic solvents, fluorous solvents, liquid polymers, and bio-derived solvents . Among bio-based candidates, the terpene compounds p-cymene has attracted considerable attention because they are naturally occurring, readily available from biomass resources, and possess physicochemical properties that make them potentially suitable for industrial separation applications .
The successful implementation of bio-based solvents in industrial processes requires reliable thermodynamic data and predictive models . However, despite the growing interest in terpene-based solvents, phase-equilibrium information for systems containing terpene remains limited. Existing studies have primarily focused on terpene-terpene mixtures or atmospheric-pressure systems, while little information is available for mixtures containing alcohols under reduced-pressure conditions. The only reported VLE measurements involving α-pinene and β-pinene with alcohols are isothermal studies for mixtures with 1-butanol and 1-pentanol at 368.15 K and 393.15 K . To date, no isobaric VLE data for binary mixtures of p-cymene or α-pinene with alcohols have been reported in the open literature. Isobaric VLE data for d-limonene + ethanol and D-limonene + 1-propanol at atmospheric pressure was measured by Kodama et al. . It was found that Wilson parameters for ethanol + limonene greatly deviated from unity than those for 1-propanol + limonene. Ngema et al. have measured binary systems involving d-limonene with a range of alcohols for C2 to C6 at 40 kPa. It was revealed that as alcohol's carbon increases, the phase envelope decreases, and the systems show an azeotrope. It was found that the d-limonene + ethanol system was not easy to measure compared to other systems. There was a good separation between d-limonene and alcohols.
The absence of experimental data presents a significant challenge for process design and solvent evaluation. Reliable VLE information is required to develop and validate thermodynamic models, estimate binary interaction parameters, and accurately simulate industrial separation processes . Without such data, the feasibility of employing p-cymene as alternative natural green solvent remains uncertain, and process simulations may be subject to significant inaccuracies. Furthermore, activity-coefficient-based predictive methods cannot achieve the level of reliability required for solvent selection when experimental phase-equilibrium data are unavailable .
Although VLE behaviour for p-cymene has been investigated over a wide pressure range, extending from low pressures to near-critical conditions , experimental measurements at elevated temperatures and pressures remain challenging, time-consuming, and resource-intensive. More importantly, there remains a lack of systematic low-pressure isobaric VLE data for binary mixtures of p-cymene with short- and medium-chain alcohols. Such information is particularly relevant to vacuum distillation and solvent-recovery operations commonly encountered in fragrance, flavour, and essential-oil processing industries.
Accurate representation of non-ideal liquid-phase behaviour is essential for correlating and predicting VLE data. Activity coefficient models, particularly the Non-Random Two-Liquid (NRTL) model, have proven effective for strongly non-ideal systems because they account for molecular interactions and local composition effects within liquid mixtures. Together with models such as Wilson and UNIQUAC, the NRTL model is widely applied in the correlation of experimental VLE data and the estimation of binary interaction parameters required for process simulation and design. Nevertheless, limited information is available regarding the predictive performance of these models for terpene-alcohol systems under reduced-pressure conditions and across alcohol homologous series.
Therefore, a significant knowledge gap exists regarding the low-pressure phase behaviour of binary mixtures containing p-cymene with alcohols. In addition to the scarcity of experimental data, the influence of alcohol chain length and molecular structure on phase non-ideality and potential azeotrope formation remains poorly understood. Addressing these limitations is essential for improving the accuracy of phase-equilibrium predictions, reducing uncertainty in process simulations, and facilitating the development of efficient and sustainable separation processes.
The aim of this study is to assess the suitability of p-cymene as potential natural green solvent for separation applications through the generation and thermodynamic modelling of reliable low-pressure VLE data. Isobaric VLE measurements are conducted at a constant pressure of 50 kPa for binary mixtures of p-cymene with ethanol, 1-propanol, 2-propanol, 1-butanol, 1-pentanol, and 1-hexanol. Experimental data are obtained using a dynamic recirculating VLE equilibrium still, while equilibrium compositions are determined from refractive index measurements. The resulting datasets are evaluated for thermodynamic consistency and correlated using the Wilson and NRTL activity coefficient models in Aspen Plus to estimate binary interaction parameters. The generated data and model parameters are intended to provide a reliable basis for process design, simulation, and the evaluation of terpene-based solvents as sustainable alternatives in industrial separation processes.
2. Data Reduction and Thermodynamic Modelling
2.1. Data Reduction
2.1.1. Vapour-Liquid Equilibrium Calculations
Experimental equilibrium temperatures and phase compositions were used to calculate activity coefficients and evaluate phase equilibrium behaviour. At equilibrium, the fugacity of each component in the vapour phase is equal to that in the liquid phase. Under the low operating pressure of 50 kPa employed in this study, vapour-phase non-idealities are negligible and the vapour phase may be assumed to behave ideally. In this study, the compressibility factor approaches unity, and the fugacity of a component becomes approximately equal to its partial pressure and the validity the vapour-phase intermolecular interactions are weak compared with those in the liquid phase. The vapor-phase fugacity coefficients are therefore expected to be very close to unity, resulting in negligible errors if ideal-gas behavior is assumed. Furthermore, the primary non-idealities in systems containing alcohols associating compounds usually arise due to hydrogen bonding and specific molecular interactions. These effects are more appropriately accounted for through activity coefficient models such as NRTL, Wilson and UNIQUAC while the vapour phase remains adequately represented by the ideal-gas model. Consequently, the modified Raoult's law expression was applied:
𝑦𝑖𝑃=𝑥𝑖𝛾𝑖P𝑖𝑠𝑎𝑡(1)
where yi and xi are the vapour- and liquid-phase mole fractions of component i, respectively, P is the total system pressure, γi is the liquid-phase activity coefficient, and Pisat is the saturation vapour pressure calculated using the Antoine equation.
The saturation vapour pressure of each pure component was calculated from:
𝑙𝑜𝑔10P𝑖𝑠𝑎𝑡=𝐴𝑖−B𝑖𝑇+𝐶𝑖(2)
where Ai, Bi, and Ci are Antoine constants and T is the equilibrium temperature.
Activity coefficients were subsequently calculated from the experimental equilibrium measurements and used for thermodynamic consistency testing and model parameter estimation.
2.2. Activity Coefficient Models
The experimental VLE data were correlated using the Wilson and Non-Random Two-Liquid (NRTL) activity coefficient models. These models were selected because they are widely used for the representation of non-ideal liquid mixtures and have demonstrated reliable performance for systems exhibiting significant intermolecular interactions.
2.2.1. Wilson Model
The Wilson model is based on the local composition concept and accounts for differences in molecular interactions between unlike species through the excess Gibbs free energy expression :
gERT=-x1lnx1+Λ12x2-x2lnx2+Λ21x1(3)
where Λ12 and Λ21 are binary interaction parameters related to molecular interaction energies and liquid molar volumes, x1 and x2 are liquid phase mole fraction, T is experimental temperature, R is Universal gas constant and gE is excess Gibbs free energy.
The Wilson model has been successfully applied to fully miscible liquid mixtures and is frequently used for VLE correlation because of its relatively simple mathematical form and reliable representation of liquid-phase non-ideality .
2.2.2. NRTL Model
To account for stronger non-ideal behaviour, the Non-Random Two-Liquid (NRTL) model developed by Renon and Prausnitz was also employed . Unlike the Wilson model, the NRTL formulation incorporates a non-randomness parameter to represent preferential molecular interactions in the liquid phase .
For binary mixtures, the activity coefficients are expressed as:
lnγ1=x22τ21G212x1+x2G212+x12τ12G12x2+x1G122(4)
WhereG21=exp-α21τ21(5)
where G12 and G21 are binary interaction parameters related to molecular interaction energies and liquid molar volumes, x1 and x2 are liquid phase mole fraction, α21 is non-randomness parameter, τ21 is dimensionless parameters represent the energy difference between unlike and like molecular interactions.
Because the NRTL model accounts for local composition effects and molecular non-randomness, it is particularly suitable for highly non-ideal systems and has become one of the most widely used models for phase-equilibrium calculations .
2.3. Parameter Estimation
Binary interaction parameters for the Wilson and NRTL models were estimated using the Data Regression System in Aspen Plus® V14. The regression procedure minimized the differences between experimental and calculated equilibrium temperatures and vapour-phase compositions over the entire composition range.
Model performance was evaluated using the average absolute deviation (AAD) between experimental and calculated values:
AADT=1Ni=1NTiexp-Ticalc(6)
AADy=1Ni=1Nyiexp-yicalc(7)
where (N) is the number of experimental data points, yiexp and yicalc are experimental and calculated vapour phase mole fraction, Tiexp abd Ticalc experimental and calculated temperatures.
The model providing the lowest deviations in equilibrium temperature and vapour-phase composition was considered to give the best representation of the experimental VLE behaviour.
2.4. Thermodynamic Consistency Analysis
The reliability of the experimental VLE data was evaluated using the McDermott-Ellis thermodynamic consistency test . Thermodynamic consistency testing is an essential requirement in VLE investigations because it verifies whether the measured equilibrium data satisfy the Gibbs-Duhem equation and fundamental phase-equilibrium constraints .
The McDermott-Ellis method was selected because it provides a quantitative assessment of the entire experimental dataset while accounting for uncertainties associated with temperature, pressure, and composition measurements. This approach is particularly suitable for non-ideal terpene-alcohol systems where accurate representation of intermolecular interactions is essential for subsequent model development .
The maximum allowable deviation, Dmax, was calculated according to Equation (8):
Dmax=i=1Nxia+xib1xia+1yia+1xib+1yibx+2i=1Nlnγib-lnγiax+i=1Nxia+xibPP+i=1Nxia+xibβi1ta+δi2+1ta+δi2t(8)
where x, P, and t represent the experimental uncertainties in composition, pressure, and temperature measurements, respectively. The parameters βi and δi are functions of the Antoine vapour-pressure constants for component i, γ is the activity coefficient, x is liquid composition, y is the vapour composition and N is the number of points.
Experimental data were considered thermodynamically consistent when the calculated Gibbs-Duhem area deviation satisfied the McDermott-Ellis acceptance criterion. Only consistent datasets were subsequently used for parameter regression and model correlation .
3. Apparatus and Experimental Methodology
3.1. Materials
The chemicals used in this study are listed in Table 1. All compounds were used as received without further purification. The purity of each component was verified by comparison of experimentally measured refractive indices with literature and supplier specifications using an Anton Paar DMA 4100 M density meter and refractometer. The instrument provides a refractive index accuracy of ±0.00001.
Table 1. Chemicals used and their purities.

Chemical Names

CAS number

Supplier

Minimum Purity mass (%)a

Ethanol

64-17-5

Merck

≥ 99.50

1-propanol

71-23-8

Sigma-Aldrich

≥ 99.50

2-propanol

67-63-0

Sigma-Aldrich

≥ 99.50

1-butanol

71-36-3

Sigma-Aldrich

≥ 99.50

1-pentanol

71-41-0

Sigma-Aldrich

≥ 99.00

1-hexanol

11-27-3

Sigma-Aldrich

≥ 99.98

p-cymene

99-87-6

Merck

≥ 99.85

cyclohexane

592-41-6

Merck

≥ 99.85

aStated by supplier
3.2. Apparatus
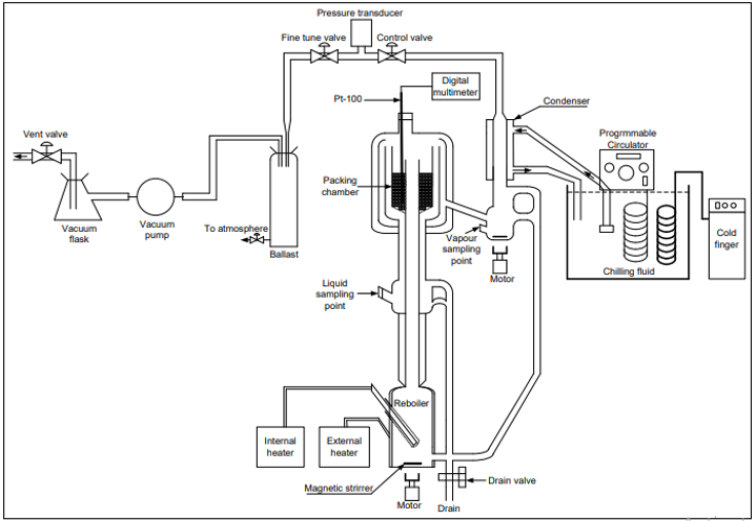
Isobaric vapour-liquid equilibrium measurements were performed using a low-pressure recirculating equilibrium still based on the design described by Ngema et al. . A schematic representation of the apparatus is shown in Figure 1. The apparatus consists of a glass equilibrium cell fitted with liquid and vapour recirculation loops, a condenser, sampling ports, a heating mantle, temperature measurement devices, and pressure-control equipment. More details in literature . Continuous recirculation of both phases promotes rapid attainment of equilibrium and minimizes concentration gradients within the system. Temperature was measured using a calibrated thermocouple located in the equilibrium cell, while system pressure was monitored and maintained at 50 kPa using a vacuum control system. Refractive index measurements were performed using an Anton Paar DMA 4100 M refractometer.
Figure 1. Schematic diagram of the low-pressure recirculating equilibrium still .
To verify the reliability of the experimental apparatus and procedures, VLE measurements were first performed for a well-established binary system, cyclohexane-ethanol at a pressure of 40 kPa. The measured equilibrium temperatures and vapour compositions were compared with literature data at similar operating conditions. Good agreement between experimental and literature values confirmed the accuracy of the apparatus and measurement procedures.
3.3. Experimental Procedure
The full detailed procedure was found in literature . Binary mixtures were prepared gravimetrically over the full composition range and charged into the equilibrium still. The system pressure was adjusted to 50 kPa and maintained constant throughout each experiment. The mixture was heated until steady-state boiling conditions were achieved. Equilibrium was assumed when both temperature and pressure remained constant for at least 45 min and successive measurements showed no observable drift. Once equilibrium had been established, liquid and condensed vapour samples were withdrawn simultaneously through dedicated sampling ports. The equilibrium temperature, pressure, liquid-phase composition, and vapour-phase composition were recorded for each experimental point. Measurements were repeated three times over the entire composition range to obtain complete isobaric VLE datasets for the investigated systems.
3.4. Composition Analysis
Liquid and vapour compositions were determined from refractive index measurements. Calibration curves relating refractive index to liquid composition were developed for the binary system using mixtures of known composition prepared gravimetrically. Polynomial calibration equations were fitted to the experimental refractive index data and subsequently used to determine equilibrium compositions from measured refractive indices. The resulting equilibrium compositions were used for thermodynamic consistency testing and regression of activity coefficient model parameters.
3.5. Experimental Uncertainty
The uncertainty in temperature measurements was estimated from the thermocouple ceramic A, PT-100 calibration, while pressure uncertainty was determined from the specifications of the P-1 pressure transducer as presented in Table 2. Composition uncertainties were obtained from propagation of errors associated with refractive index measurements and calibration correlations were also presented in Table 2. Overall uncertainties in equilibrium temperature, pressure, liquid composition, and vapour composition were subsequently incorporated into the McDermott-Ellis thermodynamic consistency analysis.
Table 2. Parameter uncertainties.

Parameters

Instrument

Accuracy

Temperature

Thermocouple PT-100

±0.1 K

Pressure

Pressure transducer

±0.1 kPa

Refractive index

Anton Paar DMA 4100 M

±0.00001

Composition

From calibration

±0.002 mole fraction

4. Results and Discussion
4.1. The Vle Binary Systems Data
4.1.1. Test System for Cyclohexane (1) + Ethanol (2)
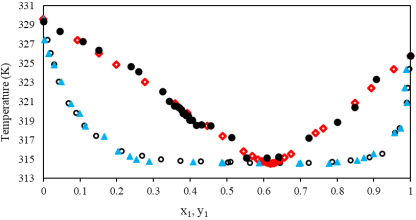
The calibration of the dynamic recirculating vapour-liquid equilibrium (VLE) still was performed using two validation techniques involving well-established reference systems. Firstly, the ethanol-cyclohexane binary test system was measured, and the experimental VLE data were compared with literature data reported by Joseph et al. presented in Figure 2. The chosen test system was the cyclohexane (1) + ethanol (2) binary mixture at a pressure of 40 kPa. The comparison demonstrated excellent agreement, indicating that the VLE still was capable of accurately reproducing published equilibrium data. Secondly, the vapour pressures of the pure components were experimentally measured and compared with values calculated using the Antoine equation and corresponding Antoine constants. The measured vapour pressure data showed very good agreement with the calculated values. These results confirmed the accuracy of both the temperature and pressure calibration procedures also chemicals are not contaminated. Consequently, the successful validation of the apparatus provides confidence in the reliability and accuracy of the dynamic recirculating VLE still for generating high quality experimental data for new unreported systems.
Figure 2. T-x-y diagram for cyclohexane (1) + ethanol (2) at 40 kPa: This study: x (○); y (●); Joseph et at - x (▲); Joseph et at - y (◊).
Table 3 presents the physiochemical chemical properties at 298.15 K, including refractive indices and densities, to confirm that the components were free from contamination. For refractive index, the deviations between measured and literature values were minimal, typically within ±0.002, which is acceptable experimental uncertainty. Similarly, density measurements showed excellent consistency with reported values, with deviations generally below ±0.04. The close correspondence between measured and literature values indicates high sample purity and validates the experimental methodology. These results provide confidence in the subsequent vapor-liquid equilibrium measurements and thermodynamic modelling performed in this study.
Table 3. Measured and critical thermodynamic physical properties.

ethanol

1-Propanol

2-Propanol

1-Butanol

1-Pentanol

1-Hexanol

p-cymene

nD

Measured

1.3581

1.3851

1.3771

1.3993

1.4097

1.4188

1.4930

Literaturea

1.3594

1.3831

1.3770

1.3978

1.4077

1.4178

1.4908

ρ (kg/m3)

Measured

787.02

802.97

785.02

808.06

810.95

821.03

856.97

Literaturea

787.00

803.00

785.00

808.00

811.00

820.00

857.00

Critical Properties

Tc/K

516.25

536.71

508.31

562.93

586.15

611.35

653.15

Pc/kPa

6384

5170

4764

4413

3880

3510

2837

Vc/cm3.mol-1

166.9

218.5

220.1

274.5

326.0

381.3

492.0

Acentric factor

0.637

0.628

0.669

0.595

0.594

0.580

0.372

Antione Constants

A

8.1287

7.8251

7.7765

7.3013

7.21542

7.36642

7.13238

B

1660.87

1482.1

1518.7

1285.023

1333.46

1544.611

1671.474

C

238.131

217.41

213.07

173.24

169.78

187.49

216.01

aReference
4.1.2. New VLE Behaviour of P-Cymene + Alcohol Systems at 50 Kpa
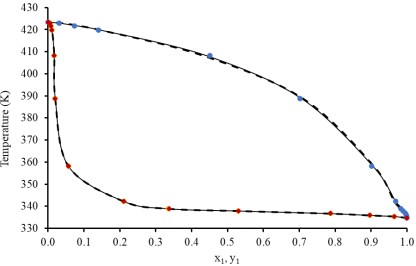
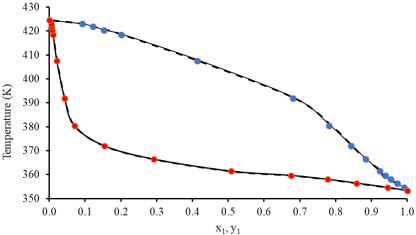
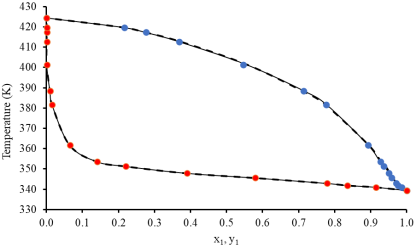
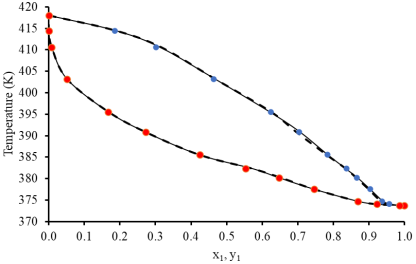
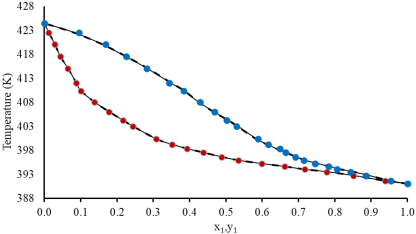
The p-cymene + alcohols systems exhibited positive deviations from Raoult's law over most of the composition range, indicating weaker interactions between unlike molecules than between like molecules. The experimental with modelling data are presented in Tables 4 to 9 and in Figures 3 to 8. The shows the good separation between p-cymene and alcohols. The non-polar aromatic structure of p-cymene is incapable of participating in hydrogen-bond formation, whereas the alcohol molecules form extensive self-associated hydrogen-bond networks. Mixing therefore disrupts favourable alcohol-alcohol interactions without providing equally strong p-cymene-alcohol interactions, resulting in positive excess Gibbs energies and activity coefficients greater than 1.
A systematic reduction in non-ideality was observed with increasing alcohol carbon number. Ethanol, 1-propanol and 2-propanol systems displayed the strongest deviations from ideality, whereas 1-butanol, 1-pentanol and 1-hexanol systems approached more ideal behaviour. This trend can be attributed to the increasing hydrocarbon character of the alcohol molecules. As chain length increases, dispersion interactions between the alcohol alkyl chain and the aromatic ring of p-cymene become more favourable, reducing the difference between unlike and like molecular interactions.
This behaviour has important implications for separation processes. Systems exhibiting larger positive deviations from Raoult's law generally display enhanced relative volatility, which can facilitate separation by distillation. Consequently, p-cymene mixtures containing short-chain alcohols may be easier to separate than those containing longer-chain alcohols and difficult to measured.
Table 4. T-x-y experimental data for p-cymene (1) + ethanol (2) system at 50 kPa.

T(K)

x1

y1

γ

334.82

1.000

1.000

335.45

0.965

0.999

12.730

335.95

0.897

0.998

7.444

336.75

0.787

0.996

3.538

337.95

0.531

0.989

2.574

338.95

0.337

0.983

1.393

342.35

0.211

0.968

1.279

358.15

0.057

0.902

1.169

388.75

0.020

0.702

1.132

408.25

0.017

0.451

1.111

419.85

0.011

0.141

1.078

421.75

0.008

0.074

1.035

422.85

0.006

0.031

1.019

423.25

0.000

0.000

Figure 3. T-x-y diagram for the p-cymene (1) + ethanol (2) system at 50 kPa: This study: x (●); y (●); NRTL model (-); Wilson model (---).
Table 5. T-x-y experimental data for p-cymene (1) + 1-propanol (2) system at 50 kPa.

T(K)

x1

y1

γ

353.35

1.000

1.000


354.65

0.945

0.991

1.003

356.45

0.858

0.972

1.021

358.05

0.777

0.955

1.050

359.65

0.676

0.939

1.106

361.45

0.508

0.924

1.284

366.45

0.292

0.884

1.816

372.05

0.153

0.843

2.776

380.45

0.070

0.782

4.115

391.85

0.043

0.681

3.787

407.55

0.021

0.413

2.686

418.45

0.011

0.201

1.989

420.35

0.009

0.153

1.632

421.85

0.007

0.122

1.545

422.95

0.006

0.092

1.469

424.55

0.000

0.000

Figure 4. T-x-y diagram for the p-cymene (1) + 1-propanol (2) system at 50 kPa: This study: x (●); y (●); NRTL model (-); Wilson model (---).
Table 6. T-x-y experimental data for p-cymene (1) + 2-propanol system at 50 kPa.

T(K)

x1

y1

γ

339.35

1.000

1.000

340.95

0.915

0.986

1.013

341.85

0.835

0.976

1.046

342.85

0.780

0.971

1.081

345.55

0.580

0.958

1.312

347.85

0.390

0.951

1.785

351.25

0.220

0.936

2.751

353.55

0.141

0.928

3.674

361.65

0.065

0.893

4.704

381.55

0.016

0.777

5.798

388.35

0.010

0.714

5.760

401.35

0.001

0.546

6.961

412.65

0.001

0.369

4.329

417.35

0.001

0.277

1.268

419.75

0.001

0.217

2.979

424.45

0.000

0.000


Figure 5. T-x-y diagram for the p-cymene (1) + 2-propanol (2) system at 50 kPa: This study: x (●); y (●); NRTL model (-); Wilson model (---).
Table 7. T-x-y experimental data for p-cymene (1) + 1-butanol system at 50 kPa.

T(K)

x1

y1

γ

373.75

1.000

1.000

373.77

0.986

0.985

1.000

374.05

0.923

0.958

1.004

374.75

0.869

0.937

1.011

377.55

0.746

0.904

1.027

380.25

0.647

0.866

1.047

382.35

0.554

0.837

1.077

385.55

0.424

0.784

1.145

390.85

0.272

0.704

1.233

395.55

0.167

0.624

1.413

403.15

0.051

0.464

3.051

410.55

0.008

0.301

4.147

414.45

0.000

0.185

6.560

417.95

0.000

0.000

Figure 6. T-x-y diagram for the p-cymene (1) + 1-butanol (2) system at 50 kPa: This study: x (●); y (●); NRTL model (-); Wilson model (---).
Table 8. T-x-y experimental data for p-cymene (1) + 1-pentanol (2) system at 50 kPa.

T(K)

x1

y1

γ

391.05

1.000

1.000

391.65

0.939

0.954

1.002

392.75

0.852

0.886

1.010

393.55

0.778

0.843

1.022

394.05

0.717

0.806

1.037

394.65

0.662

0.783

1.055

395.25

0.599

0.745

1.081

395.95

0.534

0.715

1.116

396.65

0.488

0.691

1.146

397.55

0.438

0.664

1.184

398.35

0.393

0.650

1.226

399.25

0.351

0.618

1.271

400.35

0.309

0.588

1.323

403.05

0.243

0.530

1.407

404.25

0.217

0.493

1.447

406.05

0.178

0.459

1.523

408.05

0.138

0.429

1.630

410.35

0.101

0.384

1.762

412.05

0.088

0.344

1.771

415.05

0.065

0.282

1.808

417.55

0.044

0.226

1.915

420.05

0.029

0.169

1.992

422.55

0.012

0.095

2.270

424.45

0.000

0.000

Figure 7. T-x-y diagram for the p-cymene (1) + 1-pentanol (2) system at 50 kPa: This study: x (●); y (●); NRTL model (-); Wilson model (---).
Table 9. T-x-y Experimental data for p-cymene (1) + 1-hexanol system at 50 kPa.

T(K)

x1

y1

γ

409.25

1.000

1.000

409.31

0.967

0.975

1.008

409.35

0.943

0.956

1.011

409.55

0.885

0.909

1.016

409.95

0.731

0.784

1.021

410.55

0.572

0.669

1.028

411.15

0.469

0.587

1.033

411.65

0.394

0.535

1.045

412.25

0.346

0.495

1.064

413.25

0.289

0.445

1.110

415.05

0.226

0.387

1.156

416.35

0.183

0.348

1.202

417.15

0.154

0.319

1.282

418.75

0.111

0.261

1.433

419.75

0.091

0.228

1.573

420.65

0.066

0.189

1.680

421.45

0.051

0.158

1.912

422.35

0.036

0.114

2.070

423.25

0.014

0.053

2.260

423.85

0.000

0.000


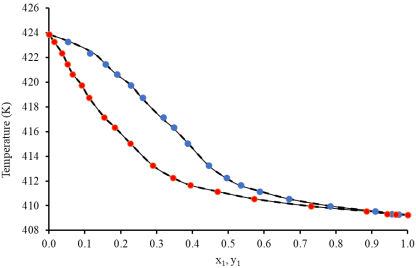
Figure 8. T-x-y diagram for the p-cymene (1) + 1-hexanol (2) system at 50 kPa: This study: x (●); y (●); NRTL model (-); Wilson model (---).
4.1.3. Azeotrope Determination from X-Y Equilibrium Diagrams
The x-y equilibrium diagrams revealed the occurrence of azeotropic behaviour in several of the investigated systems at 50 kPa. Azeotropes were identified by the intersection of the equilibrium curve with the diagonal reference line (x = y), corresponding to compositions at which the vapour and liquid phases possess identical compositions . Under these conditions, further separation by conventional distillation becomes impossible because no composition enrichment occurs between the liquid and vapour phases . For the p-cymene (1) + 1-hexanol (2) system, a minimum-boiling azeotrope was observed at approximately x1 = 0.790 at temperature of 410.16 K. The formation of these azeotropes is indicative of significant liquid-phase non-ideality arising from the disparity in molecular structure and intermolecular interactions between the terpene and alcohol molecules . Alcohol molecules are strongly self-associated through hydrogen bonding, whereas p-cymene is essentially non-polar hydrocarbons incapable of participating in comparable hydrogen-bond interactions . Consequently, unlike intermolecular interactions are weaker than the corresponding alcohol-alcohol interactions, producing positive deviations from Raoult's law and promoting minimum-boiling azeotrope formation .
The observed behaviour also suggests that alcohol structure influences azeotrope formation. Variations in carbon-chain length and branching alter both hydrogen-bonding characteristics and dispersion interactions with the terpene molecules, resulting in shifts in azeotropic composition and temperature . These findings highlight the importance of molecular structure in governing phase behaviour and demonstrate the need for experimentally determined equilibrium data when designing separation processes involving terpene-based solvents. From a process-design perspective, the occurrence of azeotropes is significant because it imposes a thermodynamic limit on separation by ordinary distillation. Alternative separation strategies, such as pressure-swing distillation, extractive distillation, or solvent-assisted separation, may therefore be required when high-purity components are desired .
4.2. Gibbs Energy Parameters from the Nrtl Model
The NRTL parameter sets obtained for the terpene-alcohol systems provide important insight into the molecular interactions governing the observed phase behaviour. The regressed parameters presented in Table 10 indicate that all systems exhibit strongly asymmetric intermolecular interactions characteristic of highly non-ideal polar/non-polar mixtures. The NRTL model successfully correlated all experimental VLE data, producing low temperature and composition deviations as presented in Figure 3 to 8. It is suitability for representing the highly non-ideal terpene-alcohol systems investigated . It was recommended that the α-parameter is set to 0.4 for alcohols The regressed interaction parameters revealed strong asymmetry in molecular interactions, reflecting the polarity differences between alcohols and terpene compounds. The parameters obtain are with the recommended range of -3000 to 15000 for systems containing terpenes and alcohols. Positive parameter values indicate energetically unfavourable alcohol-terpene interactions arising from disruption of alcohol hydrogen-bonding networks, whereas negative values reflect the greater stability of alcohol-rich environments . The interaction parameter magnitudes generally increased with alcohol chain length and branching, suggesting increasing molecular size mismatch and reduced packing efficiency. Overall, the parameter trends confirm the strongly non-ideal nature of the investigated systems and are consistent with the observed positive deviations from Raoult's law .
Table 10. Gibbs energy NRTL parameters.

Measured Systems

g12-g11J.mol-1

g21-g22J.mol-1

Ta/K

y2a

α12

p-cymene (1) + Ethanol (2)

1707.12

4978.97

0.614

0.001

0.4

p-cymene (1) +1-Propanol (2)

-1613.04

8620.43

0.466

0.004

0.4

p-cymene (1) + 2-Propanol (2)

1650.21

5726.38

0.059

0.019

0.4

p-cymene (1) + 1-Butanol (2)

-1667.80

11570.53

0.737

0.003

0.4

p-cymene (1) + 1-Pentanol (2)

-1999.15

7720.94

0.446

0.003

0.4

p-cymene (1) + 1-Hexanol (2)

-504.12

2660.18

0.462

0.004

0.4

4.3. Gibbs Energy Parameters from the Wilson Model
The Wilson model provided satisfactory correlations for all investigated systems. However, because it assumes complete liquid miscibility and does not explicitly account for local composition non-randomness, its performance was generally slightly inferior to that of the NRTL model for strongly non-ideal mixtures . The Wilson parameters presented in Table 11 indicate strongly asymmetric intermolecular interactions characteristic of highly non-ideal polar/non-polar mixtures . Large positive Gibbs energy differences, particularly for systems containing bulky alcohols such as 1-pentanol and branched alcohols, suggest poor molecular packing and weak unlike interactions, resulting in positive deviations from ideal behaviour . Conversely, strongly negative parameter values reflect the stabilising effect of alcohol-alcohol hydrogen bonding, which dominates the liquid structure in short-chain alcohol systems .
Table 11. Gibbs energy Wilson parameters.

Measured Systems

λ12-λ21J.mol-1

λ21-λ22J.mol-1

Ta/K

y2a

p-cymene (1) + Ethanol (2)

8118.72

-986.94

0.643

0.000

p-cymene (1) +1-Propanol (2)

6826.83

-3374.30

0.378

0.002

p-cymene (1) + 2-Propanol (2)

9029.86

-1330.26

0.028

0.019

p-cymene (1) + 1-Butanol (2)

3559.54

-3560.17

0.761

0.003

p-cymene (1) + 1-Pentanol (2)

9273.95

-3110.50

0.441

0.002

p-cymene (1) + 1-Hexanol (2)

-5598.25

10496.77

0093

0.004

Overall, the Wilson model reproduced the experimental equilibrium data with excellent accuracy, yielding temperature deviations below 1 K and very small vapour composition deviations. Although both models correlated the data successfully, the NRTL model generally provided slightly improved representation of highly asymmetric and sterically hindered systems because of its treatment of local non-randomness .
4.4. Statistical Analysis Using Bias% and Aad%
Table 12 gives the calculated BIAS and Absolute Average Deviation (AAD) for the NRTL and Wilson models conducted. Both models produced very low deviations for temperature predictions, with BIAS% typically below 0.25% and AAD% below 0.65%. Vapour-phase composition deviations were slightly larger because vapour compositions are more sensitive to activity coefficient behaviour and experimental uncertainty. Nevertheless, the deviations remained sufficiently small to confirm excellent model performance. The NRTL model generally performed slightly better for systems exhibiting stronger non-ideality and molecular asymmetry, whereas the Wilson model performed comparably well for simpler alcohol systems . Similar trends have been reported in recent VLE studies, where NRTL generally exhibits superior performance for strongly asymmetric systems while Wilson correlations remain highly satisfactory for fully miscible binary mixtures .
Table 12. The BIAS% and AAD% among the NRTL model and Wilson model.

(%)

NRTL

Wilson

y2

T/K

y2

T/K

p-cymene (1) + Ethanol (2)

BIAS

-1.582

0.17

-0.056

0.18

AAD

1.375

0.26

0.594

0.40

p-cymene (1) + 1-Propanol (2)

BIAS

-1.305

0.13

-1.305

0.11

AAD

1.306

0.28

1.305

0.23

p-cymene (1) + 2-Propanol (2)

BIAS

1.103

-0.01

1.103

0.02

AAD

1.567

0.36

1.567

0.17

p-cymene (1) + 1-Butanol (2)

BIAS

-1.006

0.21

-1.006

0.21

AAD

1.193

0.44

1.194

0.64

p-cymene (1) + 1-Pentanol (2)

BIAS

1.562

0.11

1.561

0.11

AAD

1.307

0.18

2.307

0.14

p-cymene (1) + 1-Hexanol (2)

BIAS

1.141

0.18

1.141

0.02

AAD

1.612

0.27

1.612

0.11

4.5. Thermodynamic Consistency Test
In this study, the measured equilibrium data were evaluated using the Gibbs-Duhem relationship and the McDermott-Ellis consistency criterion . These are given in Table 13. All investigated systems satisfied the thermodynamic consistency criteria, with deviation parameters D remaining below the allowable Dmax limits . These results confirm that the experimental data are internally consistent, free from major systematic errors, and suitable for regression using activity coefficient models. The conclusion can be drawn that all the data are thermodynamically consistently.
Table 13. Results of thermodynamic consistency test.

Measured Systems

D

Dmax

Thermodynamic Consistency Test

p-cymene (1) + Ethanol (2)

0.095

0.502

Consistent/Pass

p-cymene (1) + 1-Propanol (2)

1.160

1.246

Consistent/Pass

p-cymene (1) + 2-Propanol (2)

0.111

0.518

Consistent/Pass

p-cymene (1) + 1-Butanol (2)

0.478

1.236

Consistent/Pass

p-cymene (1) + 1-Pentanol (2)

0.865

1.289

Consistent/Pass

p-cymene (1) + 1-Hexanol (2)

0.865

0.956

Consistent/Pass

4.6. Implications for Green Solvent Applications
The measured VLE data demonstrate of p-cymene exhibit predictable and well-characterised phase behaviour with alcohols under reduced-pressure conditions. The observed trends indicate that intermolecular interactions become increasingly favourable as alcohol chain length increases, resulting in reduced liquid-phase non-ideality and improved molecular compatibility within the mixtures .
From a process-design perspective, the generated data provide a reliable thermodynamic basis for the simulation and optimisation of vacuum distillation, solvent recovery, and extraction operations involving terpene-based solvents. The successful correlation of the experimental data using established activity coefficient models further facilitates implementation within commercial process simulators and process design software . Consequently, the present work contributes valuable thermodynamic information for the evaluation of p-cymene as a sustainable bio-based alternative to conventional petroleum-derived solvents and supports their potential application in greener separation processes .
5. Conclusions
New isobaric vapour-liquid equilibrium (VLE) data were measured at 50 kPa for binary systems containing the p-cymene with selected alcohols. The investigated binary systems comprised p-cymene with ethanol, 1-propanol, 2-propanol, 1-butanol, 1-pentanol, and 1-hexanol. The investigated mixtures exhibited positive deviations from Raoult’s law, as evidenced by activity coefficients greater than unity throughout most of the composition range. These deviations arise from the weak interactions between the non-polar terpene molecules and the hydrogen-bonding alcohol molecules. The magnitude of the non-ideality was strongly influenced by alcohol structure, with short-chain alcohols exhibiting the greatest deviations from ideal behaviour. As the alcohol carbon number increased, the degree of non-ideality decreased owing to the increasing hydrocarbon character of the alcohol molecules and the resulting enhancement of dispersion interactions with the terpene phase.
The binary system of p-cymene + 1-hexanol exhibited minimum-boiling azeotropic behaviour at 50 kPa. The occurrence of these azeotrope demonstrates the importance of intermolecular interactions in governing phase behaviour and establishes thermodynamic limits for separation by conventional distillation. The Wilson and NRTL activity coefficient models successfully correlated the experimental VLE data over the entire composition range. Both models produced low temperature and vapour-composition deviations, demonstrating their suitability for engineering calculations involving terpene-alcohol systems. All experimental datasets satisfied the McDermott-Ellis thermodynamic consistency criterion, confirming the reliability of the measured equilibrium data.
Overall, the results provide new thermodynamic data for terpene-alcohol systems under reduced-pressure conditions and contribute to the understanding of molecular interactions between renewable terpene solvents and alcohols. The generated VLE data and regressed interaction parameters provide a reliable basis for process simulation, solvent screening, and the design of sustainable separation processes involving p-cymene and α-pinene as potential green solvent alternatives. Future investigations should extend the measurements to additional operating pressures to evaluate pressure effects on phase behaviour and azeotrope formation. The application of advanced thermodynamic models, such as Cubic Plus Association (CPA) and Perturbed-Chain Statistical Associating Fluid Theory (PC-SAFT), may provide improved representation of hydrogen-bonding and association effects in terpene-alcohol systems. The CPA and PC-SAFT incorporates association sites and association energies directly into the model formulation, allowing a more realistic representation of the thermodynamic behavior of associating fluids. Furthermore, studies involving water-containing ternary mixtures and process simulation analyses are recommended to support the industrial implementation of terpene-based solvents in sustainable separation technologies. The p-cymene shows the potential solvent and it is recommended as an alternative solvent over traditional solvents.
Abbreviations

AAD

Absolute Average Deviation

AC

Activity Coefficient

CPA

Cubic Plus Association

NRTL

Non-Random Two-Liquid

P

Pressure (kPa)

Pc

Critical Pressure (kPa)

PC-SAFT

Perturbed-Chain Statistical Associating Fluid Theory

T

Temperature (K)

Tc

Critical Temperature (K)

VLE

Vapour Liquid Equilibrium

x

Liquid Composition

y

Vapour Composition

Acknowledgments
This study has been supported by the Durban University of Technology. Lwanele Mantshongane wishes to thank late Mrs N. P. Cele (DUT-Chemistry), Banzi Mbatha (PhD student); Takunda Muchingami (Peer student) and DUT Technical staff for their assistance. Lwanele would like thank Prof PT Ngema and Prof S Ramsuroop for their support for purchase equipment and consumables to execute the project and their guidance.
Author Contributions
Lwanele Mantshongane: Formal Analysis, Investigation, Methodology, Writing – original draft
Peterson Thokozani Ngema: Resources, Supervision, Writing – review & editing
Suresh Ramsuroop: Resources, Supervision, Writing – review & editing
Data Availability Statement
Data will be made available on request.
Conflicts of Interest
The authors declare no conflicts of interest.
References
[1] Li, Z., Smith, K. H., Stevens, G. W. The Use of Environmentally Sustainable Bio-Berived Solvents in Solvent Extraction Applications: A Review. Chinese Journal of Chemical Engineering. 2016, 24(2), 215-220.
[2] Reich, R., Sanhueza, V. Vapor-Liquid Equilibria for α-Pinene and β-Pinene and for These Pinenes with Heptane, Cyclohexane, 1-Octene and Cyclohexene. Fluid Phase Equilibria. 1992, 77, 313-325.
[3] Kodama, D., Shinobu, Y., Miyakoshi, Y., Kato, M. Vapour-Liquid Equilibria for Ethanol + Limonene and 1-Propanol + Limonene, Netsu Bussei. 2003, 17, (4), 266-269.
[4] Ngema, P. T., Matkowska, D., Naidoo, P., Hofman, T. Ramjugernath, D. Vapor-Liquid Equilibrium Data for Binary Systems of 1-Methyl-4-(1-methylethenyl)-cyclohexene+{Ethanol, Propan-1-ol, Propan-2-ol, Butan-1-ol, Pentan-1-ol, or Hexan-1-ol} at 40 kPa. Journal of Chemical and Engineering Data. 2012, 57 (7), 2053-2058.
[5] Harini, M., Adhikari, J., Rani, K. Y. Prediction of Vapor-Liquid Coexistence Data for p-Cymene Using Equation of State Methods and Monte Carlo Simulations. Journal of Chemical and Engineering Data. 2014, 59(10), 2987-2994.
[6] Wilson, G. M. Vapor-liquid equilibrium. XI: A New Expression for the Excess Free Energy of Mixing, Journal of American Chemical Society. 1964, 86, 127-130.
[7] Renon, H., Prausnitz, J. M. Local Compositions in Thermodynamic Excess Functions for Liquid Mixtures. AIChE Journal, 1968, 14(1), 135-144.
[8] McDermott, C., Ellis, S. A Multicomponent Consistency Test, Chemical Engineering Science. 1965, 20(4), 293-296.
[9] Ngema, P. T. Separation processes for high purity ethanol production, MTech dissertation, Durban University of Technology, South Africa; 2010.
[10] Joseph, M. A., Ramjugernath, D., Raal, J. Computer‐aided Measurement of Vapour‐Liquid Equilibria in a Dynamic Still at Sub‐Atmospheric Pressures. Developments in Chemical Engineering and Mineral Processing. 2002, 10 (5‐6), 615-637.
[11] Weast, R. C. (Ed. in chief) CRC Handbook of Physics and Chemistry 64th Edition, CRC Press Inc.: Boca Raton; 1983-1984.
[12] Julka, V., Chiplunkar, M., O'Young, L. Selecting Entrainers for Azeotropic Distillation. Chemical Engineering Progress. 2009, 105(3), 47-53.
[13] Widagdo, S., Seider, W. D. Azeotropic distillation. AIChE Journal. 1996, 42(1), 96-130.
[14] Kiss, A. A., Suszwalak, D. J. P. C. Enhanced Bioethanol Dehydration by Extractive and Azeotropic Distillation. Separation and Purification Technology. 2012, 86, 70-78.
[15] Shen, W., Benyounes, H., Song, J. A Review of Ternary Azeotropic Mixtures and Advanced Separation Strategies, Theoretical Foundations of Chemical Engineering. 2016, 50(1), 28-40.
[16] Zhingang, L., Xiaohong, W., Jianfeng, L. Correlation of Alcohol-Containing Highly Non-Ideal Systems Using the NRTL Model. Fluid Phase Equilibria. 2005. 234, 27-34.
[17] Prausnitz, J. M., Lichtenthaler, R. N., de Azevedo, E. G. Molecular thermodynamics of fluid-phase equilibria. 3rd ed. Upper Saddle River, NJ: Prentice Hall; 1999.
[18] Rodríguez, A., Canosa, J., Tojo, J. Vapour-Liquid Equilibrium of Alcohol + Hydrocarbon Systems, Fluid Phase Equilibria, 2004, 216, 247-251.
[19] Kontogeorgis, G. M., Folas, G. K. Thermodynamic models for industrial applications: from classical and advanced mixing rules to association theories. Chichester: John Wiley & Sons; 2010.
[20] Smith, J. M., Van Ness, H. C., Abbott, M. M. Introduction to chemical engineering thermodynamics, 7th ed. New York: McGraw-Hill; 2005.
[21] Gmehling, J., Kleiber, M., Kolbe, B. Rarey, J. Chemical thermodynamics for process simulation, 2nd ed. Weinheim: Wiley-VCH; 2019.
[22] Walas, S. M. Phase equilibrium in chemical engineering; Butterworth: Boston; 1985.
[23] Jaubert, J. N., Privat, R. Relationship Between Activity Coefficient Models and Modern Thermodynamic Modelling of Phase Equilibria, Fluid Phase Equilibria. 2021, 523, 112772.
[24] Wisniak, J. A New Test for the Thermodynamic Consistency of Vapor-Liquid Equilibrium Data, Industrial and Engineering Chemistry Research. 1993, 32(7), 1531-1533.
[25] Wisniak, J., Apelblat, A., Segura, H. An Assessment of Thermodynamic Consistency Tests for Vapor-Liquid Equilibrium Data. Physics and Chemistry of Liquids, 1997, 35(1), 1-58.
[26] Raal, J. D., Mühlbauer, A. L. Phase equilibria: Measurement and computation. Bristol: Taylor and Francis; 1998.
[27] Seader, J. D., Henley, E. J., Roper, D. K. Separation process principles. 3rd ed. Hoboken, NJ: John Wiley and Sons; 2011.
Cite This Article
  • APA Style

    Mantshongane, L., Ngema, P. T., Ramsuroop, S. (2026). Low-Pressure Vapor–Liquid Equilibrium Measurements and Thermodynamic Modelling of Binary Systems Containing p-Cymene and Alcohols. American Journal of Chemical Engineering, 14(4), 138-155. https://doi.org/10.11648/j.ajche.20261404.16

    Copy | Download

    ACS Style

    Mantshongane, L.; Ngema, P. T.; Ramsuroop, S. Low-Pressure Vapor–Liquid Equilibrium Measurements and Thermodynamic Modelling of Binary Systems Containing p-Cymene and Alcohols. Am. J. Chem. Eng. 2026, 14(4), 138-155. doi: 10.11648/j.ajche.20261404.16

    Copy | Download

    AMA Style

    Mantshongane L, Ngema PT, Ramsuroop S. Low-Pressure Vapor–Liquid Equilibrium Measurements and Thermodynamic Modelling of Binary Systems Containing p-Cymene and Alcohols. Am J Chem Eng. 2026;14(4):138-155. doi: 10.11648/j.ajche.20261404.16

    Copy | Download

  • @article{10.11648/j.ajche.20261404.16,
      author = {Lwanele Mantshongane and Peterson Thokozani Ngema and Suresh Ramsuroop},
      title = {Low-Pressure Vapor–Liquid Equilibrium Measurements and Thermodynamic Modelling of Binary Systems Containing p-Cymene and Alcohols},
      journal = {American Journal of Chemical Engineering},
      volume = {14},
      number = {4},
      pages = {138-155},
      doi = {10.11648/j.ajche.20261404.16},
      url = {https://doi.org/10.11648/j.ajche.20261404.16},
      eprint = {https://article.sciencepublishinggroup.com/pdf/10.11648.j.ajche.20261404.16},
      abstract = {This study investigated terpene (p-cymene) solvent as the potential replacement for traditional petrochemical solvents such as n-hexane that have been used for decades in chemical industries. The traditional solvents cause harm in human being and environment. The selected terpene solvent has been identified as potential natural green solvent due to that they are environmental benign, non-toxic, biodegradable, sustainable and produce minimum vapours. New isobaric vapour-liquid equilibrium (VLE) data were measured at 50 kPa for binary systems containing the p-cymene with selected six alcohols. The investigated binary systems comprised p-cymene + {ethanol or 1-propanol or 2-propanol or 1-butanol or 1-pentanol or 1-hexanol}. The experimental measurements were conducted using low pressure recirculation dynamic equilibrium still. All systems exhibited positive deviations from Raoult’s law, attributed to weak interactions between the non-polar terpene molecules and strongly hydrogen-bonding alcohols. The degree of non-ideality decreased with increasing alcohol chain length owing to improved dispersion interactions between the terpene and alcohol molecules. Most p-cymene systems did not exhibit azeotropic behaviour; however, a minimum-boiling azeotrope was observed for the p-cymene + 1-hexanol system. The experimental data were successfully correlated using the NRTL and Wilson activity coefficient models, both of which provided excellent agreement with the measured equilibrium data. The generated VLE data contribute to the optimisation of separation processes using p-cymene as green solvents. The terpene solvent shows the good separation, which it can be used as alternative solvent over tradition solvent n-hexane.},
     year = {2026}
    }
    

    Copy | Download

  • TY  - JOUR
    T1  - Low-Pressure Vapor–Liquid Equilibrium Measurements and Thermodynamic Modelling of Binary Systems Containing p-Cymene and Alcohols
    AU  - Lwanele Mantshongane
    AU  - Peterson Thokozani Ngema
    AU  - Suresh Ramsuroop
    Y1  - 2026/08/27
    PY  - 2026
    N1  - https://doi.org/10.11648/j.ajche.20261404.16
    DO  - 10.11648/j.ajche.20261404.16
    T2  - American Journal of Chemical Engineering
    JF  - American Journal of Chemical Engineering
    JO  - American Journal of Chemical Engineering
    SP  - 138
    EP  - 155
    PB  - Science Publishing Group
    SN  - 2330-8613
    UR  - https://doi.org/10.11648/j.ajche.20261404.16
    AB  - This study investigated terpene (p-cymene) solvent as the potential replacement for traditional petrochemical solvents such as n-hexane that have been used for decades in chemical industries. The traditional solvents cause harm in human being and environment. The selected terpene solvent has been identified as potential natural green solvent due to that they are environmental benign, non-toxic, biodegradable, sustainable and produce minimum vapours. New isobaric vapour-liquid equilibrium (VLE) data were measured at 50 kPa for binary systems containing the p-cymene with selected six alcohols. The investigated binary systems comprised p-cymene + {ethanol or 1-propanol or 2-propanol or 1-butanol or 1-pentanol or 1-hexanol}. The experimental measurements were conducted using low pressure recirculation dynamic equilibrium still. All systems exhibited positive deviations from Raoult’s law, attributed to weak interactions between the non-polar terpene molecules and strongly hydrogen-bonding alcohols. The degree of non-ideality decreased with increasing alcohol chain length owing to improved dispersion interactions between the terpene and alcohol molecules. Most p-cymene systems did not exhibit azeotropic behaviour; however, a minimum-boiling azeotrope was observed for the p-cymene + 1-hexanol system. The experimental data were successfully correlated using the NRTL and Wilson activity coefficient models, both of which provided excellent agreement with the measured equilibrium data. The generated VLE data contribute to the optimisation of separation processes using p-cymene as green solvents. The terpene solvent shows the good separation, which it can be used as alternative solvent over tradition solvent n-hexane.
    VL  - 14
    IS  - 4
    ER  - 

    Copy | Download

Author Information
  • Department of Chemical Engineering, Durban University of Technology, Durban, South Africa
  • Department of Chemical Engineering, Durban University of Technology, Durban, South Africa

  • Department of Chemical Engineering, Cape Peninsula University of Technology, Cape Town, South Africa

  • Abstract
  • Keywords
  • Document Sections

    1. 1. Introduction
    2. 2. Data Reduction and Thermodynamic Modelling
    3. 3. Apparatus and Experimental Methodology
    4. 4. Results and Discussion
    5. 5. Conclusions
    Show Full Outline
  • Abbreviations
  • Acknowledgments
  • Author Contributions
  • Data Availability Statement
  • Conflicts of Interest
  • References
  • Cite This Article
  • Author Information