Research Article | | Peer-Reviewed

Water Supply and Sanitation Crisis in Joragate Railway Slum, Khulna: A Study on Groundwater Quality, Hygiene Practices, and Health Risks

Received: 25 August 2025     Accepted: 8 September 2025     Published: 26 September 2025
Views:       Downloads:
Abstract

This study explored water quality, sanitation practices, waste disposal systems, and socio-economic conditions in the Joragate Railway Slum, located in Ward 21 of Khulna District, Bangladesh. Four blocks Greenland A, D, E, and F were selected and 300 households were surveyed. Data were collected using a structured questionnaire and simple random sampling techniques. Additionally, 14 groundwater samples were collected during the monsoon and winter seasons and analyzed for a range of physico-chemical parameters as well as microbial indicators were also tested. The results showed that while the water quality was generally acceptable, elevated sodium and alkalinity levels during winter raised concerns. Microbial contamination exceeded safe limits across all blocks, posing significant public health risks. The Water Quality Index (WQI) showed the water quality as generally good for drinking and domestic use, though hygiene practices and infrastructure gaps remain critical. Sanitation was inadequate, with reliance on pit latrines, child open defecation, and poor hygiene, though Greenland-F exhibited comparatively better awareness and cleanliness practices. The study emphasizes an urgent need for additional deep tubewells, improved sanitation, structured waste management, and public health education programs. Alongside, promoting hygiene awareness and proper waste disposal practices is vital for reducing disease risks and improving living conditions in this vulnerable community.

Published in American Journal of Environmental Protection (Volume 14, Issue 5)
DOI 10.11648/j.ajep.20251405.13
Page(s) 181-196
Creative Commons

This is an Open Access article, distributed under the terms of the Creative Commons Attribution 4.0 International License (http://creativecommons.org/licenses/by/4.0/), which permits unrestricted use, distribution and reproduction in any medium or format, provided the original work is properly cited.

Copyright

Copyright © The Author(s), 2025. Published by Science Publishing Group

Keywords

Groundwater Quality, Railway Slum, Sanitation, Waste Disposal, Water Quality Index (WQI)

1. Introduction
The foresight of safe and adequate water and sanitation stands as a foundation of public health and human dignity, globally known as a fundamental human right by the United Nations General Assembly . Therefore, access to safe drinking water and adequate sanitation remains a persistent challenge in urban slums of developing countries like Bangladesh, where rapid urbanization has outpaced the expansion of essential services . Globally, billions of people still lack access to safe drinking water and suitable sanitation services, with the burden falling most heavily on low and middle-income countries . Within these nations, urban informal settlements, commonly known as slums, represent particularly vulnerable environments, characterized by rapid and unplanned urbanization, high population density, and inadequate housing which often grapple with severe water and sanitation deficits . Conversely, the absence of inadequacy of safe water and sanitation infrastructure and practices spreads waterborne diseases, prolongs cycles of poverty, and disproportionately affects vulnerable populations worldwide .
Bangladesh is a rapidly developing nation in South Asia, and has witnessed significant urban growth in recent decades. While this urbanization has contributed to economic progress, it has also led to a substantial increase in the number of people living in urban slums . Subsequently, slums have become an inevitable feature of urban expansion, especially in its major cities, where rapid population growth and accelerated rural-to-urban migration have outstripped the capacity of urban infrastructure to keep pace . These informal settlements, often located in marginal and environmentally hazardous areas, are home to a significant portion of the urban population and are characterized by severe deprivations in basic services. In Bangladesh, slums are home to millions of people, with estimates suggesting that about 55% of the urban population lives in urban slums . Here, over 97% of Bangladesh’s population depends on groundwater, primarily from tubewells, for drinking purposes . Yet, a large segment of its population continues to endure severe poverty, substandard housing, and limited access to essential services necessary for basic well-being . However, rising groundwater salinity and contamination have been increasingly reported in coastal and urban regions, including Khulna, posing significant health risks . The challenges are compounded by multifaceted factors such as poverty, social exclusion, and limited access to formal governance structures, making it difficult for residents to advocate for their basic needs . As a result, rural inhabitants continue moving to cities in pursuit of better jobs and opportunities, the slum population keeps rising, a trend projected to persist in developing nations . However, many migrants end up trapped in cycles of poverty and social exclusion within these overcrowded settlements .
Previous studies have documented that sanitation coverage in Bangladeshi slums remains below 14%, with high reliance on pit latrines, open defecation, and indiscriminate waste dumping contributing to environmental degradation and health hazards . Among Bangladesh’s urban poor, railway slums form one of the most marginalized and neglected communities . Typically located along railway tracks, these settlements are marked by makeshift shelters, severe overcrowding, and a critical lack of planned infrastructure and essential services. Residents of slums frequently face precarious living conditions, including the constant threat of eviction, exposure to environmental hazards . Access to safe drinking water and adequate sanitation are fundamental human needs essential for health . In 2015, around 663 million people lacked access to safe drinking water, and poor water quality caused nearly 500 million people to suffer from waterborne diseases annually . Furthermore, 500,000 children die each year due to insufficient access to clean water . Diarrhea, one of the leading causes of death among children under five, results in approximately 1.5 million deaths annually, with more than half of these cases occurring in Africa and South Asia . Diarrheal diseases also contribute significantly to under nutrition in children . Microbial contamination in drinking water sources has consistently exceeded safe limits, underscoring the severe health risks faced by slum populations . It also includes the collection, transportation, treatment, and disposal or recycling of human waste, wastewater, and solid waste, and is closely linked to waste management and wastewater disposal
Khulna, the third-largest city in southwestern Bangladesh, is situated within the Ganges Delta and surrounded by industries, making it a key geographic, political, and economic hub. Rapid urbanization, industrial expansion, and population growth from surrounding districts have overwhelmed water and sanitation infrastructure. The city contains 1,134 slums, covering 8.14% of its area, with Khulna City Corporation overseeing 132 of varying sizes . Khulna’s unique geography, environmental vulnerabilities such as salinity intrusion and flood risks and socio-economic pressures create specific challenges in securing safe water and sanitation in slum areas like the Joragate Railway Slum in Ward 21, home to thousands living in precarious conditions. This study investigates groundwater quality and surveys 300 households to assess hygiene practices and related health risks. The goal is to generate evidence to guide targeted interventions, improve health outcomes, and deepen understanding of water and sanitation challenges in marginalized urban areas. Addressing these issues is critical to reducing health risks and enhancing living conditions.
This study is innovative because it goes beyond conventional water quality monitoring by combining seasonal groundwater analyses with sanitation practices, waste disposal patterns, socio-economic characteristics, and related health risks in a railway slum context. Unlike previous studies that mainly focused on either water quality or hygiene practices in isolation, our research adopts a holistic approach that captures the interconnectedness of physico-chemical parameters, microbial contamination, household behavior, and environmental challenges. By focusing on the Joragate Railway Slum, this study highlights the compounded vulnerabilities of marginalized urban populations while offering evidence-based recommendations for integrated WASH interventions.
2. Materials and Methods
2.1. Selection of Study Area
The present study was carried out in the Joragate Railway slum that lies on 21 no. Ward in Khulna City Corporation, which is a populated place. The area spans approximately 1.39 sq. km, with a population of around 24,984 (15,094 males and 9,890 females) as per BBS (2015) . Geographically, it lies between 22°50'39" N latitude and 89°33'52" E longitude. The slum is divided into six blocks: Greenland A to F. For a representative overview, four blocks were selected two larger ones (Greenland A and D) and two smaller ones (Greenland E and F) based on their relative size and household numbers.
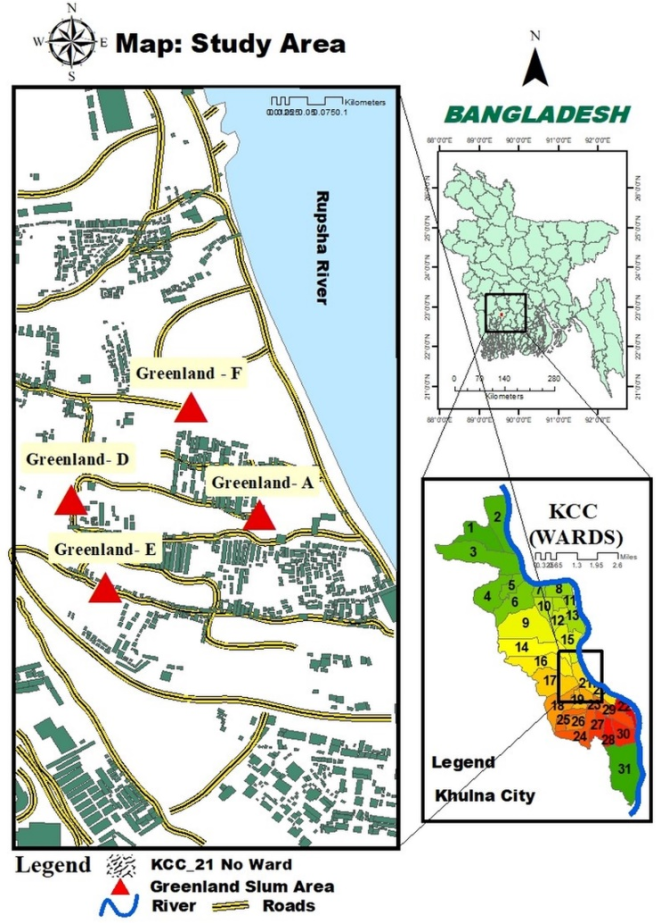
Figure 1. Location map of the study area.
2.2. Sampling Technique and Sample Size Estimation
The household counts in Greenland A, D, E, and F were 293, 294, 165, and 50 respectively. Using Kothari's (2004) sample size determination formula, 300 respondents were selected through random sampling. A total of 300 questionnaires were administered to gather information on water source locations, platform conditions, water collection and use, sanitation, solid waste management, drainage, and communication systems in the Joragate Railway slum.
2.3. Water Sample Collection and Laboratory Analysis
A total of 14 groundwater samples were carefully collected from deep tubewells across four blocks in the Joragate slum area during both the monsoon and winter seasons. Five samples each were taken from Greenland-A and Greenland-D, while Greenland-E and Greenland-F contributed two samples each. Before sampling, each tubewell was pumped continuously for five minutes to ensure fresh water. Water samples were obtained in freshly procured plastic bottles for physico-chemical analysis, while sterilize autoclavable bottles were employed for microbial assessment. All bottles were rinsed three to four times with the sample water to prevent contamination. The bottles were then filled completely and sealed tightly to maintain airtight conditions . Samples were immediately stored in a closed icebox and transported promptly to the laboratory. Sampling occurred during dry weather to avoid rainwater contamination. Upon arrival, pH, Electrical Conductivity (EC), Total Dissolved Solids (TDS), Escherichia coli (E. coli), Total Coliform (TC), and Fecal Coliform (FC) were measured immediately. Additional parameters including sodium (Na+), potassium (K+), calcium (Ca2+), magnesium (Mg2+), chloride (Cl⁻), sulfate (SO42⁻), phosphate (PO4³⁻), bicarbonate (HCO3⁻), nitrate (NO3⁻), salinity, and alkalinity were analyzed within one month following standard procedures . The selection of water quality parameters was based on their known significance in the hydro-chemical characterization of drinking water in the study area.
2.4. Water Quality Index (WQI) Calculation
In the study to assess water quality, the Water Quality Index (WQI) was determined using the Weighted Arithmetic Water Quality Index method that was proposed by Horton, 1965 . The WQI classifies water quality into five categories including Excellent (0-25), Good (26-50), Poor (51-75), Very Poor (76-100), and Unsuitable (>100), with corresponding Water Quality Status (WQS) and potential uses. Water within the Excellent to Poor range can be used for drinking, irrigation, and industrial purposes, while water rated as Very Poor or Unsuitable requires treatment before use, particularly for drinking or fish culture .
The WQI was calculated using the following equations:
WQI =n=1nwnQnn=1nwn
Qn= [(vn-vi)(Sn-vi )]×100
The quality rating for the nth water quality parameter is denoted as Qn, and the unit weight for each parameter is represented by Wn. The water quality parameters are indexed as n, and the estimated value of the nth parameter at a specific sampling station is Vn. The standard value for the nth parameter is Sn, while Vi represents the ideal value for the nth parameter (0 for all parameters, except for pH (7) and DO (14.6) . The unit weight for each water quality parameter, Wn, is calculated as being inversely proportional to the recommended standard value, Sn, using the equation Wn=K/Sn Where K is the proportionality constant. Values of K were calculated as; K = 1/[∑(1/Sn)].
2.5. Statistical Analysis of Data
After the analysis of parameters in the laboratory, data was analyzed using Microsoft Excel and Statistical Package for the Social Sciences (SPSS 21). Various statistical techniques were used to analyze data. Then the data was presented in tables, figures, graphs, and charts as well as a written script. The flow chart of the methodology is given in Figure 2.
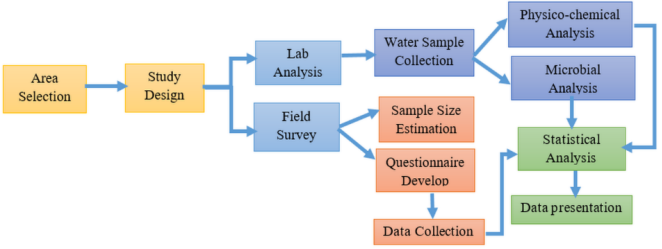
Figure 2. The flow chart of the methodology.
3. Results and Discussion
3.1. Socio-economic Characteristics of the Respondents
The socio-economic status of the respondents are presented in Table 1. In all blocks, females outnumbered males, with female representation ranging from 50% to 57%. Greenland-E reported the highest percentage of females (57%) and a notably youthful population, particularly in the 20–30 age group, along with a higher share of Muslims and day laborers compared to others. This demographic may reflect a stronger need for education, job training, and employment support. Greenland-A showed a more traditional family structure, with 67.8% of households comprising 3–5 members. It also had a higher rate of illiteracy and significant shares of low-income (30%) and day labor occupations (29.8%). These characteristics indicate increased socio-economic vulnerability, with limited access to education and stable employment opportunities. Greenland-D presented a mixed profile. While 42.3% of residents earn less than 10,000 Tk per month, the block also demonstrated relatively higher literacy levels compared to Greenland-A. Employment was diverse, including factory and day labor positions, and Greenland-D had the highest proportion of individuals earning over 20,000 Tk. This suggests some upward mobility potential despite a significant low-income population, reflecting a complex socio-economic landscape.
Greenland-F was the most economically diverse block, with the highest share of Hindus, a wide occupational range, and a significant portion of residents earning over 20,000 Tk. This suggests a more prosperous and possibly more economically integrated community, potentially influenced by varied employment opportunities or remittances. Overall, the socio-economic data indicate substantial variation across the Greenland blocks. Greenland-F appears relatively well-off, with a mix of occupations and income levels that suggest a community enjoying economic diversity and stability. In contrast, Greenland-A and Greenland-D faced more challenges, with many residents struggling with poverty, limited education, and reliance on low-paying jobs. Greenland-E, with its youthful population and active workforce, holds promise for growth especially if efforts are made to support education, skill development, and job opportunities for its residents.
Table 1. Socio-economic Characteristics of the Respondents.

Criteria / Blocks

Greenland-A

Greenland-D

Greenland-E

Greenland-F

Gender

Male

46

50

43

45

Female

54

50

57

55

Age Range

20-30 years

37.5

32.6

46

31

30-40 years

42.2

30

23.4

35

40-50 years

12

31

16.6

25.1

>50 years

8.3

6.4

14

8.9

Family Member

3-5

67.8

56.6

60.7

58.4

6-8

24.2

39.9

42

35.3

8-10

8

3.5

5.3

6.3

Educational Status

Literate

49.8

60.6

48.8

57.9

Illiterate

50.2

39.4

51.3

42.1

Religious Status

Muslim

96

99

100

-

Hindu

04

01

-

100

Occupation

Day labor

29.8

28.7

30.8

26.3

Rickshaw /Van driver

20.2

26.6

21.8

23.7

Factory worker

6.4

10.6

1.3

2.6

Little business

22.3

13.8

17.9

13.2

Others

21.3

20.2

28.2

34.2

Income Level

<10000 Tk

30

42.3

35

32.6

10000-20000 Tk

45.5

30.5

34.2

39.3

>20000 Tk

24.5

27.2

30.8

28.1

(Note: The values are given in frequency percentage; Sources: Field Survey)
3.2. Water Facilities of the Study Area
In the study area, 100% residents relied entirely on groundwater from deep tubewells for drinking, as no tap water services were available. Fourteen active tubewells served 819 households across four blocks five each in Greenland-A and D, and two each in E and F making access severely limited. Besides most residents in the study area relied on deep tubewells for bathing, cooking, washing, and other daily needs, though some also used ponds, shallow tubewells, or river water.
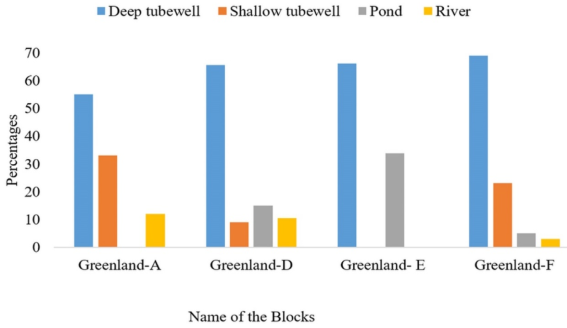
Figure 3. Available water sources for bathing and washing.
Figure 3 shows that available water sources for bathing and washing in all blocks, with highest use in Greenland-F (69%) and lowest in Greenland-A (55%). Shallow tubewells use was notable in Greenland-A and F but low in D (9%). Pond water was more common in Greenland-E (33.8%) but less in F (5%) and D (15%). River water use remained limited, highest in Greenland-A (12%), reflecting a lack of better alternatives for some residents. Access to water was entirely dependent on deep tubewells, but their limited number and high reliance across households create strong pressure on existing sources, often forcing residents to use unsafe alternatives.
3.3. Water Quality Analysis (Lab Analysis)
3.3.1. Physico-chemical Characterization of Water Samples
Table 2 presents the seasonal variation (monsoon and winter) of physico-chemical parameters in groundwater across four blocks: Greenland-A, D, E, and F. During monsoon in Greenland-A, water quality showed a neutral pH of 7.34, with moderate EC of 722.8 microsiemens per Centimeter (µs/cm) and TDS of 433.68 milligrams per litre (mg/L), all within permissible limits. Salinity was low at 0.35 part per thousand (ppt), and major cations Ca2+, Mg2+, Na+, and K+ were within safe ranges, although sodium was close to the guideline limit of 200 mg/L. Alkalinity (360 mg/L) and bicarbonate (439.2 mg/L) exceeded the drinking water standard, indicating a high buffering capacity. In winter, alkalinity and bicarbonate increased sharply to 612.5 mg/L and 747.2 mg/L, respectively. Magnesium rose to 53.23 mg/L, exceeding Bangladesh standards, while sodium remained near the permissible limit at 175 mg/L. Other ions, including SO42⁻, NO3⁻, Cl⁻, and PO4³⁻ remained well within safe limits. Greenland-D had the lowest values for most parameters, particularly in winter, with minimum EC and TDS. In Greenland-D, monsoon water quality showed pH 7.76, EC 734.4 µS/cm, and TDS 440.64 mg/L, indicating moderate mineralization. Sodium (186.86 mg/L) was near the guideline, while calcium and magnesium were within limits. Alkalinity (377.5 mg/L) and bicarbonate (460.55 mg/L) exceeded standards. In winter, alkalinity and bicarbonate increased further, and magnesium exceeded Bangladesh limits. Sodium remained stable, and chloride stayed within safe levels, showing seasonal elevation of alkalinity and bicarbonates with occasional magnesium exceedance. Greenland-E recorded a pH of 7.23 during the monsoon, indicating slightly neutral water. The EC was 744 µS/cm, reflecting moderate mineral content, while the TDS measured 446 mg/L, showing moderate dissolved salts in the water. Greenland-E recorded elevated levels of ions such as Na+, Ca2+, SO42⁻, Cl⁻, and HCO3⁻ especially in monsoon, with sodium having value of 209.16 mg/L exceeding standard limits. It also showed the highest monsoon bicarbonate level (510.87 mg/L). On the other hand, in winter, alkalinity (627.5 mg/L) and HCO3⁻ (766.5 mg/L) increased further, and Mg2+ (52.53 mg/L) crossed safe limits. Sodium (197.6 mg/L) remained close to the guideline value. Although SO42⁻, NO3⁻, and Cl⁻ were within limits, the persistently high alkalinity and sodium indicate potential concerns for drinking. In Greenland-F, the monsoon water quality showed a pH of 7.33, EC of 740 µS/cm, and TDS of 444 mg/L, all within safe limits. However, alkalinity (368.7 mg/L) and bicarbonate (450 mg/L) exceeded permissible values. Sodium concentration reached 200 mg/L, meeting the guideline limit, while magnesium remained within safe levels. Greenland-F exhibited higher concentrations of Mg2+ and K+, with Mg2+ surpassing World Health Organization (WHO) and Bangladesh (BD) standards in winter. It also recorded the highest winter alkalinity (643.75 mg/L) and bicarbonate (785.37 mg/L). Sodium (195.1 mg/L) stayed close to the threshold, while other parameters, including SO42⁻, NO3⁻, Cl⁻ remained well below guideline values. All blocks showed elevated bicarbonate levels in both seasons, exceeding safe drinking water limits. Additionally, winter alkalinity in all blocks surpassed the 500 mg/L threshold, violating WHO and BD drinking water standards. Elevated bicarbonate and alkalinity levels across all study areas likely stem from both natural and human-induced factors . Carbonate mineral dissolution in aquifers, along with sewage, detergents, and agricultural runoff, contribute to high concentrations, while seasonal salinity intrusion intensifies the problem during winter . In the absence of formal water treatment, residents rely on untreated sources, further aggravated by poor sanitation and hygiene practices. These conditions not only breached WHO and Bangladesh drinking water standards but also posed health risks and cause scaling in pipelines. Overall physico-chemical results showed that while most parameters remain within acceptable limits, high alkalinity, bicarbonate, sodium, and magnesium particularly in winter pose health and usability concerns. Community-based treatment, improved sanitation, and routine monitoring are essential to address these issues.
Table 2. Seasonal variation of physico-chemical parameters of water along with its standard.

Parameters

Monsoon

Standard

Winter

GL-A

GL-D

GL-E

GL-F

WHO

BD

GL-A

GL-D

GL-E

GL-F

pH

7.34

7.76

7.23

7.33

6.5-8.5

6.5-8.5

7.46

7.48

7.20

7.32

EC

722.8

734.4

743.5

740

1500

1000

681.6

639.2

680.5

693.5

TDS

433.68

440.64

446.1

444

500

<1000

408.9

383.5

408.3

416.1

Salinity

0.35

0.35

0.355

0.36

-

0.6

0.344

0.31

0.355

0.36

Alkalinity

360

377.5

418.75

368.7

500

-

612.5

562.5

627.5

643.75

Ca2+

34.4

38.4

42.04

39.07

75

<75

45.69

40.48

47.09

33.06

Mg2+

24.3

26.73

34.46

20.65

50

30-35

53.23

50.58

52.53

61.37

Na+

190.66

186.86

209.16

200

200

200

174.6

177.6

197.6

195.1

K+

5.48

5.39

5.7

5.76

12

12

7.24

6.76

7.75

6.96

SO42-

2.86

2.92

3.20

2.86

250

400

1.09

1.20

1.15

1.04

NO3-

0.55

0.56

0.55

0.68

11

10

0.73

0.48

0.40

0.49

Cl-

138.96

129.74

155.97

125.8

250

150-600

139.67

124

145.3

140

PO43-

0.1072

0.062

0.144

0.071

-

6

0.144

0.142

0.34

0.17

HCO3-

439.2

460.55

510.87

449.8

120

100-200

747.2

698.8

766.5

785.37

(Note: GL= Greenland; the unit of all parameters are in mg/L except pH, salinity (ppt), EC (µs/cm)
3.3.2. Microbial Characterization of Water Samples
Figure 4 illustrates the seasonal variation of microbial parameters across four blocks. During the monsoon, Greenland-A recorded high total coliforms (TC) at 166 Colony forming unit per 100 ml (CFU/100ml), alongside moderate fecal coliforms (13 CFU/100 mL) and very low E. coli (10 CFU/100 mL). In winter, the microbial load persisted as TC decreased to 118 CFU/100 mL and FC to 8 CFU/100 mL, while E. coli increased notably to 18 CFU/100 mL, indicating seasonal variation in contamination levels. In Greenland-D, microbial contamination was observed during the monsoon, with TC recorded at 118 CFU/100 mL, FC at 16 CFU/100 mL, and E. coli at 9 CFU/100 mL. In winter, the contamination remained significant as TC rose to 144 CFU/100 mL and E. coli sharply increased to 31 CFU/100 mL, while FC decreased to 4 CFU/100 mL, reflecting ongoing but fluctuating microbial pollution. Greenland-D saw a sharp rise in TC and E. coli during winter, suggesting deteriorating water quality and an urgent need for intervention. In Greenland E, microbial contamination was considerable during the monsoon with TC at 110 CFU/100 mL, FC at 9 CFU/100 mL, and E. coli at 6 CFU/100 mL. On the other hand in winter, the situation worsened as TC rose to 210 CFU/100 mL and E. coli increased to 30 CFU/100 mL, while FC remained at 6 CFU/100 mL, reflecting persistently poor microbial quality. In Greenland-F, microbial contamination was found to be significant across both seasons. During the monsoon, the contamination level reached its peak with total coliforms (TC) recorded at 250 CFU/100 mL, fecal coliforms (FC) at 29 CFU/100 mL, and E. coli at 10 CFU/100 mL, indicating a high level of microbial pollution. Although slightly reduced in winter, microbial load persisted, with TC at 220 CFU/100 mL, FC at 11 CFU/100 mL, and E. coli maintaining the same level of 10 CFU/100 mL. All blocks exceeded WHO and Bangladesh standards for TC, FC, and E. coli in drinking water. Moreover, the seasonal variations, with E. coli often intensifying in winter, point to complex contamination dynamics driven by both environmental and anthropogenic factors. This persistent contamination highlights urgent public health risks. Consequently, Comprehensive improvements in water treatment, sanitation, and hygiene are urgently required across all areas to ensure safe water access.
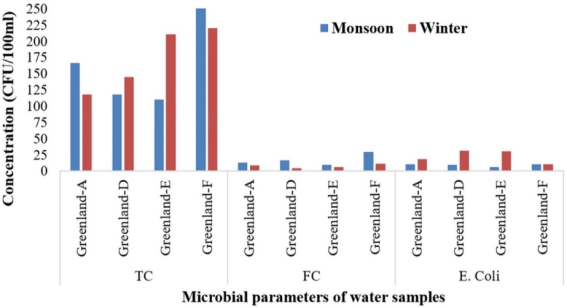
Figure 4. Seasonal variation of microbial parameters of drinking water samples.
3.4. Water Quality Index (WQI)
To accurately assess water quality, the study area was divided into four blocks, each evaluated individually. Twelve physico-chemical parameters were used to calculate the Water Quality Index (WQI), with unit weights (Wn) and standard values outlined in Table 3, along with seasonal variations across Greenland blocks A, D, E, and F. During the monsoon, Greenland-A recorded a WQI of 36.19, and in winter, it increased to 50.2. Both values fall within the Good category (25–50), indicating that water quality was generally acceptable. Greenland-D showed a WQI of 36.68 in the monsoon, which rose to 46.82 in winter. Although water remained in the Good category, the increase indicates seasonal changes, possibly linked to higher alkalinity and magnesium levels in winter. WQI in Greenland-E was the highest (39.71) among the blocks during the monsoon and further increased to 50.84 in winter. The consistently higher WQI suggests comparatively more mineralization or ionic load, yet water quality remains classified as Good. Greenland-F recorded a WQI of 36.93 in the monsoon and 50.14 in winter. Similar to the other blocks, the water quality falls under the Good category, with a slight seasonal increase indicating moderate seasonal impact on water quality parameters. Overall, all four blocks maintained WQI within the Good range in both seasons and suitable for drinking, domestic, irrigation, and industrial purposes., although winter values were slightly higher, reflecting seasonal increases in parameters such as bicarbonates, magnesium, and alkalinity. Although WQI values classify water as good for use, the index fails to capture microbial hazards, meaning that real risks to health are underestimated when relying on WQI alone. However, despite favorable WQI ratings, public awareness and education on water sanitation and hygiene remain essential. Promoting safe water use, proper storage, and improved hygiene practices is crucial to prevent waterborne diseases and minimize contamination risks in these vulnerable communities.
Table 3. Water Quality Index (WQI) of different blocks of the slum.

Para meters

WHO Std.

Unit weight (Wn)

Monsoon

Winter

GL-A

GL-D

GL-E

GL-F

GL-A

GL-D

GL-E

GL-F

WnQn

WnQn

WnQn

WnQn

WnQn

WnQn

WnQn

WnQn

pH

8.5

0.335

7.70

7.70

7.70

7.70

7.70

7.70

7.70

7.70

EC

1500

0.002

0.09

0.09

0.09

0.09

0.09

0.08

0.09

0.09

TDS

500

0.006

0.49

0.50

0.51

0.51

0.47

0.44

0.47

0.47

Na+

200

0.014

1.36

1.33

1.49

1.42

1.24

1.26

1.41

1.39

K+

12

0.237

11.01

10.65

11.27

11.39

14.32

13.37

15.32

13.77

Ca2+

75

0.038

1.74

1.94

2.13

1.98

2.31

2.05

2.38

1.67

Mg2+

50

0.057

2.77

3.04

3.92

2.35

6.06

5.76

5.98

6.99

Cl-

250

0.011

0.63

0.59

0.71

0.57

0.64

0.57

0.66

0.64

HCO3-

120

0.024

8.68

9.10

10.10

8.89

14.77

13.82

15.16

15.53

SO42-

250

0.011

0.01

0.01

0.01

0.01

0.00

0.01

0.01

0.00

NO3-

11

0.259

1.29

1.31

1.29

1.59

1.72

1.13

0.95

1.15

Alkal.

500

0.006

0.41

0.42

0.48

0.42

0.70

0.64

0.71

0.73

∑Wn

1.00

∑WnQn

36.19

36.68

39.71

36.93

50.2

46.82

50.84

50.14

WQI= ∑WnQn/∑Wn

36.19

36.68

39.71

36.93

50.2

46.82

50.84

50.14

WQI Status (25-50)

Good

Good

Good

Good

Good

Good

Good

Good

Note: GL= Greenland Alkal.= Alkalinit
3.5. Sanitation Facilities of the Study Area
Table 4 represents the existing sanitation facilities across the four blocks in the Joragate slum. Key aspects assessed include the condition of water collection platforms, types and usage patterns of latrines, child defecation practices, and drainage facilities. Most respondents in Greenland-A, E, and F rated water platform conditions as good to moderately good, while 52.1% in Greenland-D considered them unhealthy. Platform conditions were generally better in Greenland-A and F, and poorer in Greenland-D and E. Latrines were common across all blocks, with three types observed such as sanitary, pit, and hanging latrines. The coverage of sanitary latrines was highest in Greenland-A (63.3%) and lowest in Area D (17.7%). Pit latrines were more commonly found in Areas D, E, and F, whereas hanging latrines were reported only in Area D.
Table 4. Sanitation facilities across four blocks of the slum at a glance.

Blocks

Greenland-A

Greenland-D

Greenland-E

Greenland-F

Platform condition of water sources (%)

Good

33.70

19.80

13.90

47.20

Moderately good

34.40

28.10

52.30

38.80

Unhealthy

31.90

52.10

33.80

14.0

Category of latrine (%)

Sanitary

63.30

17.70

33.80

41.70

Pit

36.70

62.50

66.20

58.30

Hanging

-

19.80

-

-

Distance of Latrine from Household (HH) (%)

<10 m

22.5

54.2

32.30

28.0

10 m

33.5

27.0

36.90

42.20

>10 m

44

18.80

30.80

29.8

Community response about latrine use pattern (%)

1 HH

4.4

5.4

13.8

2.8

3-5 HH

25.6

39.6

20

44.0

6-10 HH

22.2

31.3

43.1

38.9

11-15 HH

17.7

11.4

23.1

14.3

15-20 HH

30.5

15.0

-

-

Place of defecation for children (<5 years) (%)

Open place

43.3

54.2

44.6

47.2

Drain

23

24.4

21.5

8.3

Latrine

33.7

21.4

33.9

44.5

Frequency of latrine washes (%)

4-6 days

1.1

-

-

-

7-10 days

60

67.7

60

83.3

>10 days

15.6

32.3

34.4

16.7

1 month

23.3

-

5.6

-

Responsibility of latrine wash (%)

Male

20

37.5

21.5

75

Female

80

62.5

78.5

25

Drainage facilities (%)

Yes

60

40

25

56

No

40

60

75

44

(HH= Household, Source: Field Survey)
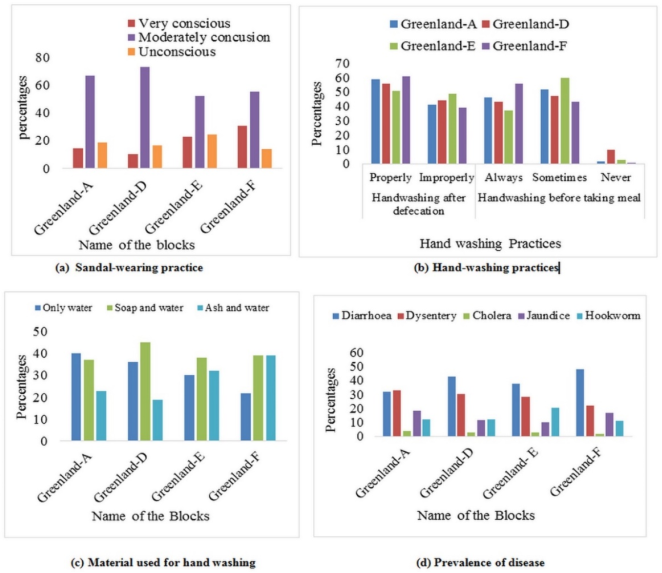
Figure 5. Different health and hygiene practices a) Sandal wearing practices b) Hand washing practices c) Used materials for hand washing and d) Prevalence of disease among the respondents in the study area.
Latrine sharing was widespread, with Greenland-D and F showing the highest rates of sharing among 3-10 households, and Greenland-A reporting some shared by up to 15–20 households. Open defecation among children under five was common, especially in D, while F had the highest latrine use (44.5%) for children. Mothers often believed children were too young for latrines, and pots were commonly used. Most households clean latrines every 7–10 days, mainly by women (71%). Greenland-F had the highest male involvement (75%). No proper drainage existed; open drains dominated, with Greenland-A having the best coverage. Sanitation coverage remained grossly inadequate, with widespread sharing of pit latrines, open defecation among children, and poor drainage, all of which contributed to environmental and health problems.
3.6. Health and Hygiene Practices of the Respondents
3.6.1. Hygienic Knowledge of Wearing Sandals to the Latrine
Figure 5(a) illustrates the practice of wearing sandals while using the latrine, a key hygiene behavior. Greenland-F showed the highest awareness, with 30.6% being highly conscious and only 14% unaware. Greenland-E followed but also had a significant number of unaware individuals, indicating a gap between knowledge and action. In Greenland-D, 73.2% were moderately aware, but only 10.3% were highly conscious, suggesting the habit was not well established. Greenland-A presented a more balanced awareness, though 18.6% remain unaware. These results point to the need for better hygiene education, particularly in less-aware blocks.
3.6.2. Hand Washing After Defecation and Before Meals
Figure 5(b) reveals hand washing habits after defecation and before eating. Greenland-F led, with 61% washing hands after defecation and 56% consistently before meals, followed by Greenland-A. Greenland-E had the lowest hygiene rates, with only 51% washing after defecation and many washing only occasionally before meals. Greenland-D showed the highest percentage (10%) of people who never wash before eating. Poor hygiene was linked to illiteracy and low awareness, especially among children and the elderly.
3.6.3. Materials Used for Hand Washing
Figure 5(c) shows that 40% of Greenland-D residents and 21% in F used only water. Soap use was relatively low, ranging from 37%–45%, while ash use was highest in Greenland-F (41%). From the result, it is observed that some people in these slums were conscious of hygienic practices but others were not. Generally older people were very unaware about hand wash with soap or ash. Slum dwellers' lifestyles, economic conditions, and education status also influenced hygienic practices.
3.6.4. Prevalence of Sanitation-Related Diseases
Figure 5(d) shows high rates of Diarrhea and Dysentery in all blocks. Diseases like Cholera, Diarrhea, Dysentery, Jaundice, and Hookworm which were generally found in the study area that strongly linked to poor sanitation, inadequate water supply, and poor hygiene practices. In Greenland-A, Diarrhea and dysentery were the most common diseases, together affecting 65.2% of the population but also faced significant Jaundice (18.6%) and Hookworm (12.2%) prevalence. while Greenland-F faced the most severe sanitation-related health issues, especially Diarrhea (48%) and Dysentery (22.2%). In Greenland-D, Diarrhea (42.7%) was the most prevalent disease, followed closely by dysentery (30.3%) and so on. In Greenland-E, Diarrhea and dysentery were common, although not as prevalent as in Greenland-D or Greenland-F. The 20.8% prevalence of hookworm was concerning in Greenland-E indicating a high risk of parasitic infections, likely from contaminated soil or poor hygiene.
Overall, these findings reveal that hygiene awareness and practices vary widely across the Greenland blocks, reflecting real challenges in daily life. Residents of Greenland-F tend to follow better hygiene habits, while those in Greenland-D and Greenland-E face greater difficulties in maintaining safe practices. These gaps are directly linked to the higher occurrence of sanitation-related illnesses in these communities, affecting health and well-being. This situation underscores the urgent need for not only targeted hygiene education and behavior-change programs but also improved sanitation infrastructure and reliable access to clean water, ensuring that all residents can live in healthier and safer environments.
3.7. Waste Disposal and Management
Solid waste in the area includes food, paper, plastics, bags, ashes, and broken items, mostly from households. Indiscriminate dumping was widespread especially in Greenland-D and E where over 50% was disposed of openly or into water bodies. Greenland-F had minimal water dumping but still showed over 70% improper disposal, while Greenland-A reported significant open and water-based waste dumping (Figure 6).
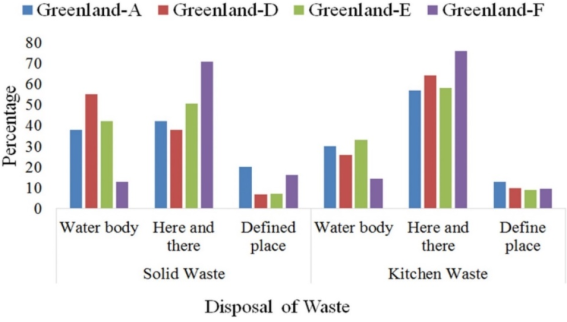
Figure 6. Disposal of solid waste and kitchen waste.
Field surveys and observations revealed a complete lack of dustbin facilities and no waste management initiatives by the City Corporation in the study area. Unlike other slums in Khulna, no collection vans or systems were present. Moreover, all respondents across the four blocks expressed dissatisfaction. Therefore, addressing this requires City Corporation involvement and increased community awareness on proper waste disposal. Consequently, waste management was virtually absent across the slum, leading to indiscriminate dumping into open spaces and water bodies, which in turn intensifies contamination and environmental degradation.
3.8. Environmental Issues of the Study Area
Each block in the study area faced distinct yet interconnected environmental issues, with waste disposal, water pollution, and odor problems being widespread but varying in severity. Greenland-A had the highest prevalence of the issue at approximately 28%, indicating that waste disposal challenges were most severe in this area. Greenland-E had the highest percentage of residents affected by water pollution (30.4%), which was the most severe water-related problem across all blocks. It may also be exacerbated by the lack of a proper sewage system and improper waste disposal, where untreated sewage and garbage are often dumped into open water sources. Greenland-F had the highest rate of waterlogging (20%) during the rainy season, and had the highest level of odor problems (28.4%) among all blocks, highlighting the significant sanitation challenges faced by residents in this area. Waterlogging in Greenland-F, particularly during the rainy season, can be linked to insufficient drainage infrastructure.
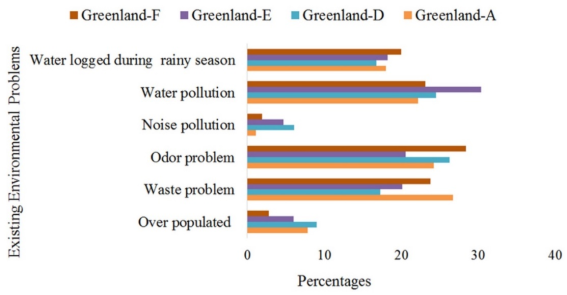
Figure 7. Existing environmental issues across the blocks of the slum.
This not only causes inconvenience and discomfort for residents but also creates ideal breeding grounds for mosquitoes, further increasing the risk of vector-borne diseases like malaria and dengue. The high percentage of residents affected by water pollution highlights the urgent need for better waste management practices, water treatment systems, and education on water sanitation in this block. In Greenland-D, overpopulation led to overcrowding and strained resources, while other blocks faced distinct environmental challenges: Greenland-A contends with severe waste disposal problems, Greenland-E struggles with water pollution, Greenland-F deals with waterlogging and odor. Collectively, these issues adversely affect health and daily life, highlighting the pressing need for enhanced sanitation, drainage infrastructure, and community education to mitigate environmental risks across all blocks.
4. Discussion
The study reveals a critical water, sanitation, and hygiene (WASH) crisis in Joragate Railway Slum, reflecting patterns commonly observed in urban slums across Bangladesh and other developing regions. Residents rely entirely on groundwater from deep tubewells, mirroring a national trend where over 97% of the population depends on tubewells for drinking water . However, seasonal variations in water quality raise serious health concerns. Elevated sodium levels during winter pose long-term risks such as hypertension and cardiovascular disease, particularly among vulnerable groups . while increased alkalinity affects water usability. These findings are consistent with earlier studies reporting rising salinity and ion concentrations in Khulna’s groundwater due to both natural and human-induced factors . Microbial contamination presents a severe public health threat. All water samples exceeded safe limits for E. coli, total coliforms (TC), and fecal coliforms (FC), echoing previous findings that link slum water supplies to diarrheal disease outbreaks . Although the Water Quality Index (WQI) rated the water as good based on physico-chemical parameters, it failed to capture microbial hazards, highlighting a limitation of WQI frameworks . The presence of unsafe water and high fecal contamination increases the risk of waterborne diseases such as diarrhea, cholera, and typhoid, especially affecting children and other vulnerable individuals . Sanitation infrastructure and waste management practices further aggravate the crisis. Open defecation, limited access to hygienic latrines, and indiscriminate waste disposal contribute to the contamination of both water sources and the surrounding environment. These issues are interconnected poor sanitation directly increases microbial loads in groundwater, while ineffective waste management worsens environmental degradation and health risks . National reports reveal that sanitation coverage in slums is below 14% , and global reviews have linked poor sanitation to recurrent disease outbreaks . Additionally, the unregulated dumping of solid waste into open areas and water bodies fuels pollution, a trend observed in many urban slums globally . The study also highlights poor hygiene practices, including inconsistent hand washing and reliance on water alone without soap or ash. These behaviors are strongly associated with poverty, limited education, and lack of awareness . The household survey confirms that socio-economic challenges such as low income and illiteracy restrict the ability of residents to adopt safe hygiene practices, reinforcing cycles of vulnerability. This is consistent with other studies emphasizing the need for targeted hygiene education to improve health outcomes .
Overall, the situation in Joragate Railway Slum reflects broader issues common in rapidly expanding urban areas of developing countries, where informal settlements often lack essential services . Addressing these challenges requires a multi-faceted approach, starting with immediate access to safe, affordable drinking water and improved sanitation through hygienic latrines and structured waste management. Long-term strategies should focus on hygiene education, community empowerment, and integrating slum populations into urban development plans. Collaboration among government bodies, NGOs, and local communities is vital for lasting change. This study provides a critical baseline for understanding the links between water quality, sanitation, and health risks in railway slums, and highlights the urgent need for continuous monitoring and coordinated interventions. This study has several limitations that should be acknowledged. First, the water quality assessment was based on only 14 groundwater samples collected from four blocks, which may not fully capture the spatial and temporal variability of contamination within the entire Joragate Railway Slum. Second, sampling was limited to two seasons (monsoon and winter), while transitional periods such as pre-monsoon and post-monsoon may reveal different contamination dynamics. Third, microbial tests were restricted to Escherichia coli, total coliforms, and fecal coliforms, leaving out other potential pathogens such as viruses, protozoa, and emerging contaminants. Despite these limitations, the study provides a valuable baseline for understanding the interconnected water, sanitation, hygiene, and health challenges in an urban railway slum context. Future research should therefore aim to conduct long term, year round monitoring of groundwater quality across a larger number of sampling sites to capture both seasonal and spatial variations. The integration of GIS-based spatial modeling could help identify contamination hotspots and patterns of environmental risk. Expanding microbial and chemical analyses to include heavy metals, pesticides, and pharmaceutical residues would offer a more comprehensive picture of potential health risks. Moreover, intervention based studies such as piloting improved sanitation infrastructure, structured waste management systems, or targeted hygiene education programs could provide evidence on the effectiveness of practical solutions. Comparative studies across multiple types of informal settlements, including other railway and urban slums in Bangladesh, would also strengthen the generalizability of findings and inform national-level WASH policy.
5. Conclusion
The research conducted in the Joragate Railway Slum and Greenland blocks (A, D, E, and F) of Khulna revealed critical deficiencies in water, sanitation, and hygiene (WASH) conditions, posing serious public health risks. The study identified widespread challenges across all blocks, with notable variations in socio-economic factors such as literacy, income, and occupations. During the monsoon, most physico-chemical parameters of water remained within acceptable limits, except for elevated sodium levels (209.16 mg/L in Greenland-E). Although the Water Quality Index (WQI) indicated water suitability, laboratory tests in winter revealed excessive sodium, alkalinity, bicarbonate, and magnesium, surpassing national and WHO safety standards. Alarmingly, microbial contamination was consistently above permissible levels throughout the year, indicating a constant threat of waterborne diseases. Sanitation infrastructure is grossly inadequate, with prevalent use of basic latrines and open defecation, especially among children. Hygiene awareness remained low in Greenland-D and E, linked to poor waste disposal practices. Solid and kitchen waste was commonly dumped in open areas and water bodies, exacerbating pollution and disease risks. High incidences of diarrhea, dysentery, jaundice, and hookworm were reported. However, Greenland-F demonstrated relatively better hygiene practices. Lack of city corporation support further intensifies these issues. The study calls for urgent action, including installing deep tubewells, implementing organized waste management, and launching comprehensive hygiene education programs. Community involvement and public health awareness are crucial to mitigating disease risks and improving WASH conditions in this vulnerable urban population.
Abbreviations

WQI

Water Quality Index

E. coli

Escherichia coli

TC

Total Coliform

FC

Fecal Coliform

WHO

World Health Organization

BD

Bangladesh

TDS

Total Dissolved Solids

EC

Electrical Conductivity

CFU

Colony Forming Unit

SPSS

Statistical Package for the Social Sciences

µS/cm

Microsiemens per Centimeter

PPT

Part Per Thousand

mg/L

Milligrams per Litre

Funding
This work is completely self-funded.
Acknowledgments
The authors are grateful to the Environmental Science Discipline for providing the logistical support to complete the work successfully.
Conflicts of Interest
The authors declare no conflicts of interest.
References
[1] UN. (2010). General Assembly Resolution 64/292: The human right to water and sanitation. United Nations.
[2] Ahmed, M. F. (2002). Alternative water supply options for arsenic affected areas of Bangladesh. In Arsenic mitigation in Bangladesh. International Workshop on Arsenic Mitigation in Bangladesh, Dhaka (pp. 14-16).
[3] Uddin, S. M. N. (2018). Water, Sanitation and Hygiene (WASH) Practices in Urban Slums: A Case Study of Khulna City, Bangladesh. International Journal of Environmental Sciences, 4(2), 45-55.
[4] WHO. (2019). Global strategy on health, environment and climate change: the transformation needed to improve lives and well-being sustainably through healthy environments. World Health Organization.
[5] WHO & UNICEF. (2023). Progress on household drinking water, sanitation and hygiene 2000-2022: Special focus on gender. World Health Organization and UNICEF.
[6] Davis, M. (2010). Planet of Slums: Urban Involution and the Informal Proletariat‖ (2004). Cultural Theory: An Anthology, 318.
[7] UN-Habitat. (2010). State of the world’s cities 2010/2011: Bridging the urban divide. Earthscan.
[8] Rahman, M. M., & Hossain, M. M. (2012). Water quality and health hazard in the river Buriganga, Bangladesh. Global Science Research Journals, 1(5), 44-51.
[9] Hanchett, S., Akhter, S., Khan, M. H., Mezulianik, S., & Blagbrough, V. (2003). Water, sanitation and hygiene in Bangladeshi slums: an evaluation of the SHEWA-B project. Journal of Water Health, 1(2), 45-58.
[10] UNICEF. (2015). Progress on Sanitation and Drinking Water: 2015 Update and MDG Assessment. World Health Organization.
[11] WHO. (2013). Ending Preventable Child Deaths from Pneumonia and Diarrhoea by 2025: The Integrated Global Action Plan for Pneumonia and Diarrhoea (GAPPD).
[12] Islam, N. (2012). Urbanisation in Bangladesh: Patterns, drivers, and policy implications. In Urbanization and sustainability in Asia (pp. 117-132). Springer.
[13] Hasnat, G. N., Kabir, M. A., & Hossain, M. A. (2019). Major environmental issues and problems of South Asia, particularly Bangladesh. In Handbook of environmental materials management (pp. 109-148). Springer, Cham.
[14] Swapan, M. S. H., Zaman, A. U., Ahsan, T., & Ahmed, F. (2017). Transforming urban dichotomies and challenges of South Asian megacities: Rethinking sustainable growth of Dhaka, Bangladesh. Urban Science, 1(4), 31.
[15] Moreno, E. L., & Clos, J. (2016). Urbanization and Development: Emerging Futures. UN-Habitat.
[16] Montgomery, M. R., & Stokes, A. M. (2008). Urban settlements, water quality, and child mortality in developing countries. Population and Environment, 29(2), 171-190.
[17] Mahmud, A., Sikder, S., & Joardar, J. C. (2020). Assessment of groundwater quality in Khulna city of Bangladesh. Applied Water Science, 10, 226.
[18] Roy, A. (2011). Slumdog cities: Rethinking subaltern urbanism. International Journal of Urban and Regional Research, 35(2), 223-238.
[19] Angeles, G., Lance, P., Barden-O'Fallon, J., Islam, N., Mahbub, A. Q. M., and Nazem, N. I. (2009). The 2005 census and mapping of slums in Bangladesh: design, select results and application. International journal of health geographics, 8(1), 32.
[20] Rashid, S. F. (2009). Strategies to reduce exclusion among populations living in urban slum settlements in Bangladesh. Journal of Health, Population and Nutrition, 27(4), 574-586.
[21] Chowdhury, F. K., & Rahman, S. Z. (2023). Slums and entrepreneurship as an impact of urban poverty and social exclusion in Dhaka, Bangladesh. World Review of Entrepreneurship, Management and Sustainable Development, 19(6), 502-519.
[22] USAID. (1999). Environmental Health Project: Improving Hygiene Behaviors for Water and Sanitation in Bangladesh.
[23] Ahmed, M. F. and Rahman, M. M. (2000). Water Supply and Sanitation. International Training Network (ITN), Bangladesh University of Engineering and Technology (BUET), Bangladesh, 301-338.
[24] Taranum, S., Haque, M. A., & Rahman, M. (2023). Factors Influencing Safe Drinking Water Practices in Urban Slums of Dhaka, Bangladesh. Journal of Water, Sanitation and Hygiene for Development, 13(1), 34-47.
[25] Rana, M. M. P. (2011). Urbanization and sustainability: Challenges and strategies for sustainable urban development in Bangladesh. Environment, Development and Sustainability, 13(1), 237-256.
[26] Sinthia, S. A. (2020). Analysis of urban slum: case study of Korail slum, Dhaka. Int J Urban Civil Eng, 14(11), 416-430.
[27] Chambers, R., & Von Medeazza, G. (2013). Sanitation and Stunting in India. Economic & Political Weekly, 48(25), 15.
[28] BBS. (2015). Census of slum areas and floating population. Dhaka.
[29] Kothari, C. R. (2004). Research methodology: Methods and techniques. New Age International.
[30] Ramesh, R. M. and Anbu, M. (1996). Chemical Methods for Environmental Analysis Water and Sediment. MacMillan India Limited Publication, 15-67.
[31] APHA. (1994). Standards methods for the examination of water and waste water.15thedn. American Public Health Association, Washington, DC., USA.
[32] Horton, R. K. (1965). An index number system for rating water quality. J Water Pollut Control Fed, 37(3), 300-306.
[33] Brown, E., Skougstad, M. W., & Fishman, M. J. (1970). Methods for collection and analysis of water samples for dissolved minerals and gases (No. 05-A1). US Govt. Print. Off.
[34] Tyagi, S., Sharma, B., Singh, P., & Dobhal, R. (2013). Water quality assessment in terms of water quality index. American Journal of Water Resources, 1(3), 34-38.
[35] Cude, C. G. (2001). Oregon Water Quality Index a Tool for Evaluating Water Quality Management Effectiveness’. Journal of the American Water Resources Association, 37(1), 125-137.
[36] Islam, M. S., & Majumder, S. M. M. H. (2020). Alkalinity and hardness of natural waters in Chittagong City of Bangladesh. International Journal of Science and Business, 4(1), 137-150.
[37] Shammi, M., Rahman, M. M., Bondad, S. E., & Bodrud-Doza, M. (2019). Impacts of salinity intrusion in community health: a review of experiences on drinking water sodium from coastal areas of Bangladesh. In Healthcare. 7(1), 50. MDPI.
[38] WHO. (2011). Guidelines for drinking-water quality. World Health Organization, 4th edn. WHO, Geneva.
[39] Isunju, J. B., Schwartz, K., Schouten, M. A., Johnson, W. P., & van Dijk, M. P. (2011). Socio-economic aspects of improved sanitation in slums: a review. Public health, 125(6), 368-376.
[40] Khan, M. A. (2022). Livelihood, WASH related hardships and needs assessment of climate migrants: evidence from urban slums in Bangladesh. Heliyon, 8(5).
Cite This Article
  • APA Style

    Mou, S. I., Paul, R., Haque, F., Swarnokar, S. C. (2025). Water Supply and Sanitation Crisis in Joragate Railway Slum, Khulna: A Study on Groundwater Quality, Hygiene Practices, and Health Risks. American Journal of Environmental Protection, 14(5), 181-196. https://doi.org/10.11648/j.ajep.20251405.13

    Copy | Download

    ACS Style

    Mou, S. I.; Paul, R.; Haque, F.; Swarnokar, S. C. Water Supply and Sanitation Crisis in Joragate Railway Slum, Khulna: A Study on Groundwater Quality, Hygiene Practices, and Health Risks. Am. J. Environ. Prot. 2025, 14(5), 181-196. doi: 10.11648/j.ajep.20251405.13

    Copy | Download

    AMA Style

    Mou SI, Paul R, Haque F, Swarnokar SC. Water Supply and Sanitation Crisis in Joragate Railway Slum, Khulna: A Study on Groundwater Quality, Hygiene Practices, and Health Risks. Am J Environ Prot. 2025;14(5):181-196. doi: 10.11648/j.ajep.20251405.13

    Copy | Download

  • @article{10.11648/j.ajep.20251405.13,
      author = {Sadia Islam Mou and Rita Paul and Farhana Haque and Sadhon Chandra Swarnokar},
      title = {Water Supply and Sanitation Crisis in Joragate Railway Slum, Khulna: A Study on Groundwater Quality, Hygiene Practices, and Health Risks
    },
      journal = {American Journal of Environmental Protection},
      volume = {14},
      number = {5},
      pages = {181-196},
      doi = {10.11648/j.ajep.20251405.13},
      url = {https://doi.org/10.11648/j.ajep.20251405.13},
      eprint = {https://article.sciencepublishinggroup.com/pdf/10.11648.j.ajep.20251405.13},
      abstract = {This study explored water quality, sanitation practices, waste disposal systems, and socio-economic conditions in the Joragate Railway Slum, located in Ward 21 of Khulna District, Bangladesh. Four blocks Greenland A, D, E, and F were selected and 300 households were surveyed. Data were collected using a structured questionnaire and simple random sampling techniques. Additionally, 14 groundwater samples were collected during the monsoon and winter seasons and analyzed for a range of physico-chemical parameters as well as microbial indicators were also tested. The results showed that while the water quality was generally acceptable, elevated sodium and alkalinity levels during winter raised concerns. Microbial contamination exceeded safe limits across all blocks, posing significant public health risks. The Water Quality Index (WQI) showed the water quality as generally good for drinking and domestic use, though hygiene practices and infrastructure gaps remain critical. Sanitation was inadequate, with reliance on pit latrines, child open defecation, and poor hygiene, though Greenland-F exhibited comparatively better awareness and cleanliness practices. The study emphasizes an urgent need for additional deep tubewells, improved sanitation, structured waste management, and public health education programs. Alongside, promoting hygiene awareness and proper waste disposal practices is vital for reducing disease risks and improving living conditions in this vulnerable community.
    },
     year = {2025}
    }
    

    Copy | Download

  • TY  - JOUR
    T1  - Water Supply and Sanitation Crisis in Joragate Railway Slum, Khulna: A Study on Groundwater Quality, Hygiene Practices, and Health Risks
    
    AU  - Sadia Islam Mou
    AU  - Rita Paul
    AU  - Farhana Haque
    AU  - Sadhon Chandra Swarnokar
    Y1  - 2025/09/26
    PY  - 2025
    N1  - https://doi.org/10.11648/j.ajep.20251405.13
    DO  - 10.11648/j.ajep.20251405.13
    T2  - American Journal of Environmental Protection
    JF  - American Journal of Environmental Protection
    JO  - American Journal of Environmental Protection
    SP  - 181
    EP  - 196
    PB  - Science Publishing Group
    SN  - 2328-5699
    UR  - https://doi.org/10.11648/j.ajep.20251405.13
    AB  - This study explored water quality, sanitation practices, waste disposal systems, and socio-economic conditions in the Joragate Railway Slum, located in Ward 21 of Khulna District, Bangladesh. Four blocks Greenland A, D, E, and F were selected and 300 households were surveyed. Data were collected using a structured questionnaire and simple random sampling techniques. Additionally, 14 groundwater samples were collected during the monsoon and winter seasons and analyzed for a range of physico-chemical parameters as well as microbial indicators were also tested. The results showed that while the water quality was generally acceptable, elevated sodium and alkalinity levels during winter raised concerns. Microbial contamination exceeded safe limits across all blocks, posing significant public health risks. The Water Quality Index (WQI) showed the water quality as generally good for drinking and domestic use, though hygiene practices and infrastructure gaps remain critical. Sanitation was inadequate, with reliance on pit latrines, child open defecation, and poor hygiene, though Greenland-F exhibited comparatively better awareness and cleanliness practices. The study emphasizes an urgent need for additional deep tubewells, improved sanitation, structured waste management, and public health education programs. Alongside, promoting hygiene awareness and proper waste disposal practices is vital for reducing disease risks and improving living conditions in this vulnerable community.
    
    VL  - 14
    IS  - 5
    ER  - 

    Copy | Download

Author Information
  • Environmental Science Discipline, Khulna University, Khulna, Bangladesh

  • Environmental Science Discipline, Khulna University, Khulna, Bangladesh

  • Environmental Science Discipline, Khulna University, Khulna, Bangladesh

  • Environmental Science Discipline, Khulna University, Khulna, Bangladesh

  • Abstract
  • Keywords
  • Document Sections

    1. 1. Introduction
    2. 2. Materials and Methods
    3. 3. Results and Discussion
    4. 4. Discussion
    5. 5. Conclusion
    Show Full Outline
  • Abbreviations
  • Funding
  • Acknowledgments
  • Conflicts of Interest
  • References
  • Cite This Article
  • Author Information