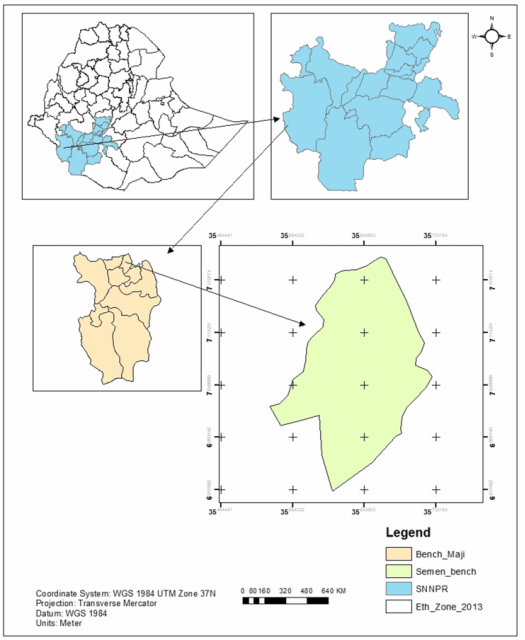
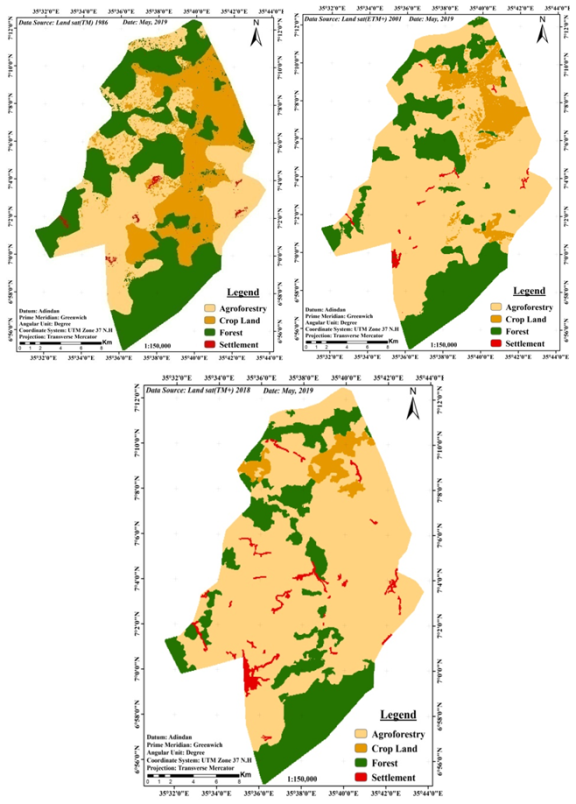
Land cover transformation exerts adverse effects on the environment. This study examined the changes in land cover in the Semen Bench District of southwest Ethiopia from 1986 to 2018, as well as its implications for soil physico-chemical properties. A mixed-method approach was employed, integrating remote sensing (RS) and geospatial data with soil physico-chemical analysis and key informant interviews. Landsat images were processed using ERDAS IMAGINE 2015, and the land use land cover (LU/LC) map was classified using a supervised method employing the maximum likelihood classifier (MLC) algorithm. The classification accuracy was 90%, 87.5%, and 90% for the years 1986, 2001, and 2018, respectively, with corresponding kappa coefficients of 0.87, 0.83, and 0.87. One-way analysis of variance (ANOVA) was conducted to assess differences in soil parameters across various land uses, utilizing SAS software (Version 9.3). The findings indicated that agroforestry and settlements increased by 95% and 428.7%, respectively, while forestland and cropland decreased by 38.6% and 96%, respectively, primarily driven by the expansion of cash crops such as coffee, khat, and eucalyptus, as well as population growth. Significant changes (P<0.05) were observed in soil bulk density, soil organic matter, soil pH, available phosphorus, total nitrogen, exchangeable cations, cation exchange capacity, and electrical conductivity, due to land cover change. Conversely, soil texture remained unaffected (P>0.05) by these transformations. Consequently, it is essential to develop sustainable natural resource management plans to combat deforestation and the decline in soil fertility.
| Published in | American Journal of Environmental Science and Engineering (Volume 8, Issue 3) |
| DOI | 10.11648/j.ajese.20240803.12 |
| Page(s) | 65-78 |
| Creative Commons |
This is an Open Access article, distributed under the terms of the Creative Commons Attribution 4.0 International License (http://creativecommons.org/licenses/by/4.0/), which permits unrestricted use, distribution and reproduction in any medium or format, provided the original work is properly cited. |
| Copyright |
Copyright © The Author(s), 2024. Published by Science Publishing Group |
Land Use Land Cover, Landsat, Soil Physic-Chemical Property
Satellite | Type of Sensor | Date of Acquisition | Resolution (m) | Path/ and Row | Bands used |
|---|---|---|---|---|---|
Landsat | TM | 1986 | 30 ×30 | 170/54 | 6 |
Landsat | ETM+ | 2001 | 30 ×30 | 170/54 | 6 |
Landsat | TM | 2018 | 30 ×30 | 170/54 | 6 |
Land cover class | Description |
|---|---|
Forest | Natural forestland dominated by dense tree and covered by more than 80% canopy. |
Agroforestry | Homegarden and plantation coffee with shade tree aggregated landscape |
Cropland | Spatially continuous small household agricultural farms |
Settlement | Land dominated with houses, huts and roads they used |
Land use category | 1986 | 2001 | 2018 | |||
|---|---|---|---|---|---|---|
UA (%) | PA (%) | UA (%) | PA (%) | UA (%) | PA (%) | |
Forest | 90.0 | 90.0 | 88.9 | 90.0 | 90 | 90 |
Agro forestry | 90.0 | 90.0 | 90.0 | 90.0 | 90 | 90 |
Crop Land | 90.0 | 90.0 | 90.0 | 90.0 | 90 | 90 |
Settlement | 90.0 | 90.0 | 81.8 | 80.0 | 90 | 90 |
Over all accuracy (%) | 90 | 87.5 | 90 | |||
Kappa coefficient | 0.87 | 0.83 | 0.87 | |||
Land use category | Land cover distribution | Land cover changes (%) | |||||||
|---|---|---|---|---|---|---|---|---|---|
1986 | 2001 | 2018 | 1986-2001 | 2001-2018 | 1986-2018 | ||||
Area (Km2) | % | Area (Km2) | % | Area (Km2) | % | ||||
Agroforestry | 138.39 | 35.89 | 250.31 | 64.9 | 271.00 | 70.26 | 80.87 | 8.27 | 95.1 |
Cropland | 99.44 | 25.79 | 35.82 | 9.29 | 15.08 | 3.91 | -63.98 | -57.9 | -96.07 |
Forestland | 145.90 | 37.84 | 96.74 | 25.1 | 89.6 | 23.25 | -33.69 | -7.38 | -38.59 |
Settlement | 1.88 | 0.49 | 2.74 | 0.71 | 9.94 | 2.58 | 45.75 | 262.77 | 428.72 |
385.62 | 100 | 385.62 | 100 | 385.62 | 100 | ||||
Land Cover Categories | Initial area (km2) (1986) | |||||
|---|---|---|---|---|---|---|
Agroforestry | Cropland | Forestland | Settlement | Total | ||
Final state (2018) | Agroforestry | 122.48 | 84.33 | 63.18 | 0.98 | 271.00 |
Cropland | 1.88 | 8.74 | 4.44 | 0.00 | 15.08 | |
Forestland | 7.87 | 4.32 | 77.38 | 0.06. | 89.6 | |
Settlement | 6.16 | 2.05 | 0.90 | 0.84 | 9.94 | |
Class Total | 138.39 | 99.44 | 145.90 | 1.88 | 385.62 | |
Class changes | 15.91 | 15.11 | 82.72 | 0.90 | ||
Image difference | 132.61. | -84.36 | -56.31 | 8.05 | ||
Land use | sand | Silt | Clay | BD (g/cm3) |
|---|---|---|---|---|
Agro-forestry | 60.83a | 23.67a | 15.5a | 0.96b |
Cropland | 55.17a | 28.33a | 16.5a | 1.03a |
Forestland | 57.33a | 30.67a | 14.33a | 0.78c |
LSD | NS | NS | NS | 0.07 |
CV%) | 6.9 | 22.04 | 15.66 | 6.37 |
Land use | pH | SOC% | TN% | AVP (ppm) | EC mS/cm | CEC | Ca2+ | Mg2+ | K+ | Na+ |
|---|---|---|---|---|---|---|---|---|---|---|
Agroforestry | 6.11a | 3.37b | 0.22b | 14.31b | 73b | 20.19b | 11.95b | 1.58b | 11.35b | 0.0146a |
Cropland | 5.49b | 1.86c | 0.09c | 9.32c | 44.53a | 13.91c | 8.06c | 1.12c | 6.96c | 0.00890b |
Forestland | 6.36a | 4.82a | 0.38a | 19.45a | 47.16a | 25.40a | 15.82a | 1.95a | 14.73a | 0.0094b |
LSD | 0.25 | 0.52 | 0.08 | 2.62 | 16.73 | 1.93 | 2.61 | 0.26 | 1.83 | 0.003 |
SEM | 0.08 | 0.16 | 0.028 | 0.83 | 5.31 | 0.73 | 0.94 | 0.09 | 0.61 | 0.00098 |
CV | 3.32 | 12.24 | 29.57 | 14.19 | 23.70 | 7.58 | 17.01 | 13.26 | 12.93 | 23.69 |
pH | SOC | TN | AP | EC | Sand | Clay | silt | CEC | Ca2+ | Mg2+ | K+ | Na+ | BD | |
|---|---|---|---|---|---|---|---|---|---|---|---|---|---|---|
pH | 1 | |||||||||||||
SOC | 0.46ns | 0.796** | ||||||||||||
TN | 0.46ns | 0.796** | 1 | |||||||||||
AP | 0.49* | 0.73** | 0.84** | 1 | ||||||||||
EC | 0.44ns | 0.83** | 0.80** | 0.63** | 1 | |||||||||
sand | -0.64** | 0.18ns | 0.018ns | 0.15ns | -0.088ns | 1 | ||||||||
clay | -0.33s | 0.23ns | 0.2s | 0.14ns | 0.15ns | 0.56* | 1 | |||||||
Silt | -0.198ns | -0.31ns | -0.39ns | -0.08ns | -0.40ns | 0.07ns | -0.24ns | 1 | ||||||
CEC | 0.43ns | 0.54* | 0.11ns | -0.06ns | 0.17ns | -0.54* | -0.68** | -0.54* | 1 | |||||
Ca2+ | 0.46ns | 0.83** | 0.79** | 0.84** | 0.78** | 0.14ns | 0.14ns | -0.103ns | -0.04ns | 1 | ||||
Mg2+ | 0.42ns | 0.79** | 0.71** | 0.78** | 0.73** | 0.072ns | 0.031ns | -0.102ns | 0.05ns | 0.87** | 1 | |||
K+ | 0.38ns | 0.81** | 0.72** | 0.73** | 0.77** | 0.013ns | 0.08ns | -0.04ns | -0.03ns | 0.89** | 0.88** | 1 | ||
Na+ | 0.38ns | 0.88** | 0.81** | 0.67** | 0.96** | 0.018ns | 0.15ns | -0.44ns | 0.20ns | 0.80** | 0.77** | 0.81** | 1 | |
BD | -0.64** | 0.17ns | 0.018ns | 0.15ns | -0.09ns | 0.99** | 0.56** | 0.071ns | -0.53* | 0.14ns | 0.07ns | 0.012ns | 0.016ns | 11 |
AAS | Atomic Absorption Spectrophotometer |
ANOVA | Analysis of Variance |
BD | Bulk Density |
CEC | Cation Exchange Capacity |
EC | Electrical Conductivity |
ERDAS | Earth Resources Data Analysis System |
FAO | Food and Agriculture Organization |
FGD | Focused Group Discussions |
GCP | Ground Control Points |
GPS | Global Positioning System |
LU/LC | Land Use Land Cover |
MLC | Maximum Likelihood Classification |
OC | Organic Carbon |
SOM | Soil Organic Matter |
TN | Total Nitrogen |
| [1] | World Resources Institute (WRI). (2001) A Guide to World Resources 2000–2001: People and Ecosystems: The Fraying Web of Life. Washington, DC, USA. |
| [2] | Agarwal, C., Green, G. M., Grove, J. M., Evans, T. P. and Schweik, C. M. (2002) A review and assessment of land-use change models: dynamics of space, time, and human choice. Vol. 297. |
| [3] | Millennium Ecosystem Assessment (MEA). (2005) Ecosystems and Human Well-being: Synthesis. Island Press, Washington, DC. |
| [4] | Kissinger, G., Herold, M. and De Sy, V. (2012) Drivers of Deforestation and Forest Degradation: A Synthesis Report for REDD+ Policymakers. Lexeme Consulting, Vancouver Canada. |
| [5] | FAO. (2016) State of the World’s Forests 2016. Forests and agriculture: land-use challenges and opportunities. Rome. |
| [6] | Keenan, R. J., Reams, G. A., Achard, F., de Freitas, J. V., Grainger, A. and Lindquist, E. (2015) Dynamics of global forest area: Results from the FAO Global Forest Resources Assessment 2015. Forest Ecology and Management, 352, 9-20. |
| [7] | Pender, J., Place, F., Hui, S. (2006) Strategies for sustainable land management in the East African highlands. Washington DC: International Food Policy Research Institute. |
| [8] | Nyssen, J., Poesen, J., Moeyersons, J., Deckers, J., Haile, M. and Lang, A. (2004) Human impact on the environment in the Ethiopian and Eritrean highlands —A state of the art. Earth-Science Reviews, 64, 273–320. |
| [9] | McGinley, M. (2008). ‘’Ethiopian montane moorlands.” In C. J. Cleveland (Ed.), Encyclopedia’of Earth. Washington, D. C.: Environmental Information Coalition, National Council for Science and the Environment. |
| [10] | Mulatu, K., Hunde, D and Kissi, E. (2014). Impacts of wetland cultivation on plant diversity and soil fertility in South-Bench District, Southwest Ethiopia. African Journal of Agricultural Research, 9, 2936-2947. |
| [11] | Gashaw, T., Asrat, F. and Edae, D. (2015) Forest Degradation in Ethiopia: Extent and Conservation Efforts. Pj Palgo Journal of Agriculture, 2, 49–56. |
| [12] | Hailemariam, S. N., Soromessa, T. and Teketay, D. (2016) Land use and land cover change in the Bale Mountain Eco-Region of Ethiopia during 1985 to 2015. Land, 5, p. 41. |
| [13] | Woldeamlak, B. and Solomon, A. (2013) Land-use and land-cover change and its environmental implications in a tropical highland watershed, Ethiopia. International Journal of Environ Studies, 70, 126–139. |
| [14] | Gebresamuel, G., Ram Singh, B. and Dick. Ø. (2010) Land-use changes and their impacts on soil degradation and surface runoff of two catchments of Northern Ethiopia. Acta Agriculturae Scandinavica Section B- Soil and Plant Science, 60, 211-226. |
| [15] | Kindu, M., Schneider, T., Teketay, D. and Knoke, T. (2015) Drivers of land use/land cover changes in Munessa-Shashemene landscape of the South-central Highlands of Ethiopia. Environ Monit Assess, 187, 452. |
| [16] | Kassa, H., Dondeyne, S., Poesen, J., Frankl, A. and Nyssen, J. (2017) Impact of deforestation on soil fertility, soil carbon and nitrogen stocks: the case of the Gacheb catchment in the White Nile Basin, Ethiopia. Agriculture, Ecosystems and Environment, 247, 273–282. |
| [17] | Mekuria, A. (2005) Forest Conversion-Soil degradation-Farmers' Perception Nexus: Implications for Sustainable Land use in the Southwest of Ethiopia. Doctoral Thesis. CuvillierVerlag, Germany. |
| [18] | Dereje, T. (2007) Forest cover change and socio-economic drivers in southwest Ethiopia Doctoral Dissertations, MSc thesis. University of Munchen, Germany. |
| [19] | Tadesse, G. E. (2013) Biodiversity and Livelihoods in Southwestern Ethiopia: Forest Loss and Prospects for Conservation in Shade Coffee Agroecosystems. Doctoral Dissertations, University of California, Santa Cruz, USA. |
| [20] | Kassa, H., Dondeyne, S., Poesen, J., Frankl, A. and Nyssen J. (2016) Transition From Forest-Based To Cereal-Based Agricultural Systems: A Review Of The Drivers Of Land Use Change and Degradation In Southwest Ethiopia. Land Degradation & Ddevelopment. |
| [21] | Miheretu, B. A. and Yimer, A. A. (2017) Land Use/Land Cover Changes And Their Environmental Implications In The Gelana Sub-Watershed Of Northern Highlands Of Ethiopia. Environmetal System Research 6. |
| [22] | Holliday, V. T. and Gartner, W. G. (2007) Methods of soil P analysis in archaeology. Journal of Archaeological Science, 34, 301–333. |
| [23] | Gelaw, AM. (2014) Soil Quality and Carbon Footprint of Different Land Uses by Smallholder Farmers in Ethiopia. Doctoral Thesis, Norwegian University of Life Sciences. |
| [24] | Tellen, V. A. and Yerima, B. P. K. (2019) Effects of land use change on soil physicochemical properties in selected areas in the North West region of Cameroon. Environ System Research, 7, 3. |
| [25] | Zajícov, K. and Chuman, T. (2019). Effect of land use on soil chemical properties after 190 years of forest to agricultural land conversion. Soil and Water Research, 14, 121–131. |
| [26] | Malo, D. D., Schumacher, T. E. and Doolittle, J. J. (2005) Long term cultivation impacts on selected soil properties in the northern Great Plains. Soil and Tillage Research, 81, 277–291. |
| [27] | Schulp, C. J. E. and Veldkamp, A. (2008) Long-term landscape –land use interactions as explaining factor for soil organic matter variability in Dutch agricultural landscapes. Geoderma, 146, 457–465. |
| [28] | Zhu, H., He, X., Wang, K., Su, Y. and Wu, J. (2012). Interactions of vegetation succession, soil bio-chemical properties and microbial communities in a karst ecosystem. European Journal of Soil Biology, 51, 1–7. |
| [29] | Gebresamuel, G., Singh, B. R. and Dick, Ø. (2010) Land-Use Changes And Their Impacts on Soil Degradation And Surface Runoff Of Two Catchments of Northern Ethiopia. Acta Agriculturae Scandinavica Section B Soil and Plant Science, 60, 211-226. |
| [30] | Lemenih, M. (2004) Effects of land use changes on soil quality and native flora degradation and restoration in the highlands of Ethiopia. V. 306. |
| [31] | Lemenih, M. and Itanna, F. (2004) Soil carbon stocks and turnovers in various vegetation types and arable lands along an elevation gradient in southern Ethiopia. Geoderma, 123, 177–188. |
| [32] | Tesfaye, M. A., Bravo, F., Ruiz-Peinado, R., Pando, V. and Bravo-Oviedo, A. (2016) Impact of changes in land use, species and elevation on soil organic carbon and total nitrogen in Ethiopian Central Highlands. Geoderma, 261, 70–79. |
| [33] | Buruso, F. H., Adimassu, Z. and Sibali, L. L., (2023) Effects of land use/land cover changes on soil properties in Rib watershed, Ethiopia. Catena, 224, p. 106977. |
| [34] | Friis, I. (1992) Forests and Forest Trees of Northeast Tropical Africa: Their Natural Habitats and Distribution Patterns in Ethiopia, Djibouti and Somalia, Royal Botanical Gardens, London. |
| [35] | Mulatu, K., Hundera, K. and Senbeta, F., 2024. Analysis of land use/land cover changes and landscape fragmentation in the Baro-Akobo Basin, Southwestern Ethiopia. Heliyon, 10(7). |
| [36] | Kassa, H., Frankl, A., Dondeyne, S., Poesen, J. and Nyssen, J. (2019). Sediment yield at southwest Ethiopia's forest frontier. Land Degradation and development, 1–11. |
| [37] | Bouyoucos, G. J. (1962) Hydrometer method improved for making particle size analyses of soils. Agronomy journal, 54, 464-465. |
| [38] | Grossman, R. B., Reinsch,. TG. (2002) Bulk density and linear extensibility. Pp. 201-225. In: Dane, H. J., Topp, G.. C (eds.). Methods of Soil Analysis Part 4 - Physical Methods. Soil Science Society of America, Inc, Madison, Wisconsin, USA. |
| [39] | Nelson, D. W. and Sommers, L. (1982) Total carbon, organic carbon, and organic matter 1. Methods of soil analysis. Part 2. Chemical and microbiological properties, (methods of soilan2), pp. 539-579. |
| [40] | Bremner, J. (1996) Nitrogen-total. Pp 1085-1121. In: Sparks, D., Page, A., Helmke, P., Loeppert, R., Soltanpour, P., Tabatabai, M., Johnston, C. and Sumner, M. (eds.). Methods of soil analysis. Part 3-Chemical methods. Soil Science Society of America USA. |
| [41] | Bray, R. H and Kurtz, L. T. (1945). Determination of Total Organic and Available Phosphorus in soils. Soil Science, 1945, 39-45. |
| [42] | Chapman, H. D. (1965). Cation exchange capacity. In: CA Black, L. E. and Ensminger, FE. |
| [43] | Turan, S. Ö. and Günlü, A. (2010) Spatial and temporal dynamics of land use pattern response to urbanization in Kastamonu. African Journal of Biotechnology, 9, 640–647. |
| [44] | Belayneh, Y., Ru, G., Guadie, A., Teffera, Z. L. and Tsega, M. (2018) Forest cover change and its driving forces in Fagita Lekoma District, Ethiopia. Journal of Forestry Research. |
| [45] | Solomon, N., Hishe, H., Annang, T., Pabi, O., Asante, I. K. and Birhane, E. (2018). Forest Cover Change, Key Drivers and Community Perception in Wujig Mahgo Waren Forest of Northern Ethiopia. Land, 7, 32. |
| [46] | WoldeYohannes, A., Cotter, M., Kelboro, G. and Dessalegn, W. (2018) Land Use and Land Cover Changes and Their Effects on the Landscape of Abaya-Chamo Basin, Southern Ethiopia. Land, 7, 2. |
| [47] | Tadesse, G., Zavaleta, E., Shennan, C. and FitzSimmons, M. (2014). Prospects for forest-based ecosystem services in forest-coffee mosaics as forest loss continues in southwestern Ethiopia. Applied Geography, 50, 144-151. |
| [48] | Mulatu, K. and Hunde, D. (2020) Agroforestry: A Supplementary Tool for Biodiversity Conservation and Climate Change Mitigation and Adaptation. International Journal of Ecotoxicology and Ecobiology, 5(3): 29-35. |
| [49] | Worku, H. E., Hunde, D. F. and Takele, S. (2017) Impacts of deforestation on the livelihood of smallholder farmers in Arba Minch Zuria Woreda, Southern Ethiopia. African Journal of Agricultural Research, 12, 1293-1305. |
| [50] | Karltun, E., Lemenih, M. and Tolera, M. (2013) Comparing farmers’ perception of soil fertility change with soil properties and crop performance in Beseku, Ethiopia. Land Degradation and Development, 24, 228–235. |
| [51] | Kifle, A. and Beyene, S. (2013) Effects of different land use systems on selected soil properties in South Ethiopia. Journal of Soil Science and Environmental Management, 4, 100-107. |
| [52] | Adugna, A. and Abegaz, A. (2016) Effects of land use changes on the dynamics of selected soil properties in northeast Wellega, Ethiopia. Soil, 2, 63-70. |
| [53] | Lobe, I., Amelung, W., Du Preez, C. C. (2001) Losses of soil carbon and nitrogen with prolonged arable cropping from sandy soils of the South African Highveld. Eurasian Journals of Soil Science, 52, 939101. |
| [54] | Asmare T. K., Abayneh B, Yigzaw M, Birhan T. A. (2023) The effect of land use type on selected soil physicochemical properties in Shihatig watershed, Dabat district, Northwest Ethiopia. Heliyon 9(4). |
| [55] | Girma K., Yimer F., Tamirat T., Abdelkadir A. (2023) Effect of Land Use Change on Soil Physico-Chemical Properties under Different Land Use System in Arsi Zone, Oromia Region, Ethiopia. Journal of Biology and Nature. 15(1): 57-69. |
| [56] | Saha, D. and Kukal, S. S. (2015) Soil structural stability and water retention characteristics under different land uses of degraded lower Himalayas of North-West India. Land degradation and development, 26, 263-271. |
| [57] | Kassa, H., Dondeyne, S., Poesen, J., Frankl, A. and Nyssen, J. (2018) Agro-ecological implications of forest and agroforestry systems conversion to cereal-based farming systems in the White Nile Basin, Ethiopia. Agroecology and Sustainable Food Systems, 42, 149–168. |
| [58] | Tufa, M., Melese, A. and Tena, W. (2019) Effects of land use types on selected soil physical and chemical properties: The case of Kuyu District, Ethiopia. Eurasian Journal of Soil Science, 8, 94 – 109. |
| [59] | Bore, G. and Bedadi, B. (2016) Impacts of land use types on selected soil physico-chemical properties of Loma Woreda, Dawuro Zone, Southern Ethiopia. Science, Technology and Arts Research Journal, 4, 40-48. |
| [60] | McLauchlan, K. (2006) The nature and longevity of agricultural impacts on soil carbon and nutrients: A review. Ecosystems, 9, 1364–1382. |
| [61] | Sui, Y. Y., Zhang, X. Y., Jiao, X. G., Wang, Q. C. and Zhao, J. (2005) Effect of long-term different fertilizer applications on organic matter and nitrogen of black farm-land. Journal of Soil and Water Conservation, 19, 190–192. |
| [62] | Brady, N. C. and Weil, R. R. (2001) The Nature and Properties of Soils. 13th ed. Prentice Hall, Upper Saddle River, NJ. |
| [63] | Yusran, F. H. (2010) The Relationship between Phosphate Adsorption and Soil Organic Carbon from Organic Matter Addition. Journals of Tropical Soils, 15, 1-10. |
| [64] | Venterink, H. O., Davidsson, T. E., Kiehl, K. and Leonardson, L (2002) Impact of Drying and Re-Wetting On N, P and K Dynamics in a Wetland Soil. Plant and Soil, 243, 119–130. |
| [65] | Tilahun, G. (2007). Soil fertility status as influenced by different land uses in Maybar areas of South Wello Zone, North Ethiopia. MSc Thesis, Haramaya University, Ethiopia. 40p. |
| [66] | Chimdi, A., Gebrekidan, H., Kibret, K. and Tadesse, A. (2012) Status of selected physicochemical properties of soils under different land use systems of Western Oromia, Ethiopia. Journal of Biodiversity and Environmental Sciences, 2, 57-71. |
| [67] | Defera, J (2019) Assessment of Physicochemical Properties of Soil Under Different Land Use Types at Wuye Gose Sub-Watershed, North Shoa Zone of Oromia Region, Ethiopia. Doctoral dissertation, Haramaya University. |
| [68] | Richards, L. A. (ed.). 1954. Diagnosis and Improvement of Saline and Alkali Soils. US Department Agriculture Handbook. 60. U. S. Gov. Printing. Office, Washington, DC. |
| [69] | Papini, R., Valboa, G., Favilli, F. and L’Abate, G. (2011) Influence of land use on organic carbon pool and chemical properties of Vertic Cambisols in central and southern Italy. Agriculture, Ecosystems and Environment, 140(1-2): 68–79. |
| [70] | Wakene, N. and Heluf, G. (2001) Assessment of important physicochemical properties of Dystric Udalf (Dystric Nitosols) under different management systems in Bako area, western Ethiopia. Alemaya University, Alemaya, Ethiopia. |
| [71] | Nega, E. (2006) Land Use Changes and their Effects on Soil Physical and Chemical Properties in Senbat Sub Watershed, Western Ethiopia. MSc Thesis, Alemaya University, Alemaya. 89p. |
| [72] | Donis, A. and Assefa, K. (2017) Assessement of physicochemical properties of soils as influenced by different land uses in Bedele area in Ilubabor zone, southwestern Ethiopia. International Journal of Agriculture Innovations and Research, 5, 2319-1473. |
APA Style
Gubila, M., Regassa, A., Legess, G., Mulatu, K. (2024). Land Use Land Cover Change and Its Effect on Selected Soil Physico-Chemical Properties in Southwest Ethiopia. American Journal of Environmental Science and Engineering, 8(3), 65-78. https://doi.org/10.11648/j.ajese.20240803.12
ACS Style
Gubila, M.; Regassa, A.; Legess, G.; Mulatu, K. Land Use Land Cover Change and Its Effect on Selected Soil Physico-Chemical Properties in Southwest Ethiopia. Am. J. Environ. Sci. Eng. 2024, 8(3), 65-78. doi: 10.11648/j.ajese.20240803.12
AMA Style
Gubila M, Regassa A, Legess G, Mulatu K. Land Use Land Cover Change and Its Effect on Selected Soil Physico-Chemical Properties in Southwest Ethiopia. Am J Environ Sci Eng. 2024;8(3):65-78. doi: 10.11648/j.ajese.20240803.12
@article{10.11648/j.ajese.20240803.12,
  author = {Mesfin Gubila and Alemayehu Regassa and Gudina Legess and Kassahun Mulatu},
  title = {Land Use Land Cover Change and Its Effect on Selected Soil Physico-Chemical Properties in Southwest Ethiopia
},
  journal = {American Journal of Environmental Science and Engineering},
  volume = {8},
  number = {3},
  pages = {65-78},
  doi = {10.11648/j.ajese.20240803.12},
  url = {https://doi.org/10.11648/j.ajese.20240803.12},
  eprint = {https://article.sciencepublishinggroup.com/pdf/10.11648.j.ajese.20240803.12},
  abstract = {Land cover transformation exerts adverse effects on the environment. This study examined the changes in land cover in the Semen Bench District of southwest Ethiopia from 1986 to 2018, as well as its implications for soil physico-chemical properties. A mixed-method approach was employed, integrating remote sensing (RS) and geospatial data with soil physico-chemical analysis and key informant interviews. Landsat images were processed using ERDAS IMAGINE 2015, and the land use land cover (LU/LC) map was classified using a supervised method employing the maximum likelihood classifier (MLC) algorithm. The classification accuracy was 90%, 87.5%, and 90% for the years 1986, 2001, and 2018, respectively, with corresponding kappa coefficients of 0.87, 0.83, and 0.87. One-way analysis of variance (ANOVA) was conducted to assess differences in soil parameters across various land uses, utilizing SAS software (Version 9.3). The findings indicated that agroforestry and settlements increased by 95% and 428.7%, respectively, while forestland and cropland decreased by 38.6% and 96%, respectively, primarily driven by the expansion of cash crops such as coffee, khat, and eucalyptus, as well as population growth. Significant changes (P0.05) by these transformations. Consequently, it is essential to develop sustainable natural resource management plans to combat deforestation and the decline in soil fertility.
},
 year = {2024}
}
TY  - JOUR
T1  - Land Use Land Cover Change and Its Effect on Selected Soil Physico-Chemical Properties in Southwest Ethiopia

AU  - Mesfin Gubila
AU  - Alemayehu Regassa
AU  - Gudina Legess
AU  - Kassahun Mulatu
Y1  - 2024/09/26
PY  - 2024
N1  - https://doi.org/10.11648/j.ajese.20240803.12
DO  - 10.11648/j.ajese.20240803.12
T2  - American Journal of Environmental Science and Engineering
JF  - American Journal of Environmental Science and Engineering
JO  - American Journal of Environmental Science and Engineering
SP  - 65
EP  - 78
PB  - Science Publishing Group
SN  - 2578-7993
UR  - https://doi.org/10.11648/j.ajese.20240803.12
AB  - Land cover transformation exerts adverse effects on the environment. This study examined the changes in land cover in the Semen Bench District of southwest Ethiopia from 1986 to 2018, as well as its implications for soil physico-chemical properties. A mixed-method approach was employed, integrating remote sensing (RS) and geospatial data with soil physico-chemical analysis and key informant interviews. Landsat images were processed using ERDAS IMAGINE 2015, and the land use land cover (LU/LC) map was classified using a supervised method employing the maximum likelihood classifier (MLC) algorithm. The classification accuracy was 90%, 87.5%, and 90% for the years 1986, 2001, and 2018, respectively, with corresponding kappa coefficients of 0.87, 0.83, and 0.87. One-way analysis of variance (ANOVA) was conducted to assess differences in soil parameters across various land uses, utilizing SAS software (Version 9.3). The findings indicated that agroforestry and settlements increased by 95% and 428.7%, respectively, while forestland and cropland decreased by 38.6% and 96%, respectively, primarily driven by the expansion of cash crops such as coffee, khat, and eucalyptus, as well as population growth. Significant changes (P0.05) by these transformations. Consequently, it is essential to develop sustainable natural resource management plans to combat deforestation and the decline in soil fertility.

VL  - 8
IS  - 3
ER  -
Bench Sheko Zone Agriculture Development Department, Mizan Teferi, Ethiopia
Research Fields: Mesfin Gubila: Land use land cover change analysis, Integrated watershed management and landscape response
Department of Natural Resource Management, Jimma University, Jimma, Ethiopia
Research Fields: Alemayehu Regassa: Soil Genesis, Soil Classification, Soil mapping, Land Evaluation, Land Use Land Cover Change Analysis
Center for Environmental Science, Addis Ababa University, Addis Ababa, Ethiopia
Research Fields: Gudina Legess: Land Use Land Cover Change Analysis, Forest management and mapping research, Climate change modeling, Machine Learning Algorithms for Cropping Patterns in Complex Agro-Ecosystems., Urban environmental Change modeling
Department of Natural Resource Management, Mizan Tepi University, Mizan Teferi, Ethiopia
Research Fields: Kassahun Mulatu: Land Use Land Cover Change Analysis, Wetland Resource Management and research, Watershed manage-ment and landscape ecology, Agroforestry and biodiversity research, Forest resource and its biodiversity research
Information