2. Materials and Methods
2.1. Study Site
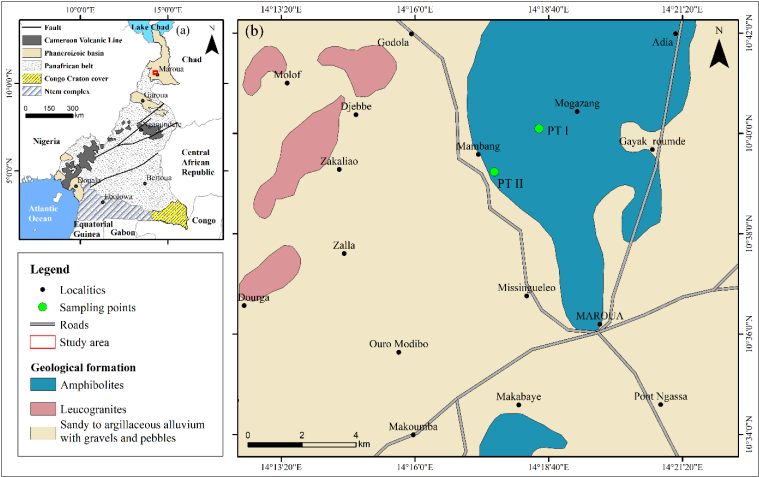
The experiment was carried out in Mambang II area, Diamaré division, and Far North region of Cameroon (10°37’ and 10°41’N; 14°16’ and 14°19’E) during the 2020 cropping season. The site was established on a total land area of 11,483 Km
2 (
Figures 1 and 2).
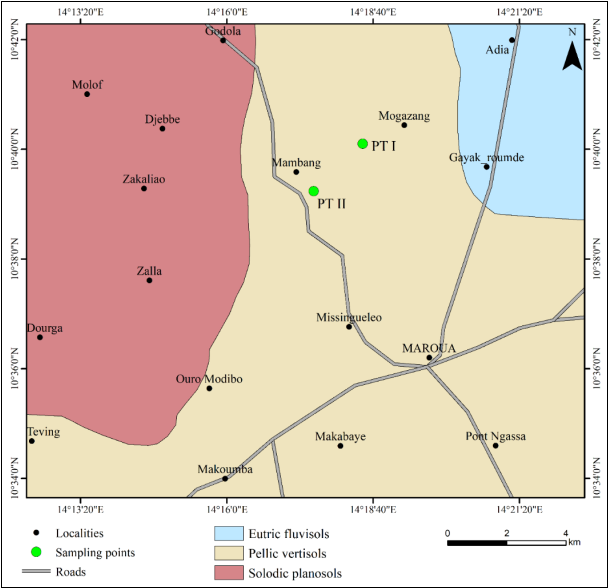
Two types of soil characterize this area: Pellic Vertisols and Eutric Regosols
| [8] | FAO (Food and Agriculture Organization of the United Nation). Soil Atlas of Africa. Rome; 2013, Edition 5th. |
[8]
(
Figure 2). The Pellic Vertisols are dark colored argillic soils located within the plain landform around elevations of 400 m a.s.l. It is occupied by several types of tree species, among them, young and mature
Faidherbia albida, which are interspersed in the whole farmlands. Soil surface is covered with cotton, millet and sorghum crops residues, isolated rock fragments of approximately 10% and some other part of farmland appear bare. The soil under mature
F. A. tree species is fully covered with green grasses. The same crop residues can also be observed outside
F. A. with traces of cows, goat and sheep manures. The Eutric Regosols are weakly developed soils, in unconsolidated material and not acidic. They covered the hilly landform, with elevations ranging between 600 and 800 m a.s.l. Along the hilly slope of this area, stone lines/walls have been built and separated from each other at approximately 0.5 meter distance. These stone lines are associated with some
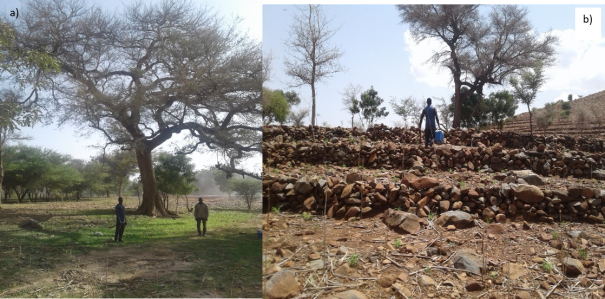
Faidherbia albida trees. The soil surface is completely and mainly covered with rock fragments ranging from millimeter to decimeter in size, crop residues, sheep and goat manure (
Figure 3).
Figure 3. a) Pellic Vertisols within plain landform associated with Faidherbia albida and b) Eutric Regosols developed on hill landform where Faidherbia albida is combined with stone lines/walls. Photos taken in the beginning of the cropping season.
Vegetation is characterized by Sahelian species such as
Acacia seyel,
Acacia nilotica, Khaya senegalensis,
Vitellaria paradoxa,
Adansonia digitate,
Parkia biglobosa,
Leucaena Spp,
Combretum Spp and
Faidherbia albida | [13] | Tagne, T. B. A., Tchatchoua, D., T., Caspa, R., G., Scott, P., John, E. C., Tetyana, Z. Adaptation of Sub Saharan African Faidherbia albida (Del.) A. Chev. Provenances in the Sudano–Sahelian climatic condition of Cameroon. Journal of Animal and Plant Sciences 49(3): 2021. 8903-8919.
https://doi.org/10.35759/JAnmPlSci.v49-3.3 |
[13]
. The region has a Soudano-sahelian climate characterized by a long dry season lasting from October to May and a short rainy season from June to September. The mean annual rainfall over the last decade in the region is 759.88 mm and more than 55% of annual rainfall per year is distributed in the month of July and August. The region has a mean annual temperature of 28.64°C associated with an important evapotranspiration rate. Soil nutrient deficiency is a limiting factor in assessing the productivity of both soil types. Meanwhile, agriculture is the main subsistence source for the local populations. Cereals are their source of staple food. Cotton remains the single most important cash crop
| [6] | Ayongwa, G. C., Stomph, T. J., Hoevers, R., Ngoumou, T. N., Kuyper, T. W., Striga infestation in northern Cameroon: Magnitude dynamics and implications for management. NJAS – Wageningen Journal of live Sciences. 2010. 57. 159–165. https://doi.org/10.1016/j.njas.2010.04.003 |
[6]
. The dominant staple food crops cultivated here include sorghum, maize, and pearl millet. The majority of farmers here implement soil restoration practices with the support of the government, through the Cotton Development Corporation, the Ministry of forestry and wildlife, the Ministry of the Environment and World Resources Institute (WRI). They reforest steep areas, build stone embankments to control soil erosion and rehabilitate soil fertility. These soils were developed from amphibolite (
Figure 1).
2.2. Studied Species
The present study focuses on
Faidherbia albida (Delile) A. Chev. (syn. Acacia Albida). This species is naturally widespread in the drier areas worldwide (Palestine, Sudan, Ethiopia,…etc.). In Cameroon, it spreads from the North to the Far North.
F.A. is important because of its unique attribute to produce leaves and fruits in the dry season, when other trees are leafless and dormant during the cropping season
| [11] | Rhoades, C. Seasonal pattern of nitrogen mineralization and soil moisture beneath Faidherbia albida (Syn Acacia al bida) in Central Malawi. Agroforestry systems 29: 1995. 133–145. https://doi.org/10.1007/BF00704882 |
| [14] | Chamshama, S. A. O., Maliondo, S. M. S., and Mackengo, S. J. Early performance of faidherbia albida intercropped with maize at gairo. morogoro. Tanzania. Journal of Tropical Forest Science 7(2). 1994. 220-229. https://jtfs.frim.gov.my/jtfs/article/view/1830 |
| [15] | Payne, W. A., Williams, J. H., Maï, K. A., Moussa, and Stern, R. D. Crop ecology production and management crop diversification in the sahel through use of environmental changes near faidherbia albida (del.) a. chev. Crop Sci. 38. 1998. 1585-1591. https://doi.org/10.2135/cropsci1998.0011183X003800060029x |
| [16] | Sileshi, G. W. The magnitude and spatial extent of influence of Faidherbia albida trees on soil properties and primary productivity in drylands. Journal of Arid Environments 132. 2016. 1–14. https://doi.org/10.1016/j.jaridenv.2016.03.002 |
| [17] | Tchatchoua, T. D., Scott, R. P., Erin, D. T., Casey, W., Krystle, S., Iain, M., Zembower, N., Tetyana, Z., and Carlson, J. E. Genetic diversity of Faidherbia albida populations in the Sudano Sahelian region of Cameroon using simple sequence repeat (SSR) markers. African Journal of Biotechnology 19(7). 2020. 415-425. https://doi.org/10.5897/AJB2020.17150 |
| [18] | Akpalu, S. E., Kwasi, D. E., and Akwasi, A. A. Effects of Faidherbia albida on some important soil fertility indicators on agroforestry parklands in the semi-arid zone of Ghana. Afr. J. Agric. Res. 15(2). 2020. 256-268.
https://doi.org/10.5897/AJAR2019.14617 |
| [19] | Akodéwou, A., Palou, M., Faustin, A. T., Romain, R., and Régis, P. Three decades of Faidherbia albida agroforestry in Far North Region. Cameroon. Torquebiau E (ed.). Agroforestry at work. Tropical Forest Issues 62. Tropenbos International. Ede. the Netherlands 2024. 117–122.
https://doi.org/10.55515/BTBP7343 |
[11, 14-19]
. Therefore, it is considerably less competitive with crops for water, light and nutrient elements, making it compatible with crops and acceptable to farmers
| [14] | Chamshama, S. A. O., Maliondo, S. M. S., and Mackengo, S. J. Early performance of faidherbia albida intercropped with maize at gairo. morogoro. Tanzania. Journal of Tropical Forest Science 7(2). 1994. 220-229. https://jtfs.frim.gov.my/jtfs/article/view/1830 |
| [15] | Payne, W. A., Williams, J. H., Maï, K. A., Moussa, and Stern, R. D. Crop ecology production and management crop diversification in the sahel through use of environmental changes near faidherbia albida (del.) a. chev. Crop Sci. 38. 1998. 1585-1591. https://doi.org/10.2135/cropsci1998.0011183X003800060029x |
| [18] | Akpalu, S. E., Kwasi, D. E., and Akwasi, A. A. Effects of Faidherbia albida on some important soil fertility indicators on agroforestry parklands in the semi-arid zone of Ghana. Afr. J. Agric. Res. 15(2). 2020. 256-268.
https://doi.org/10.5897/AJAR2019.14617 |
| [20] | Roupsard, o., Ferhi., Granier., Pallo, f., Depommier., Mallet., Joly, H. I., and Dreyer, E. Reverse phenology and dry-season water uptake by Faidherbia albida(Del.) A. Chev in an agroforestry parkland of Sudanese west Africa. Functional Ecology 13. 1999. 460–472. https://doi.org/10.1046/j.1365-2435.1999.00345.x |
[14, 15, 18, 20]
. Its presence on farmland significantly reduces
Striga infestations, which are usually associated with soil fertility decline
| [6] | Ayongwa, G. C., Stomph, T. J., Hoevers, R., Ngoumou, T. N., Kuyper, T. W., Striga infestation in northern Cameroon: Magnitude dynamics and implications for management. NJAS – Wageningen Journal of live Sciences. 2010. 57. 159–165. https://doi.org/10.1016/j.njas.2010.04.003 |
[6]
. It provides shelter for animals, whose dung is used as fertilizer for crops. It also acts as a windbreak, supplies wood for fuel and construction, and reduces erosion by preventing soil compaction, which facilitates water infiltration during the rainy season
| [15] | Payne, W. A., Williams, J. H., Maï, K. A., Moussa, and Stern, R. D. Crop ecology production and management crop diversification in the sahel through use of environmental changes near faidherbia albida (del.) a. chev. Crop Sci. 38. 1998. 1585-1591. https://doi.org/10.2135/cropsci1998.0011183X003800060029x |
| [17] | Tchatchoua, T. D., Scott, R. P., Erin, D. T., Casey, W., Krystle, S., Iain, M., Zembower, N., Tetyana, Z., and Carlson, J. E. Genetic diversity of Faidherbia albida populations in the Sudano Sahelian region of Cameroon using simple sequence repeat (SSR) markers. African Journal of Biotechnology 19(7). 2020. 415-425. https://doi.org/10.5897/AJB2020.17150 |
[15, 17]
. Its presence in the crop fields on inherently nutrient poor sites has been widely reported to increase soil fertility and crop yields
| [19] | Akodéwou, A., Palou, M., Faustin, A. T., Romain, R., and Régis, P. Three decades of Faidherbia albida agroforestry in Far North Region. Cameroon. Torquebiau E (ed.). Agroforestry at work. Tropical Forest Issues 62. Tropenbos International. Ede. the Netherlands 2024. 117–122.
https://doi.org/10.55515/BTBP7343 |
[19]
, a phenomenon termed the “
albida effect”
| [16] | Sileshi, G. W. The magnitude and spatial extent of influence of Faidherbia albida trees on soil properties and primary productivity in drylands. Journal of Arid Environments 132. 2016. 1–14. https://doi.org/10.1016/j.jaridenv.2016.03.002 |
| [18] | Akpalu, S. E., Kwasi, D. E., and Akwasi, A. A. Effects of Faidherbia albida on some important soil fertility indicators on agroforestry parklands in the semi-arid zone of Ghana. Afr. J. Agric. Res. 15(2). 2020. 256-268.
https://doi.org/10.5897/AJAR2019.14617 |
[16, 18]
.
2.3. Field Survey and Sampling
The study area was covered with Pellic Vertisols and Eutric Regosols. They were respectively located on the plain and on the hills slopes (
Figure 3). The choice of sampling points was based on the presence
Faidherbia albida tree, associated or not with some traditional practices, and differences in soil type. Soil morphological properties such as humidity and temperature were measured
in situ. The Pellic Vertisol is located at an altitude of 400 m a.s.l. In the hierarchy of major landforms, it corresponds to a plain area with a gradient less than 10%, relief intensity less than 50 m km
-1 and potential drainage density varying between 0 – 25
| [21] | FAO (Food and Agriculture organization of the United Nation). Guidelines for soil description. Fourth edition. Rome. 2006. 97p. |
[21]
.
F. A. mainly covers this area. The second soil type is an Eutric Regosol, located between 600 to 800 m a.s.l. This part of the area, according to slope positions is undulating and mountainous terrain corresponding to the lower slope or foot slope with gradient around 15 – 30%, relief intensity varying between 150 – 300 m Km
-1 and potential drainage density between 0 and 15
| [21] | FAO (Food and Agriculture organization of the United Nation). Guidelines for soil description. Fourth edition. Rome. 2006. 97p. |
[21]
. In this part of the area, stone walls were built according to the direction of the steepest slope. These stones walls were associated with
F.A. species (
Figure 3). Both lands are subjected to continuous agricultural practices for crops such as cotton, pearl millet, sorghum, and maize. Eighteen (18) disturbed composite soil samples were collected from three points relative to the distance from the
F.albida tree trunk. Six (06) at the foot of tree trunk, six (06) 2 m away from the foot of tree trunk under the canopy, and six (06) 4 m away from the foot of tree trunk, outside of the canopy, considered as control. These soil samples were collected at the beginning of the rainy season, shortly before cropping. At each sampling pit, composite soil samples were collected from top to bottom at three different depths: 0 – 5 cm, 5 – 10 cm and 10-20 cm. The selection of
Faidherbia albida species was based on age, diameter of trunk at breast height, similarity of canopy cover and height. The mature trees were believed to be 40 to 50 years old
| [22] | Kamara, C. S., and Haque, I. Faidheria albida and its effects on Ethiopian highland Vertisols. Agroforestry systems 18. 1992. 17–29. https://doi.org/10.1007/BF00114814 |
[22]
. Interviews with local farmers and field observations allowed us to select the mature species of
F.A. The mean tree height for both sites was 17 m, with a diameter at breast height (1,5 m) equal to 0,50 m.
2.4. Analytical Procedure
Small pits of approximately 30 cm of depth were opened with an appropriate knife. The analysis of soil data focused on this depth because over 75% of soil organic carbon (SOC) and plant roots in the drylands are known to be concentrated at this depth
| [16] | Sileshi, G. W. The magnitude and spatial extent of influence of Faidherbia albida trees on soil properties and primary productivity in drylands. Journal of Arid Environments 132. 2016. 1–14. https://doi.org/10.1016/j.jaridenv.2016.03.002 |
[16]
. Composite soil samples from each pit were taken under and outside the tree canopy after removing the litter in the soil surface, at three distances (at the foot of the tree trunk, 2m and 4m away from the
F. albida trunk). These soil samples were stored in sealed plastic bags and transported in the laboratory where they were air-dried, before being grind and sieved; then used for routine laboratory analysis. Soil humidity content and temperature were determined
in situ using frequency domain reflectometry probes (FDR probes). Physico chemical determinations were done for the following parameters: pH in water ratio of 1: 2.5 (pHw), exchangeable bases (Ca, Mg, K, Na) and available P were extracted by the Mehlich-3 procedure
. Cations were determined by atomic absorption spectrophotometry and available P by spectrocolorimetry using Olsen procedure
| [24] | Olsen, S. R., Cole, C. V., and Watanabe, F. S. Estimation of Available Phosphorus in Soils by Extraction with Sodium Bicarbonate. 1954. USDA Circular No. 939, US Government Printing Office, Washington DC. |
[24]
. Total N using the Kjeldahl method for digestion and ammonium electrode determination
, organic carbon (OC) using chromic acid digestion and spectrophotometric analysis
| [26] | Heanes, D. L. Determination of total C in soils by an improved chromic Acid digestion and spectrometric procedure. Commun. Soil Sci. Plant Anal. 15. 1984. 1191–1213.
https://doi.org/10.1080/00103628409367551 |
[26]
. Organic matter (OM) was obtained using conversion factor for surface horizons of 1.724 for soils under anthropogenic land cover types
| [27] | Nelson, D. W., Sommers, L. E. A simple digestion procedure for estimation of ammonium in Kjeldahl soils. J. Environ. Qual. 1. 1972. 423–425. |
[27]
. The effect of trees on each variable was estimated through the response ratio (RR) value. This value has been chosen as the most appropriate effect size. RR was calculated as the ratio of measurements under the canopy (U) to the open area considered as the control (C). Thus RR (= U/C) is a dimensionless and unit-less quantity. It has the advantage to combine data collected through different analytical methods or at different times more straightforwardly than other metrics. This value helps to assess any difference between the canopy and open area for a given variable. When there is no significant difference between the canopy and open area for a given variable, RR will encompass 1. When RR is greater than 1 it means significant increases under the canopy
| [16] | Sileshi, G. W. The magnitude and spatial extent of influence of Faidherbia albida trees on soil properties and primary productivity in drylands. Journal of Arid Environments 132. 2016. 1–14. https://doi.org/10.1016/j.jaridenv.2016.03.002 |
[16]
.
2.5. Computation of Soil Quality Index (SQI)
Calculating soil quality consists of combining the physicochemical and biological properties of the soil that change in response to variations in soil conditions
| [28] | Nguemezi, C., Tematio, P., Yemefack, M., Tsozue, D., Silatsa, T. B. F. Soil quality and soil fertility status in major soil groups at the Tombel area. South- West Cameroon. Heliyon 6. 2020. e03432. https://doi.org/10.1016/j.heliyon.2020.e0343 |
[28]
. The steps to calculate the SQI were described by
| [29] | Ngo-Mbogba, M., Yemefack, M., Nyeck, B. Assessing soil quality under different land cover types within shifting agriculture in South Cameroon. Soil and Tillage Res 150. 2015. 124–131. https://doi.org/10.1016/j.still.2015.01.007 |
[29]
. This dataset focused more on soil chemical parameters because some authors
| [29] | Ngo-Mbogba, M., Yemefack, M., Nyeck, B. Assessing soil quality under different land cover types within shifting agriculture in South Cameroon. Soil and Tillage Res 150. 2015. 124–131. https://doi.org/10.1016/j.still.2015.01.007 |
| [30] | Yemefack, M., Jetten, V. G., Rossiter, D. G. Developing a minimum data set for characterizing soil dynamics in shifting cultivation systems. Soil Till. Res. 86. 2006. 84–98.
https://doi.org/10.1016/j.still.2005.02.017 |
[29, 30]
reported their strong influence and manifestation on crop growth. Each indicator was normalized by
| [29] | Ngo-Mbogba, M., Yemefack, M., Nyeck, B. Assessing soil quality under different land cover types within shifting agriculture in South Cameroon. Soil and Tillage Res 150. 2015. 124–131. https://doi.org/10.1016/j.still.2015.01.007 |
[29]
, and the SQI parameter was calculated by using equation (
1)
| [29] | Ngo-Mbogba, M., Yemefack, M., Nyeck, B. Assessing soil quality under different land cover types within shifting agriculture in South Cameroon. Soil and Tillage Res 150. 2015. 124–131. https://doi.org/10.1016/j.still.2015.01.007 |
[29]
.
W is the normalized indicator; X is the indicator score; SQI is the soil quality index; i is a soil property and n is the number of soil properties.
A high soil quality index indicates better soil quality
| [31] | Andrews, S. S., Karlen, D. L., Mitchell, J. P. A comparison of soil quality Indexing methods for vegetable production systems in Northern California. Agric. Ecosyst. Environ. 90. 2002a. 25–45. |
| [32] | Andrews, S. S., Mitchell, J. P., Mancinelli, R., Karlen, D. L., Hartz, T. K., Horwath, W. R., Pettygrove, S. G., Kate, M. S., Munk, S. D. On-farm assessment of soil quality in California’s Central Valley. Agron. J. 94. 2002b. 12–23.
https://doi.org/10.2134/agronj2002.0012 |
| [33] | Andrews, S. S., Flora, C. B., Mitchell, J. P., Karlen, D. L. Growers’ perceptions and acceptance of soil quality indices. Geoderma 114. 2003. 187–213. https://doi.org/10.1016/S0016-7061(03)00041-7 |
[31-33]
.
2.6. Statistical Analysis
The eleven (11) soil variables (SOM, Total N, available P, pHw, Ca, Mg, K, Na, SQI, soil humidity and temperature) were subjected to descriptive statistical analysis using summary statistics. The proportional deviation (pd) from soils not influenced by
Faidheria albida (
F. A.) considered as control, for Pellic Vertisols and Eutric Regosol was used to assess the effect
F.A. alone and combined with stone walls according to equation (
2)
Pd%: proportional deviation in percent (%);
X: a soil property;
P’’: a soil property not influenced by F. A., consider as control.
Linear regression analysis was performed to assess relationships between management practices (F. albida combined or not with stone walls) and soil physicochemical properties in both soils. These analyses were performed using XLSTAT, Excel version 2023.
3. Results
3.1. Inputs from F.A. on Pellic Vertisol
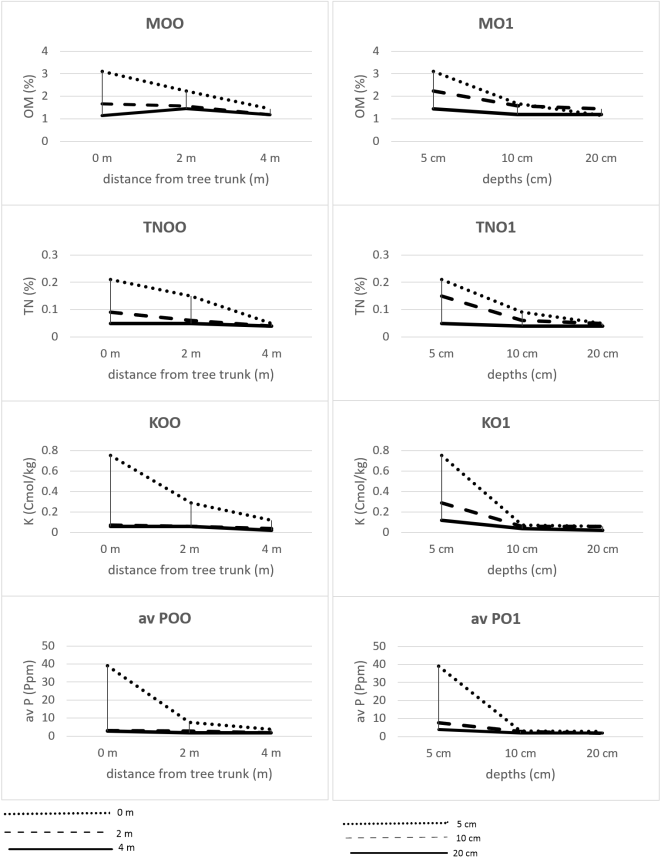
There were distinct vertical and lateral differences in several physico-chemical and physical properties, which are organic matter (OM), total N (TN), available phosphorus (P), potassium (K), humidity and temperature levels under and outside the
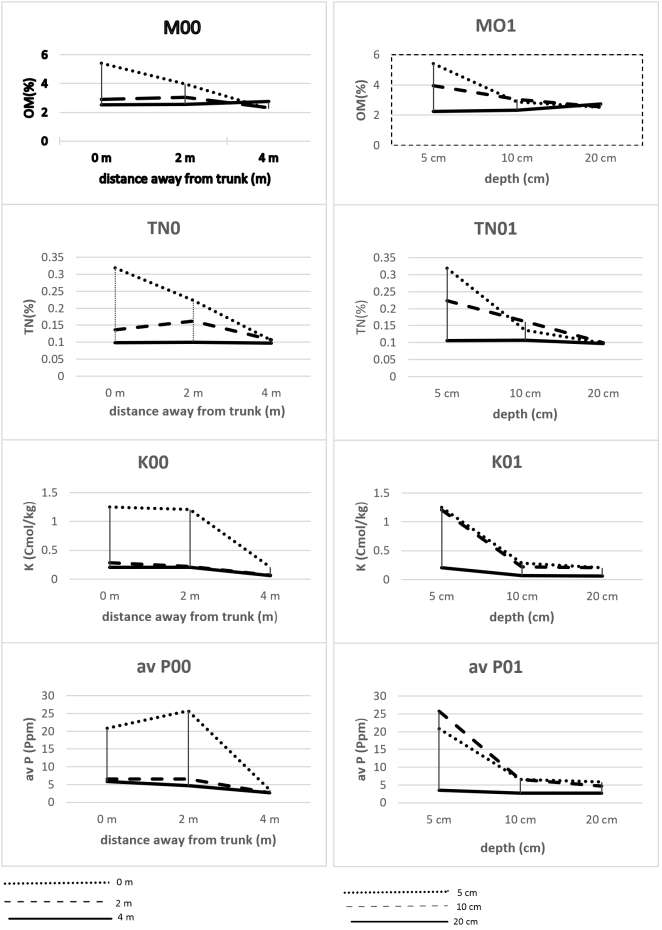
Faidherbia albida tree. Linear regression analysis was employed to study the relationship between OM, total N, P, K levels and distances away from the tree on one hand and between OM, total N, P and K levels according to the depth on the other hand (
Figure 4).
Table 1. Mean values of organic matter, total N, available phosphorus, and potassium at different distances from the tree trunk and soil depths (mean ± standard error; n = 9 samples).
Distances away from tree trunk(m) | Depths (cm) | OM (%) | Total N (%) | P (ppm) | K (Cmol/kg) |
0 | 0 - 5 | 3.094 ±0.47 | 0.21 ±0.04 | 38.92 ±9.80 | 0.75 ±0.18 |
| 5 - 10 | 1.670 ± 0.47 | 0.09 ±0.04 | 3.08 ±0.00 | 0.07 ±0.00 |
| 10 - 20 | 1.151 ±0.47 | 0.05 ±0.04 | 2.69 ±0.00 | 0.06 ±0.00 |
2 | 0 - 5 | 2.24 ±0.20 | 0.15 ±0.02 | 7.74 ±1.48 | 0.29 ±0.06 |
| 5 - 10 | 1.572 ±0.20 | 0.06 ±0.02 | 2.69 ±1.48 | 0.06 ±0.00 |
| 10 - 20 | 1.443 ±0.20 | 0.05 ±0.02 | 1.92 ±1.48 | 0.06 ±0.00 |
4 | 0 - 5 | 1.449 ±0.07 | 0.05 ±0.003 | 3.86 ±0.53 | 0.12 ±0.02 |
| 5 - 10 | 1.187 ±0.07 | 0.04 ±0.003 | 1.92 ±0.53 | 0.04 ±0.02 |
| 10 - 20 | 1.182 ±0.07 | 0.04 ±0.003 | 1.92 ±0.53 | 0.02 ±0.00 |
OM: organic matter; Total N: total nitrogen; P: available phosphorus; K: potassium.
3.1.1. Organic Matter
Soil organic matter (SOM) has an important influence on soil physical, chemical and biological characteristics. It determines soil physical properties by improving bulk density, porosity and infiltration rate. Significant differences in OM were observed at the three distances from the tree trunk (tree trunk, 2 m from tree trunk and 4 m from tree trunk; outside the
F. albida influence area) and according to soil depth (
Table 1;
Figure 4). Organic matter showed a rapid decreasing trend with increasing distance from the base of the tree toward the open field and sharply decreased with depth. It was significantly higher under the tree canopy than outside. It was moderate, from 2.24 to 3.09% at 2 m (R
2 = 0.72; β = - 15.1) and at the tree trunk (R
2 = 0.81; β = - 6.83), than in the open field, where it remains low (1.45%). According to depth, the range of OM varied between 1.15 and 3.09% corresponding to 10 -20 cm (R
2 = 0.89; β = -7.41) and to 0-5 cm depths (R
2 = 0.99; β = -2.43) at the tree trunk. The same trend was observed 2m away from the tree trunk and outside, recording respectively 2.24%, 1.572%, 1.443% and 1.449%, 1.187%, 1.182% (0 – 5 cm; 5 – 10 cm and 10- 20 cm) (
Table 1).
3.1.2. Total Nitrogen (TN)
Significant horizontal and vertical variations were observed under F. albida tree compared to outside. Total nitrogen decreased with increasing distance from the tree trunk and soil depth. It significantly varied according to the distance from the tree trunk and soil depth. It was moderate (0.21%) at tree trunk (R2= 0.79; β= - 81.7), low (0.15%) 2 m away from trunk (R2 = 0.66; β= -112.6) and very low (0.05%) 4 m from the tree trunk in the open area. According to depths (0-5. 5 – 10 and 10 – 20 cm), it was low to moderate, varying respectively as follows 0.21%, 0.09% and 0.05% at the tree trunk; 0.15%, 0.06% and 0.05% 2 m away from the tree as compared to open area, where it was 0.05% and, from 5 – 10 cm remained constant (0.04%). Thus, Total nitrogen was higher under the tree canopy than outside the canopy.
3.1.3. Available Phosphorus (P)
Available phosphorus was significantly higher under the tree canopy than in the open field. It showed a decreasing trend with increasing distance from the tree base towards the open field. It ranged from 7.74 PPm 2 m at the tree trunk (R
2 = 0.69; β= -2.01) to 38.92 PPm at tree trunk (R
2 = 0.58; β= -0.28) under F. albida as compared to 3.86 PPm outside the canopy. According to the three depths (0 – 5; 5 -10 and 10 – 20 cm), it sharply decreased from 38.92 (R
2 = 0.83; β= -0.09) to 3.08 (R
2 =0.96; β= - 3.33) and 2.69 PPm at the tree base to 7.74, 2.69 and 1.92 PPm 2 m away from the trunk under the canopy. Outside the canopy, it decreased from 3.86 to 1.92 PPm from 5-10 cm and remained constant up to 20 cm (
Table 1,
Figure 4). These variations were similar to organic matter and total nitrogen.
3.1.4. Potassium (K)
The K values showed significant variations with distance from the tree trunk and soil depths. The amount of K in the soil significantly decreased as the distance from the tree trunk increased. It rapidly decreased from 0.75 Cmol/kg at the tree trunk (R
2 = 0.58; β = - 14.75), to 0.29 Cmol/kg 2 m away (R
2= 0.57: β = -43.47) under
F. albida tree and finally to 0.12 Cmol/kg outside the canopy (
Table 1,
Figure 4). According to depth, the highest K values were recorded at 0 – 5 cm depth (0.29 - 0.75 Cmol/kg; R
2 = 0.93; β = -5.93) and decreased at 5 – 10 cm depth (0.06 - 0.07 Cmol/kg; R
2 = 0.96; β = -128.5), where it remained almost constant up to (10 – 20 cm) under the canopy. Outside the canopy, it decreased from 0.12 Cmol/kg (0-5 cm) to 0.04 Cmol/kg (5 -10 cm) and 0.02 Cmol/kg (10 -20 cm).
The content of these macronutrients varied at the three soil depths and horizontal positions (closest, middle and distant), decreasing from the top to lower soil depths and from the closest to the distant positions under F. albida.
Table 2. Influence of F. A. tree on Pellic Vertisol properties under the canopy relative to the open area.
Soil variables | Effect size (RR) Mean (95% CI) |
pHw | 0.88 (0.81 – 0.95)NS |
OM | 1.55 (0.97 – 2.13)* |
Ca | 0.71(0.63 – 0.80)NS |
Mg | 1.00 (0.91 – 1.10)NS |
K | 3.86 (1.59 – 6.13)* |
Na | 1.08 (0.42 – 1.74)NS |
Total N | 2.61(1.18 – 4.04)* |
P (olsen) | 5.54 (1.00 – 10.08)* |
Humidity | 1.10 (0.95 – 1.26)NS |
Temperature | 0.80 (0.80 -0.82)NS |
NS: indicate non significant; *indicate significant increases under canopy compared to open area. Responses under canopy are not significantly different from the open area if the 95% CI of RR encompass 1. Figures in parenthesis are 95% confidence limits.
Consistent increases in OM, total N, available P and K (RR ˃ 1) due to
Faidherbia albida tree are confirmed in
Table 2. The amounts of OM, TN, P, and K contributed by Faidherbia tree in these soils under the canopy were respectively 46.24%, 128.23%, 270.85% and 254.29% higher than in the open area.
Figure 4. Relationship between Organic matter (OM), Total nitrogen (TN), available Phosphorus (av P), potassium (K) and distance (m) away from the Faidherbia albida tree and soil depth (cm) on a Pellic Vertisol. M00: OM at tree trunk; MO1: OM as a function of depths; TNO: TN at tree trunk; TNO1: TN as a function of depths; KOO: potassium at tree trunk; KO1: potassium as a function of depths; av POO: available phosphorus at tree trunk and av PO1 available phosphorus as function of depths.
3.1.5. pHw and Some Exchangeable Cations
The pHw of the study area ranged between 5.84 to 6.45 at the tree trunk and 2 m away from the tree trunk under the tree canopy to 6.76 outside, in top soil (0 – 5 cm). Thus, this parameter increases with increasing distance away from the tree base. A similar trend was observed as soil depth increased under and outside the tree canopy. At the tree base, for the three depths (0-5; 5-10 and 10 – 20 cm), values corresponded to 5.84, 5.82 and 6.02. 2 m away from the trunk, values were 6.45, 6.32 and 6.38. Outside the tree canopy, values were 6.76, 7.15 and 7.28.
The same trend was recorded for exchangeable Ca, which gradually increased as the distance from the tree trunk increased. The mean values of exchangeable Ca (8.61 Cmol/kg) were lower at the tree trunk, slightly increased 2 m away from the tree trunk (8.96 Cmol/kg) under the tree canopy and significantly increased outside the canopy (11.17 Cmol/kg).
According to soil depths, the trend were similar under and outside the canopy. The concentration of exchangeable Ca increased as soil depth increased. Values recorded at tree trunk were 8.61 Cmol/kg (0 – 5 cm), followed by 12.23 Cmol/kg (5 – 10 cm) and 11.81 Cmol/kg at (10 -20 cm). At 2 m from the tree base, values were about 8.96 Cmol/kg, followed by 12.66 Cmol/kg and 12.73 Cmol/kg, respectively at 0- 5 cm, 5 – 10 cm, and 10 -20 cm. In the open field, for the three depths (0 – 5; 5 – 10; 10 -20 cm), values correspond to 11.17 Cmol/kg, 18.50 Cmol/kg and 18.64 Cmol/kg respectively (
Table 3).
Table 3. Lateral and vertical variations of pHw and some exchangeable cations contents under and outside de Faidherbia albida tree on Pellic Vertisol (mean ±standard error, n = 9 samples).
Distances away from tree trunk (m) | Depths (cm) | pHw | Ca (Cmol/kg) | Mg (Cmol/kg) |
0 | 0 - 5 | 5.84±0.05 | 8.61±0.93 | 3.77±0.37 |
| 5 - 10 | 5.82±0.05 | 12.23±0.93 | 5.33±0.37 |
| 10 - 20 | 6.03±0.05 | 11.81±0.93 | 4.52±0.37 |
2 | 0 - 5 | 6.45±0.03 | 8.96±1.01 | 3.87±0.26 |
| 5 - 10 | 6.32±0.03 | 12.66±1.01 | 4.96±0.26 |
| 10 - 20 | 6.38±0.03 | 12.73±1.01 | 4.39±0.26 |
4 | 0 - 5 | 6.76±0.13 | 11.17±2.01 | 3.92±0.22 |
| 5 - 10 | 7.15±0.13 | 18.50±2.01 | 4.84±0.22 |
| 10 -20 | 7.28±0.13 | 18.64±2.01 | 4.27±0.22 |
pHw: pH in water; Ca: amount of calcium; Mg: amount of magnesium
3.1.6. Temperature and Humidity
Soil temperature and humidity are related. They play a major role in ensuring crop productivity, sustainability and control of biological and biochemical processes which invariably affects soil organic matter formation, seed germination, plant development, ability of plants to survive during dry season and nutrients uptake
| [34] | Alli, A. A., and Omofunmi, O. E. A review of soil temperature under a controlled irrigation system. Journal of Research in Forestry, Wildlife and Environment 13(1) 2021. 10 p. |
[34]
. The analysis of temperature and humidity revealed they were affected by distance from the tree trunk and soil depth (
Table 4).
Table 4. Average temperature (°C) and humidity (%) measurements at the time of sampling under and outside the Faidherbia albida tree on a Pellic Vertisol at 5, 10 and 20 cm depths (n = 9 samples).
Distance from tree (m) | Depth (cm) | Temperature (°C) | Humidity (%) |
Std. Dev. | | 4.09 | 5.33 |
CV | | 0.11 | 0.31 |
0 | 0-5 | 31.1±1.05 | 12.30±1.88 |
| 5-10 | 35.5±1.05 | 19.70±1.88 |
| 10-20 | 34.0±1.05 | 18.60±1.88 |
2 | 0-5 | 35.7±0.55 | 10.10±3.56 |
| 5-10 | 34.8±0.55 | 22.10±3.56 |
| 10 - 20 | 33.4±0.55 | 24.10±3.56 |
4 | 0-5 | 43.80±0.63 | 9.60±2.82 |
| 5 -10 | 43.10±0.63 | 20.70±2.82 |
| 10-20 | 41.20±0.63 | 19.10±2.82 |
Std.Dev. standard deviation; CV: coefficient of variation.
The values of temperature increased with increasing distance from the tree trunk. It was cooler under the canopy of Faidherbia tree than outside and generally showed a decreasing trend with increasing depth. A temperature of 31.1°C was recorded at the tree trunk, followed by 35.7°C 2 m away from the base and 43.8°C outside in the open field within the top soils (0 – 5 cm). With regard to depth, it was about 35.5°C and 34°C at 5-10 cm and 10 – 20 cm at tree trunk, followed by 35.7°C, 34.8°C and 33.4°C for 0 – 5; 5- 10 and 10 -20 cm 2 m away from the base of the trunk.
In contrast to soil temperature, soil humidity decreased as the distance from the tree trunk increased in the top soil. There was higher humidity under the Faidherbia canopy than outside in the open field (
Table 4). The highest value was recorded at the tree trunk (12.30%), followed by 10.10% at 2 m away from the base of the tree trunk, and the lowest (9.60%) outside the canopy within the top soils. Considering soil depth, humidity increased with depth. At the tree trunk, values were 12.30%, 19.70% and 18.60%; at 2 m away from the trunk, 10.10%, 22.10% and 24.10% and outside 9.60%, 20.70% and 19.10% for 0 – 5 cm, 5 – 10 cm, and 10 – 20 cm respectively.
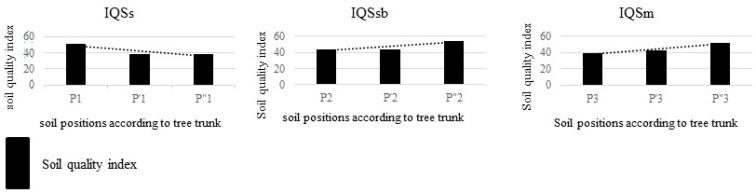
3.1.7. Assessment of Soil Quality on a Pellic Vertisol
soil quality refers to the capacity of a specific soil to function, within natural or managed ecosystem boundaries, to sustain plant and animal productivity, to maintain or enhance water and air quality, and to support human health and habitation
| [29] | Ngo-Mbogba, M., Yemefack, M., Nyeck, B. Assessing soil quality under different land cover types within shifting agriculture in South Cameroon. Soil and Tillage Res 150. 2015. 124–131. https://doi.org/10.1016/j.still.2015.01.007 |
[29]
. According to
Figure 5, three trends SQIs = IQSs = soil quality index for 0 – 5 cm layer; SQIsb = IQSsb = soil quality index for 5 – 10 cm layer; and SQIm = IQSm = soil quality index for 10 – 20 cm layer in assessment the inputs from
Faidherbia albida are observed.
Figure 5. Assessment the inputs from Faidherbia albida tree following depth and distance from tree trunk on a Pellic Vertisol quality.
P1: soil at tree trunk, P’1: soil 2 m away from tree trunk, P”1: soil at 4 m away from tree trunk, at surface soil; P2: soil at tree trunk, P’2: soil 2 m away from trunk, P’’2: soil outside the trunk at subsurface; P3: soil at tree trunk, P’3: soil 2 m away the trunk, P’’3: soil outside the tree in the subsurface soil. IQSs: soil quality index for surface soil (0 – 5 cm), IQSsb: soil quality index for subsurface soil (5 – 10 cm), IQSm: soil quality index for mineral soil (10 – 20 cm).
Considering soils in the open field (P’’1. P’’2 and P’’3), as references outside the tree canopy influence, the soil quality index (SQI) or IQSs) in top soil (0 – 5 cm) regularly decreased as distance from tree trunk increased. It corresponded to 50.77 at the tree trunk, follow by 38.54 at 2m away and 38.11 outside the canopy. In SQIsb) and SQIm) subsoils (5 –10 cm and 10 – 20 cm), SQI increased as distance from the tree trunk increased. SQI values were 44.07 at the tree trunk, 44.11 at 2m away, and 54.20 outside the tree canopy. In average, for 10 -20 cm, values were 39.26 at the tree trunk, 42.86 at 2 m away, and 52.09 outside the canopy. SQI1_1uF.A under F.A in surface soil (0 – 5 cm) is higher than SQI1_1OF.A. outside F.A. tree (SQI1_1uF.A. ˃ SQI1_1’OF.A). (SQI1_1uF.A. = 44.65; SQI1_1’OF.A. = 38.11) on a Pellic Vertisol within superficial layers (0 – 5 cm). While on subsurface layers (5 -10 and 10 – 20 cm), SQI1_2uF.A ˂ SQI1_2’OF.A. (SQI1_2uF.A. = 44.09; SQI1_2oF.A.= 54.20) and SQI1_3uF.A. ˂ SQI1_3’oF.A. (SQI1_3uF.A. = 41.06; SQI1_3’oF.A. = 52.09). F.A. tree has influence only on the superficial layer. It improves Pellic Vertisol quality under its cover within top soils (0 – 5 cm).
3.2. Inputs from F.A. and Stone Walls on an Eutric Regosol
As in the case of Pellic Vertisol, there were distinct vertical and lateral differences in several physico-chemical and physical properties: organic matter (OM), total nitrogen (TN), available phosphorus (P), potassium (K), temperature and humidity levels under and outside
Faidherbia albida tree. Associated with stone walls along the slopes, relationships between the same physico – chemical and physical properties, distances away from the tree trunk, and soil depth were also highlighted (
Figure 6).
Table 5. Mean values of organic matter (OM), total nitrogen (TN), available phosphorus (P) and potassium (K) at different distances from tree trunk and soil depths (mean ± standard error; n = 9 samples).
Distances (m) Away from trunk | Depths (cm) | OM (%) | Total N (%) | Available P (ppm) | K (Cmol/kg) |
0 | 0 - 5 | 5.41 ±0.74 | 0.32 ±0.05 | 20.8 ±3.98 | 1.25 ±0.27 |
| 5 - 10 | 2.89 ± 0.74 | 0.14 ±0.05 | 6.57 ±3.98 | 0.28 ±0.27 |
| 10 - 20 | 2.51 ±0.74 | 0.10 ±0.05 | 5.80 ±3.98 | 0.20 ±0.27 |
2 | 0 - 5 | 3.95 ±0.33 | 0.22 ±0.03 | 25.74 ±5.50 | 1.21 ±0.27 |
| 5 - 10 | 3.04±0.33 | 0.16 ±0.03 | 6.57 ±5.50 | 0.21 ±0.27 |
| 10 - 20 | 2.55 ±0.33 | 0.10 ±0.03 | 4.64 ±5.50 | 0.20 ±0.27 |
4 | 0 - 5 | 2.24 ±0.13 | 0.10 ±0.00 | 3.47 ±0.21 | 0.21 ±0.03 |
| 5 - 10 | 2.33 ±0.13 | 0.11 ±0.00 | 2.69 ±0.21 | 0.07 ±0.03 |
| 10 - 20 | 2.75 ±0.13 | 0.01 ±0.00 | 2.69 ±0.21 | 0.06 ±0.03 |
OM: organic matter; TN: Total nitrogen; av P: available phosphorus; K: potassium.
3.2.1. Organic Matter
Distribution of organic matter as a function of distances away from the tree trunk and soil depths was variable. Organic matter showed a sharp decreasing trend with increasing distances from tree trunk to the open field. Organic matter content was higher (5.41%) at the tree trunk (R2 = 0.69 β= -4.01) and sharply decreased (3.95%) at 2 m away from the trunk (R2 = 0.99; β = -1.26) and finally 2.24% at 4 m outside the canopy. In terms of soil depths, organic matter content reduced regularly with depth. It decreased from 5.41% (0-5 cm) (R2 = 0.99 β = -1.26) to 2.89% (5 -10 cm) (R2 = 0.55 β = -3.94) and 2.51% (10 – 20 cm).
3.2.2. Total Nitrogen
Total nitrogen significantly decreased within both upper layers (0-5 and 5 – 10 cm) as the distance from the tree trunk increased. It remained almost unchanged in the sub surface layer (10 – 20 cm), whatever the distance from the tree trunk. Total nitrogen was about 0.32% at tree trunk (R
2 =0.72; β= -55.10) and sharply decreased (0.22%) at 2 m away from the trunk (R
2 = 0.96; β= - 121.67) and finally to 0.1% in the open field, outside the canopy. According to depth, it regularly decreased from upper layers to sub surface layers. It was recorded at the tree trunk equal to 0.32%, 0.14% and 0.1%; 2 m away from the trunk about 0.22%, 0.16% and 0.1% compared to the open field where it was 0.1% for the first two layers and 0.01% at 0 – 5; 5 – 10 cm and 10 – 20 cm depths (
Table 5 and
Figure 6). Compared to open field, the complex made with
F. albida and stone walls contrbuted 220% and 120% of total nitrogen at the tree trunk and 2 m away from the tree trunk, respectively.
3.2.3. Available Phosphorus
Available phosphorus showed significant and irregular variations within the surface soil layer (0 – 5 cm) while in the sub surface layers (5 -10 cm; 10 – 20 cm) only slight variations were recorded as a function to the distances from the tree trunk. It was about 20.8 PPm at the tree trunk (R
2 = 0.62; β = - 0.71) and increased up to 25.74 PPm 2 m away from the trunk (R
2 = 0.65; β= - 0.53) where it dropped to 3.47 PPm in the open field (
Figure 6). In the subsurface layers, a slight decreasing trend was observed as distance from the trunk increased. The content of available phosphorus was equal at the tree trunk and 2 m away from the trunk (6. 57 PPm) compared to the open field, where it dropped to 2.69 PPm within 5 to 10 cm layer. In the last sub surface layer (10 – 20 cm), it was 5.80 PPm, 4.64 PPm and 2.69 PPm at tree trunk, 2 m away from the trunk and outside the tree canopy respectively. Thus, available phosphorus was higher under the tree canopy compared to the open field, where it considerably dropped. According to depth, available phosphorus content generally decreased as depth increased. It decreased in the first two layers (0 – 5 and 5 – 10 cm). At the three depths (0-5, 5-10 and 10 – 20 cm), it corresponded to 20.8 PPm, 6.57 PPm and 5.80 PPm at the tree trunk respectively. At 2 m away from the trunk, it was about 25. 74 PPm, 6.57 PPm and 4.64 PPm compared to the open field where it was 3.47 PPm and dropped to 2.69 PPm for the last two layers.
Figure 6. Relationship between organic matter (OM), total N (TN), available Phosphorus (av P) and potassium (K) concentrations and distance (m) away from the Faidherbia albida trunk (m) and soil depth (cm) on an Eutric Regosol.
M00: OM at tree trunk; MO1: OM as a function of depths; TNO: TN at tree trunk; TNO1: TN as a function of depths; KOO: potassium at tree trunk; KO1: potassium as a function of depths; av POO: available phosphorus at tree trunk and av PO1 available phosphorus as a function of depth.
3.2.4. Potassium
Potassium did not show significant differences between the tree trunk and 2 m away from the trunk, where it significantly dropped in the open field. It was about 1.25 Cmol/kg at the tree trunk (R2 = 0.64; β= -10.44), 1.21 Cmol/kg 2 m away from the trunk (R2 = 0.58; β= -10.12), and dropped to 0.21 Cmol/kg outside the canopy in the upper horizon. For both sub horizons (5 – 10 and 10 – 20 cm), it corresponded to 0.28 Cmol/Kg at the tree trunk, and 0.21 Cmol/kg 2 m away the trunk, compared to the open field where it sharply decreased to 0.07 Cmol/kg. For the first sub layer, it was 0.20 Cmol/kg at the tree trunk and 2 m away from the trunk, where it drastically decreased to 0.06 Cmol/kg outside the canopy. With increasing depth, potassium content regularly decreased from the top layer to the deeper ones. At the tree trunk it corresponded to 1.25 Cmol/kg (R2 = 0.78; β = - 2.99), 0.28 Cmol/kg (R2 = 0.95; β = - 17. 93) and 0.20 Cmol/kg for the three corresponding depths (0 -5, 5 – 10 and 10 – 20 cm). At 2 m away from the trunk, it was about 1.21, 0.21 and 0.20 Cmol/kg while outside, it was 0.21, 0.07 and 0.06 Cmol/kg. In contrast with Pellic Vertisol, where potassium regularly decreased with distance from the tree trunk, here there were no significant differences between the tree trunk and 2 m away from the trunk. It was almost equal at both locations and significantly dropped in the open field, outside the canopy.
Table 6. Influence of F.A. combined with stone walls on an Eutric Regosol under the canopy relative to the open area.
Soil variables | Effect size (RR) Mean (95% CI) |
pHw | 1.14 (1.10 – 1.18)NS |
OM | 1.66 (0.91 – 2.41)* |
Ca | 1.44 (0.99 – 1.82)* |
Mg | 1.03 (0.74 – 1.32)NS |
K | 4.47 (3 – 5.95)* |
Na | 1.83 (0.67 – 3)* |
TN | 5.63(1.27 – 10)* |
P (olsen) | 4.57 (1.72 – 7.42)* |
Humidity | 1.49 (0.63 – 2.36)* |
Temperature | 1.03 (1 -1.06)NS |
NS: indicate non significant; *indicate significant increases under canopy compared to open area. responses under canopy are not significantly different from the open area if the 95% CI of RR encompass 1. Figures in parenthesis are 95% confidence limits
Comparatively to Pellic Vertisol, there were significant increases in several soil properties under the tree canopy: OM, total nitrogen, exchangeable Ca, K, and Na, available P and humidity (
Table 6). The improvement contributed by Faidherbia associated with stonewalls under the tree canopy, compared to the open field was 141.5% for OM, 201.9% for total nitrogen, 89.35%, 495.2% and 93.3% for exchangeable Ca, K and Na respectively; 499.4% for available Phosphorus, and 109.8% for humidity (
Table 7).
Table 7. Comparison of proportional deviation in percent (%) of some soil properties which were significantly increased under Faidherbia albida tree (Pellic Vertisol) or under F.A tree associated with stone walls (Eutric Regosol) compared to the corresponding open field.
Soils properties | Pellic Vertisol | Eutric Regosol |
OM (%) | 46.24 | 141.5 |
Total N (%) | 128.23 | 201.9 |
Ca (Cmol/kg) | - | 89.35 |
K (Cmol/kg) | 254.29 | 495.2 |
Na (Cmol/kg) | - | 93.3 |
Available P (PPm) | 270.85 | 499.4 |
Hum (%) | - | 109.8 |
OM: organic matter, Total N: total nitrogen, Hum: humidity
According to
| [16] | Sileshi, G. W. The magnitude and spatial extent of influence of Faidherbia albida trees on soil properties and primary productivity in drylands. Journal of Arid Environments 132. 2016. 1–14. https://doi.org/10.1016/j.jaridenv.2016.03.002 |
[16]
, both soils types were in conditions of low soil fertility for OM, total N, K and available P (Pellic Vertisol); and OM, total N, available P, K, Ca, Na and humidity (Eutric Regosol). Compared to the open field,
Faidherbia albida had a positive influence on soil properties and significantly improved fertility on Pellic Vertisol, despite slight, moderate and severe soil erosion at the tree trunk, 2 m away and outside the canopy respectively. These areas were relatively exposed to run off or soil erosion.
Soils along the slope and under the F.A. tree canopy were stabilized, and strongly protected by stone walls built by farmers and by F.A. root system. Nutrient elements were supplied by
Faidherbia albida tree and by weathering of rock fragments. Erosion was slight under the canopy and moderate outside. These soils benefited from the positive influence of
Faidherbia albida tree near the tree trunk (
Table 7). This improvement gradually decreased towards patches, outside the tree influence zone.
3.2.5. pHw and Some Exchangeable Cations
In contrast with Pellic Vertisol, pHw, Ca, and Mg were higher under the tree canopy than outside. These soil parameters generally, decreased as the distance from the tree trunk increased. pHw ranged between 7.12 to 7.48 at the tree trunk and 2 m away under the canopy, compared to 6.4 in the open field within top soils (0 – 5 cm). Exchangeable Ca was 17.79 Cmol/kg, 16.49 Cmol/kg and 9.39 Cmol/kg at the tree trunk, 2 m away from the tree trunk and outside the canopy respectively. Exchangeable Mg was 2.93 Cmol/kg, 5.21 Cmol/kg and 3.95 Cmol/kg at tree trunk, 2 m away the trunk and in the open field respectively (
Table 8).
Table 8. Lateral and vertical variations of pHw and some exchangeable cations contents under and outside the Faidherbia Albida tree within Eutric Regosol (mean ±standard error, n = 9 samples).
Distance from tree (m) | Depth (cm) | Temperature (°C) | Humidity (%) |
Std. Dev. | | 0.99 | 6.04 |
CV | | 0.03 | 0.33 |
0 | 0-5 | 38.3±0.45 | 14.9±0.78 |
| 5-10 | 38.2±0.45 | 18.2±0.78 |
| 10-20 | 36.6±0.45 | 16.7±0.78 |
2 | 0-5 | 36.8±0.29 | 16.8±2.17 |
| 5-10 | 36.4±0.29 | 25.5±2.17 |
| 10-20 | 35.6±0.29 | 23.8±2.17 |
4 | 0-5 | 36.6±0.26 | 7.1±4.52 |
| 5 -10 | 36.1±0.26 | 16.2±4.52 |
| 10-20 | 35.5±0.26 | 26.3±4.52 |
Std.Dev. standard deviation; CV: coefficient of variation.
According to depth, pHw dynamics showed a contrasting trend with Pellic Vertisol. It regularly decreased as depth increased whatever the position of the tree trunk. At the tree trunk it was respectively 7.12, 7.05 and 6.8 for the three depths (0-5. 5- 10. and 10 – 20 cm). At 2 m away from the trunk it corresponded to 7.48, 7.26 and 7.2. Outside the canopy, it did not show any significant variation. It was respectively 6.4, 6.15 and 6.17 for the above mentioned depths. Exchangeable Ca sharply decreased as depth increased under the tree canopy as compared to the open field, where in contrast, within the three layers, the amount of exchangeable Ca increased with depth. It was about 17.79 Cmol/kg, 14.43 Cmol/kg and 14.64 Cmol/kg at the tree trunk respectively for the three depths (0 -5, 5 – 10 and 10-20 cm). At 2 m away from the tree trunk, it corresponded to 16.49 Cmol/kg, 16.06 Cmol/kg and 15.99 Cmol/kg for the above-mentioned depths. Outside the tree canopy, it was 9.39 Cmol/kg, 10.81 Cmol/kg and 14.72 Cmol/kg for the three corresponding depths. Although significant variations were not observed for exchangeable Mg, this element was more concentrated under the tree canopy than in the open field. Outside the canopy, it showed the same trend with exchangeable Ca in the open field; i.e.
It increased as depth increased.
3.2.6. Temperature and Humidity
Analysis of variance for soil temperature in this site revealed that there were no significant variations in temperature among different locations under and outside
Faidherbia albida tree. Within Eutric Regosol, temperatures varied between 36.8°C to 38.3°C, respectively at 2 m and at the tree trunk (
Table 9) as compared to Pellic Vertisol where it was recorded between 31.1°C and 35.7°C at the tree trunk and 2 m away within top soils (0-5 cm). Outside the tree, in the open field, it was estimated at 36.6°C on Regosol while it was about 43.80°C on Pellic Vertisol. Humidity was between 9.60% to 24.10% on Pellic Vertisols, while it varied between 7.1% and 26.3% on Eutric Regosol, where farmers had built stone walls and kept them in place before every growing seasons.
Table 9. Average soil temperature (°C) and humidity (%) measurements at the time of sampling under and outside the Faidherbia albida tree on an Eutric Regosol at 5, 10 and 20 cm depth soils (n = 9 samples).
Distance from tree (m) | Depth (cm) | Temperature (°C) | Humidity (%) |
Std. Dev. | | 0.99 | 6.04 |
CV | | 0.03 | 0.33 |
0 | 0-5 | 38.3±0.45 | 14.9±0.78 |
| 5-10 | 38.2±0.45 | 18.2±0.78 |
| 10-20 | 36.6±0.45 | 16.7±0.78 |
2 | 0-5 | 36.8±0.29 | 16.8±2.17 |
| 5-10 | 36.4±0.29 | 25.5±2.17 |
| 10 - 20 | 35.6±0.29 | 23.8±2.17 |
4 | 0-5 | 36.6±0.26 | 7.1±4.52 |
| 5 -10 | 36.1±0.26 | 16.2±4.52 |
| 10-20 | 35.5±0.26 | 26.3±4.52 |
Std.Dev. standard deviation; CV: coefficient of variation
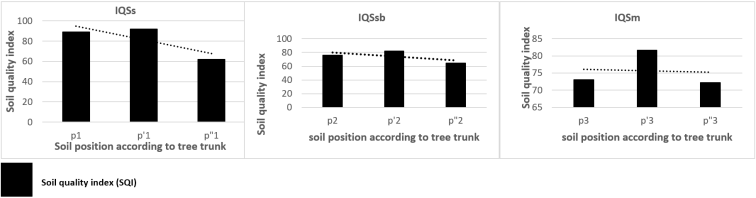
3.2.7. Assessment of an Eutric Regosol Quality
According to
Figure 7, three trends SQIs = IQSs (soil quality index for 0 – 5 cm layer), SQIsb = IQSsb (soil quality index for 5 – 10 cm layer) and SQIm = IQSm (soil quality index for 10 – 20 cm layer) assessing inputs from
Faidherbia albida tree associated with stone walls on soil quality were recorded. Considering soils in the open field (P’’1, P’’2, P’’3), outside the
Faidherbia albida canopy as control, soils at the tree trunk and 2 m away the trunk were of best quality. Those at 2 m away from the trunk were by far the best. For surface soils (0 -5 cm), soil quality index (SQI) was about 89.23 and 91.98 respectively at tree trunk and 2 m, as compared to the open field (62.16) outside the canopy. For subsurface layer (5 -10 cm), it was 75.80 and 82.05 respectively at the tree trunk and 2 m away from the trunk, as compared to 64.25 in the open field. Within deep soils (10 -20 cm), 73.09 and 81.61 were respectively recorded at the tree trunk and 2 m away from the trunk as compared to the open field (72.19).
Figure 7. Assessment of inputs from Faidherbia albida associated with stone walls following depth and distance from tree trunk on Eutric Regosols quality.
P1: soil at tree trunk, P’1: soil 2 m away from tree trunk, P’’1: soil 4 m away the tree trunk on surface soil (0 – 5 cm); P2: soil at tree trunk, P’2: soil 2 m away the tree trunk, P’’2: soil 4 m away the tree trunk for subsurface layer (5 – 10 cm); P3: soil at tree trunk, P’3: soil 2 m away the trunk and P’’3: soil 4 m away the tree trunk for subsurface layer (10 – 20 cm). IQSs: soil quality index for surface soil (0 – 5 cm), IQSsb: soil quality index for subsurface soil (5 – 10 cm), IQSm: soil quality index for subsurface layer (10 – 20 cm).
Soil quality index is higher in soil under F.A. tree compared to those outside. This result suggests that soil under F.A. are of better quality, especially those at 2 m away from the tree trunk. SQI2_1uF.A. ˃˃ SQI2_1’oF.A. (SQI2_1uF.A. = 90.61; SQI2_1’oF.A. = 62.16). SQI2_2uF.A. ˃ SQI2_2’oF.A. (SQI2_2uF.A. = 78.92; SQI2_2’oF.A. = 64.25). SQI2_3uF.A. ˃ SQI2_ 3’oF.A. (SQI2_3uF.A. = 77.35; SQI2_3’oF.A. = 72.19). Because of association with stonewalls, soil temperature was mitigated and soil humidity was conserved for the long period of times within the whole plow layer (0- 20 cm). Consequently, soil quality was improved up to 20 cm depth.
4. Discussion
4.1. Inputs from F.A. on Pellic Vertisol Along the Plain
4.1.1. OM, TN, P and K
OM, TN, available P, and K generally followed the pattern of higher concentration under the canopy compared to open field in semi-arid areas
| [2] | Kuyah, S., Cory, W. W., M, J., Gudeta, W. S., Ingrid, Ö. Catherine, W., Muthuri, and Eike, L. Agroforestry de livers a win-win solution for ecosystem services in sub-Saharan Africa. A meta-analysis. Agronomy for Sustainable Development. 2019, 39–47. https://doi.org/10.1007/s13593-019-0589-8 |
| [15] | Payne, W. A., Williams, J. H., Maï, K. A., Moussa, and Stern, R. D. Crop ecology production and management crop diversification in the sahel through use of environmental changes near faidherbia albida (del.) a. chev. Crop Sci. 38. 1998. 1585-1591. https://doi.org/10.2135/cropsci1998.0011183X003800060029x |
| [16] | Sileshi, G. W. The magnitude and spatial extent of influence of Faidherbia albida trees on soil properties and primary productivity in drylands. Journal of Arid Environments 132. 2016. 1–14. https://doi.org/10.1016/j.jaridenv.2016.03.002 |
| [22] | Kamara, C. S., and Haque, I. Faidheria albida and its effects on Ethiopian highland Vertisols. Agroforestry systems 18. 1992. 17–29. https://doi.org/10.1007/BF00114814 |
| [35] | Musa, A., Lisanework, N., Ayele, A. Impact of Parkland Trees (Faidherbia albida Delile and Cordia Africana Lam) on Selected Soil Properties and Sorghum Yield in Eastern Oromia, Ethiopia. Agriculture, Forestry and Fisheries. 9(3) 2020. 54- 66. https://doi.org/10.11648/j.aff.20200903.13 |
[2, 15, 16, 22, 35]
. Studies conducted in the drylands of Kenya demonstrated that SOM and total Nitrogen are directly related to the amount of plant residues in the soil. Their higher concentration under the canopy compared to the open field could be associated with higher OM from leaf litter fall and dead tree roots
| [4] | Syano, N. M., Nyangito, M., Kironchi, G., and Wasonga, O. Agroforestry practices impacts on soil properties in the drylands of Eastern Kenya. Trees, forests and people 14. 2023. 10043. https://doi.org/10.1016/j.tfp.2023.100437 |
[4]
. According to
| [16] | Sileshi, G. W. The magnitude and spatial extent of influence of Faidherbia albida trees on soil properties and primary productivity in drylands. Journal of Arid Environments 132. 2016. 1–14. https://doi.org/10.1016/j.jaridenv.2016.03.002 |
[16]
while assessing the magnitude and spatial extent of
F.A. tree influence on soil properties in drylands, these soils might be in conditions of low fertility for those nutrient elements, as
F.A. tree has considerably improved soil for those elements within its area of influence. In addition, he demonstrated that the “
albida effect” was remarkable where the soil by itself is not able to satisfy the nutrient demand of crops. These nutrient elements could be released while litter from tree canopy undergoes microbial decomposition followed by mineralization and release of simple products into the soil. Furthermore, the decreasing trend in SOM, total N, available phosphorus and potassium with depth is in agreement with the results of
| [4] | Syano, N. M., Nyangito, M., Kironchi, G., and Wasonga, O. Agroforestry practices impacts on soil properties in the drylands of Eastern Kenya. Trees, forests and people 14. 2023. 10043. https://doi.org/10.1016/j.tfp.2023.100437 |
[4]
. In their study on the traditional practices, they reveal a decrease of these elements of soil as a function of depth in the drylands of Eastern Kenya. This could be firstly ascribed to the accumulation of tree residues and root fragments at the soil surface layer and secondly to nutrient uptake from greater soil depths by these trees, followed by their return to the soil surface through litter fall, which concentrates them near the surface.
Being major nutrient elements, total N, available P, and K levels play a decisive role in estimating the amount of fertilizer to be applied for a specific crop requirement at a site
| [22] | Kamara, C. S., and Haque, I. Faidheria albida and its effects on Ethiopian highland Vertisols. Agroforestry systems 18. 1992. 17–29. https://doi.org/10.1007/BF00114814 |
[22]
. Their improvement through inputs from F.A. constitutes the best alternative for this area.
OM here falls within the interval of low to moderate content
| [36] | Biernbaum, J. Organic Matters: Feeding the Soil and Building Soil Quality. Michigan State University. 2012. 1-7. |
| [37] | Oku, E. E., Abdao dos Passos, A. M., Quintino, S., Nkiruka, C. O., Titilayo, B. O., Soil fertility status of soils of Sudano-Sahelian and Humid Forest zones of West Africa and some soil management strategies for smallholder farms. International Journal of Environmental Quality 46. 2021. 25-36. https://doi.org/10.6092/issn.2281-4485/12745 |
[36, 37]
. Consequently, soils have low to moderate structural condition and structural stability. Improvement in OM under
F.A. canopy is expected to improve aggregate stability, reduce bulk density, increase infiltration rates and water availability
| [16] | Sileshi, G. W. The magnitude and spatial extent of influence of Faidherbia albida trees on soil properties and primary productivity in drylands. Journal of Arid Environments 132. 2016. 1–14. https://doi.org/10.1016/j.jaridenv.2016.03.002 |
[16]
and reduce run off and then phenomenon of soil erosion. Within farmland, when the latter phenomenon has not yet become severe, a farmer may not even realize that a problem exists. That does not mean that crop yields are unaffected. According to studies conducted in three Midwestern soils in the United States, yield could decrease by 5 – 10% when only moderate erosion occurs. Yield may decrease by 10 – 20% or more with severe erosion. The results of studies conducted in Mambang II on Pellic Vertisol under and outside the canopy, in reference to Schertz et al. (1985)
in | [38] | Magdoff, F., and Van, E. H. Building soils for better crops ecological management for healthy soil. Handbook series book 10 by the sustainable agriculture research and education (Sare) program. 2021. 410 p. |
[38]
; evaluating the contribution of the
F.A. tree in protecting Pellic Vertisol against erosion shown in
Table 10 indicated that, erosion severely affects OM content and humidity outside the canopy. Here, soils are bare and consequently exposed to erosion and evapotranspiration. At 2 m from the tree trunk, they are moderately affected by erosion, and at the tree trunk, the negative impact of soil erosion remains slight because of the higher level of OM recorded and the protection exerted by the tree canopy.
Table 10. Contribution from F.A. tree in conservation of Pellic Vertisol against the phenomenon of erosion.
Distances Away from trunk (m) | Organic matter (%) | humidity (%) | Erosion |
0 | 3.094 | 12.30 | Slight |
2 | 2.24 | 10.10 | moderate |
4 | 1.45 | 9.60 | severe |
4.1.2. pHw, Ca and Mg
In contrast to the above-mentioned macro nutrient elements, pHw, Ca and Mg were high outside the tree canopy and particularly important in subsoil layers (5 -10 cm and 10 – 20 cm) compared to top soil (0-5 cm) under the canopy. These results are in accordance with those obtained in semi-arid areas (Ethiopia and Kenya’s drylands)
| [4] | Syano, N. M., Nyangito, M., Kironchi, G., and Wasonga, O. Agroforestry practices impacts on soil properties in the drylands of Eastern Kenya. Trees, forests and people 14. 2023. 10043. https://doi.org/10.1016/j.tfp.2023.100437 |
| [22] | Kamara, C. S., and Haque, I. Faidheria albida and its effects on Ethiopian highland Vertisols. Agroforestry systems 18. 1992. 17–29. https://doi.org/10.1007/BF00114814 |
| [35] | Musa, A., Lisanework, N., Ayele, A. Impact of Parkland Trees (Faidherbia albida Delile and Cordia Africana Lam) on Selected Soil Properties and Sorghum Yield in Eastern Oromia, Ethiopia. Agriculture, Forestry and Fisheries. 9(3) 2020. 54- 66. https://doi.org/10.11648/j.aff.20200903.13 |
[4, 22, 35]
indicating that,
F.A. trees did not significantly influence soil pHw values. However, they are in contrast with several reports from semi-arid areas of Malawi and Niger
| [11] | Rhoades, C. Seasonal pattern of nitrogen mineralization and soil moisture beneath Faidherbia albida (Syn Acacia al bida) in Central Malawi. Agroforestry systems 29: 1995. 133–145. https://doi.org/10.1007/BF00704882 |
| [15] | Payne, W. A., Williams, J. H., Maï, K. A., Moussa, and Stern, R. D. Crop ecology production and management crop diversification in the sahel through use of environmental changes near faidherbia albida (del.) a. chev. Crop Sci. 38. 1998. 1585-1591. https://doi.org/10.2135/cropsci1998.0011183X003800060029x |
[11, 15]
. There, these elements gradually declined with greater distance from the tree. Referring to studies conducted in drylands by several authors
| [2] | Kuyah, S., Cory, W. W., M, J., Gudeta, W. S., Ingrid, Ö. Catherine, W., Muthuri, and Eike, L. Agroforestry de livers a win-win solution for ecosystem services in sub-Saharan Africa. A meta-analysis. Agronomy for Sustainable Development. 2019, 39–47. https://doi.org/10.1007/s13593-019-0589-8 |
| [16] | Sileshi, G. W. The magnitude and spatial extent of influence of Faidherbia albida trees on soil properties and primary productivity in drylands. Journal of Arid Environments 132. 2016. 1–14. https://doi.org/10.1016/j.jaridenv.2016.03.002 |
[2, 16]
, this could be attributed to the saturated fertility effect by pHw and exchangeable cations. This means that the soil itself satisfies the nutrient demand of crops for those elements. Soils under the tree canopy were acidic to slightly acidic compared to outside, where they were neutral (
Table 3).
| [15] | Payne, W. A., Williams, J. H., Maï, K. A., Moussa, and Stern, R. D. Crop ecology production and management crop diversification in the sahel through use of environmental changes near faidherbia albida (del.) a. chev. Crop Sci. 38. 1998. 1585-1591. https://doi.org/10.2135/cropsci1998.0011183X003800060029x |
[15]
also argued that the decrease in soil pHw near the tree trunk was related to increase soil phosphorus (P) availability, considering soil phosphate deficiency as the most limiting factor to agricultural production in semi-arid west Africa. It is also argued that the lower soil pHw near the tree trunk could be due to acid production by deep roots. This acid releases H
+ protons during absorption of positively charged basic cations
| [4] | Syano, N. M., Nyangito, M., Kironchi, G., and Wasonga, O. Agroforestry practices impacts on soil properties in the drylands of Eastern Kenya. Trees, forests and people 14. 2023. 10043. https://doi.org/10.1016/j.tfp.2023.100437 |
[4]
.
4.1.3. Temperature and Humidity
The increase in soil temperature with increasing distance from the tree trunk is consistent with several reports
| [2] | Kuyah, S., Cory, W. W., M, J., Gudeta, W. S., Ingrid, Ö. Catherine, W., Muthuri, and Eike, L. Agroforestry de livers a win-win solution for ecosystem services in sub-Saharan Africa. A meta-analysis. Agronomy for Sustainable Development. 2019, 39–47. https://doi.org/10.1007/s13593-019-0589-8 |
| [16] | Sileshi, G. W. The magnitude and spatial extent of influence of Faidherbia albida trees on soil properties and primary productivity in drylands. Journal of Arid Environments 132. 2016. 1–14. https://doi.org/10.1016/j.jaridenv.2016.03.002 |
[2, 16]
, which demonstrated that interception of radiation and rainfall by foliage allows trees canopies to moderate soil temperature
| [2] | Kuyah, S., Cory, W. W., M, J., Gudeta, W. S., Ingrid, Ö. Catherine, W., Muthuri, and Eike, L. Agroforestry de livers a win-win solution for ecosystem services in sub-Saharan Africa. A meta-analysis. Agronomy for Sustainable Development. 2019, 39–47. https://doi.org/10.1007/s13593-019-0589-8 |
[2]
. The reverse phenology of this tree species, which allows crops to grow under its canopy during the rainy season, maintains favorable microscale hydrological processes around the tree
| [16] | Sileshi, G. W. The magnitude and spatial extent of influence of Faidherbia albida trees on soil properties and primary productivity in drylands. Journal of Arid Environments 132. 2016. 1–14. https://doi.org/10.1016/j.jaridenv.2016.03.002 |
[16]
. The lower temperature under the tree canopy could largely be due to shade effects. The difference in soil temperature under and outside the canopy further illustrates the factors influencing soil properties under
F.A. tree canopy and outside
| [22] | Kamara, C. S., and Haque, I. Faidheria albida and its effects on Ethiopian highland Vertisols. Agroforestry systems 18. 1992. 17–29. https://doi.org/10.1007/BF00114814 |
[22]
. The variation in temperature with depth could be explained by the Sahelian climate, which generate high temperatures in top soils, while temperature decreases with increasing depth due to humidity retained by complexes formed with soil organic matter and heavy clay of the lowland Vertisol
| [39] | Gouban, H., Bitom, M. L., Temga, J. P., Sababa, E., Azinwi, P. T., Basga, S. D., Yaboki, E., Nguetnkam, J. P., Bitom, D. L. Pedo- geochemistry of vertisols under Tropical seasonally contrasted climate, Northern Cameroon: Implications for Vertisolization. Earth Sciences 22. 2022. 11(4): 171-193.
https://doi.org/10.11648/j.earth.20221104.14 |
[39]
. Since soil properties are temperature dependent, temperature increases organic matter decomposition within the range of 2°C and 38°C. Between 10°C and 28°C, the activity of enzymes degrading polymeric organic matter accelerates, increases soil respiration and nitrogen mineralization rates. In addition, it increases between 25°C and 39°C leads to increase soil pH, and between 5°C and 25°C phosphorus levels
| [34] | Alli, A. A., and Omofunmi, O. E. A review of soil temperature under a controlled irrigation system. Journal of Research in Forestry, Wildlife and Environment 13(1) 2021. 10 p. |
[34]
.
In contrast to soil temperature, soil humidity decreased as the distance from tree trunk increased in the top soil. These results agree with
| [11] | Rhoades, C. Seasonal pattern of nitrogen mineralization and soil moisture beneath Faidherbia albida (Syn Acacia al bida) in Central Malawi. Agroforestry systems 29: 1995. 133–145. https://doi.org/10.1007/BF00704882 |
[11]
who found that soil humidity increases in surface alluvial soils on the lakeshore plain of central Malawi. Trees canopies moderate soil humidity by reducing water loss through evaporation and crop transpiration. With depth, soil humidity increases because surface horizons are more exposed to evapotranspiration than subsurface soils layers in semi-arid climate. The contrasting trend between soil temperature and soil humidity was also highlighted by
| [34] | Alli, A. A., and Omofunmi, O. E. A review of soil temperature under a controlled irrigation system. Journal of Research in Forestry, Wildlife and Environment 13(1) 2021. 10 p. |
[34]
who found that, an increase in soil temperature decreases soil humidity content and increases soil aeration.
4.1.4. Assessment of Pellic Vertisol Quality
Variations of SQI according to distance from the tree trunk in top soil show that soil quality decreased with increasing distance from tree trunk. Variations in subsurface layers increased as distance from tree trunk increased suggesting that only top soils are impacted by inputs from
Faidherbia albida tree. The best quality of top soils under the tree canopy compared to the open area could be due to higher organic matter content
| [40] | Parhizkar, M. Effects of trees and shrub species on soil quality sediment detachment capacity caused by rills and surface slope stability in forest lands of northern Iran. International journal of sediments Research 39. 2024. 795-803. https://doi.org/10.1016/j.ijsrc.2024.07.001 |
[40]
. From 5-10 cm depth, soils outside tree canopy are of best quality compared to those under canopy. Therefore, the best quality of subsoil here is not dependent on inputs from F.A. tree but could be related to the mineral fraction defining the nature of soils (Pellic Vertisol), whose characteristics are functions of parent material.
4.2. Inputs from Faidherbia albida and Stone Walls on an Eutric Regosol Along the Slope
4.2.1. OM, TN, P, and K
The distribution of OM with depth corroborates with
| [38] | Magdoff, F., and Van, E. H. Building soils for better crops ecological management for healthy soil. Handbook series book 10 by the sustainable agriculture research and education (Sare) program. 2021. 410 p. |
[38]
who demonstrated that soil organic matter is more important in the surface layer than in the subsurface. It is one of the main reasons why topsoils are more productive than subsoil.
F.A. tree combined with stone walls seems to have protected soils of steep slopes from erosion, as confirmed by
| [40] | Parhizkar, M. Effects of trees and shrub species on soil quality sediment detachment capacity caused by rills and surface slope stability in forest lands of northern Iran. International journal of sediments Research 39. 2024. 795-803. https://doi.org/10.1016/j.ijsrc.2024.07.001 |
[40]
, who found that vegetation is an alternative technology to stabilize slopes and control soil erosion. The root system has significant effects on slope instability through mechanical reinforcement of soil. In reference to studies conducted in three Midwestern soils in the United States, yield on these Eutric Regosols may decreased by 5 to 10% because of moderate erosion outside the canopy. At the tree trunk and at 2 m away from the tree, in accordance with Schertz et al. (1985)
in | [38] | Magdoff, F., and Van, E. H. Building soils for better crops ecological management for healthy soil. Handbook series book 10 by the sustainable agriculture research and education (Sare) program. 2021. 410 p. |
[38]
(
Table 11), erosion slightly affected organic matter and humidity. Barriers formed with stone walls around tree species stabilized organic matter inputs from decomposing litter and decaying roots of
Faidherbia albida. Thus, these results could be explained by the system of stone walls constructed by farmers that protected soils against erosion and then depletion of organic matter and nutrients elements.
Table 11. Effects of F.A. tree with stone walls on erosion within an Eutric Regosol.
Distances away from trunk (m) | Organic matter (%) | Humidity (%) | Erosion |
0 | 5.41 | 14.9 | Slight |
2 | 3.95 | 16.8 | Slight |
4 | 2.25 | 7.1 | moderate |
Variations of OM, total N and available phosphorus as a function of the tree trunk and depth are similar. They decrease with increasing distance from tree trunk and soil depth. These findings are consistent with
| [4] | Syano, N. M., Nyangito, M., Kironchi, G., and Wasonga, O. Agroforestry practices impacts on soil properties in the drylands of Eastern Kenya. Trees, forests and people 14. 2023. 10043. https://doi.org/10.1016/j.tfp.2023.100437 |
[4]
in the drylands of eastern Kenya, who showed that soil organic matter and nitrogen content are directly related to the amount of plant residues in the soil. Moreover, higher total nitrogen values could be associated with higher OM from leaf litter fall and dead tree roots. Higher phosphorus content under tree canopies and in surface layers could be partly associated with phosphorus uptake from greater soil depths by trees, followed by return to soil surface through litter fall, which concentrates nutrients near the soil surface. The distribution of K in equal amount at the tree trunk and 2 m away from trunk showed that the complex formed by
F.albida and stone walls significantly improved potassium content through litter fall and similar conditions of microbial decomposition and mineralization at both distances (at the tree trunk and 2 m) from the tree trunk. Furthermore, potassium content was much higher in Eutric Regosol than in Pellic Vertisol, probably due to weathering of rock fragments composing the stone walls.
| [16] | Sileshi, G. W. The magnitude and spatial extent of influence of Faidherbia albida trees on soil properties and primary productivity in drylands. Journal of Arid Environments 132. 2016. 1–14. https://doi.org/10.1016/j.jaridenv.2016.03.002 |
[16]
, when evaluating the magnitude and spatial extent of
F.A. effects on soil properties also underlined these significant increases in nutrient elements. Despite their position along the slope, they were more fertile than Pellic Vertisol on the plain. They contained more than three times OM and at least twice total N, K and P (
Table 7). This enrichment is explained by the simultaneous supply of nutrient elements from the
F.A. and the ongoing weathering of rock fragments composing stone walls. Weathering of amphibolite fragments
| [12] | PRECASEM, 1/1000000-scale geological map of Cameroon. 2021. Second edition. |
[12]
could be probably the main source of exchangeable cations (Ca, K and Na). The stone walls and
F.A. stabilize the slope, protected soils against run off and evapotranspiration and allow conservation of nutrient elements and soil humidity.
4.2.2. pHw and Some Exchangeable Cations
OM, total N, available P and K on the one hand, pHw, Ca and Na on the other hand, followed the pattern of higher concentration under the canopy as compared to the open field. These elements could be simultaneously contributed by
F.A. tree through decomposition of litter fall and from superficial weathering of rock fragments that composed stone walls and cover the soils. Moreover, according to
| [40] | Parhizkar, M. Effects of trees and shrub species on soil quality sediment detachment capacity caused by rills and surface slope stability in forest lands of northern Iran. International journal of sediments Research 39. 2024. 795-803. https://doi.org/10.1016/j.ijsrc.2024.07.001 |
[40]
, part of polyvalent cations could be provided from the root system of
F.A. with the aim to bind fine particles into macro aggregates and enhance soil erosion resistance. These Regosols, in reference to
| [16] | Sileshi, G. W. The magnitude and spatial extent of influence of Faidherbia albida trees on soil properties and primary productivity in drylands. Journal of Arid Environments 132. 2016. 1–14. https://doi.org/10.1016/j.jaridenv.2016.03.002 |
[16]
, could be in conditions of low fertility for OM, total N, available P and K. Ca and Na were probably contributed from superficial weathering of rock fragments and root system under the tree canopy. This superficial weathering could be favored by combined actions of dry air in this Sahelian area, the mechanical and chemical actions of
F.A. roots, enzymes and water from rain during the rainy season. These processes enabled the release of exchangeable cations (Ca, Na) and then improved pHw within the topsoil close to
F.A. tree. This pHw was neutral under the tree canopy and slightly acidic outside.
4.2.3. Temperature and Humidity
Soil humidity and soil temperature are related so that an increase in soil temperature leads to a decrease in soil humidity content
| [34] | Alli, A. A., and Omofunmi, O. E. A review of soil temperature under a controlled irrigation system. Journal of Research in Forestry, Wildlife and Environment 13(1) 2021. 10 p. |
[34]
. Variations in soil temperature and humidity within both soils
could be explained by the nature of their superficial layers. On Eutric Regosol, soils were covered with F.A trees, rock fragments and surmounted with stone walls. These soils along the slope would be more exposed to evapotranspiration than Pellic Vertisol and could rapidly lose water to the atmosphere if both covers (
F.A. tree and rock fragments) were absents. Therefore, moderate soil temperature and high soil humidity could be explained by the shade generated by
Faidherbia albida trees, the rock fragment cover layer and the presence of stonewalls built all over this site. These conservation structures participated in stabilizing soils along the slope, lowering soil temperature and conserving soil humidity and nutrient elements. Due to the complex formed by
Faidherbia albida tree and stonewalls on Eutric Regosol, soil temperature was mitigated and soil humidity conserved for long periods within the whole arable layer. Consequently, soil quality along the slope was improved up to 20 cm depth, while on Pellic Vertisol on plain with the heavy clays, where inputs were from
Faidherbia albida and relative accumulation of materials from slope, the improvement did not exceed 10 cm depth (
Figure 5).
4.2.4. Assessment of An Eutric Regosol Quality
The significant improvement in soil quality on an Eutric Regosol under
F.A. tree combined with stone walls corroborates the study by
| [40] | Parhizkar, M. Effects of trees and shrub species on soil quality sediment detachment capacity caused by rills and surface slope stability in forest lands of northern Iran. International journal of sediments Research 39. 2024. 795-803. https://doi.org/10.1016/j.ijsrc.2024.07.001 |
[40]
who found that higher values of soil properties recorded under these soils compared to open areas lead to improvement of soil quality. Soil quality has improved in the entire plow layer (0-20 cm). Despite their position along the slope, Eutric Regosols are more fertile than Pellic Vertisol on the plain. They contain more than three times OM and at least twice total N, K and available P (
Table 7). The fertility of these soils originates from superficial weathering of rock fragments, litter fall from F.A., uptake from deeper soil layers followed by return to the soil surface through and the root system.
Local knowledge that contribute to restore soil quality are the best alternatives to preserve the environment and fight against food insecurity and malnutrition. However, further studies within the same context in far North region with more vast area and high number of samples could better valorize these findings.