1. Introduction
Under the background of global warming, the water cycle has intensified, extreme precipitation and prolonged drought events have become more frequent, and drought-flood abrupt alternation (DFAA) has become increasingly prominent
| [1] | Cui, H., Jiang, S., Ren, L., et al. Identification of drought-flood abrupt alternation by a new non-stationary framework considering natural-social system impacts. Journal of Hydrology, 2025, 654, 132899.
https://doi.org/10.1016/j.jhydrol.2025.132899 |
| [2] | Wang, L., Yuan, Z., Shi, X., et al. A driving force analysis method for drought-flood abrupt alternation events. Ecological Informatics, 2025, 90, 103214.
https://doi.org/10.1016/j.ecoinf.2025.103214 |
[1, 2]
. DFAA refers to a meteorological and hydrological event in which a region shifts rapidly from a persistent drought state to an extreme flood state, or vice versa, within a short period
| [3] | Lu, Q., Tu, G., Yan, B., et al. Review and prospect of research progress on drought-flood abrupt alternation. Journal of Yangtze River Scientific Research Institute, 2026, 43(2), 111–119. https://doi.org/10.11988/ckyyb.20241276 (in Chinese with English abstract) |
[3]
. Such events are characterized by strong suddenness, rapid evolution, difficult prediction and prevention, and pronounced disaster-chain effects
| [4] | Qiao, Y., Xu, W., Meng, C., et al. Review of study on dry wet abrupt alternation: progress and challenge. Journal of Catastrophology, 2023, 38(3), 131–138.
https://doi.org/10.3969/j.issn.1000-811X.2023.03.021 (in Chinese with English abstract) |
| [5] | Zheng, S., Weng, B., Bi, W., et al. Significant increase and escalation of drought-flood abrupt alteration in China’s future. Agricultural Water Management, 2025, 312, 109449.
https://doi.org/10.1016/j.agwat.2025.109449 |
[4, 5]
. They can cause serious harm to agricultural production
| [6] | Shan L., Zhang L., Song J., et al. Characteristics of dry-wet abrupt alternation events in the middle and lower reaches of the Yangtze River Basin and the relationship with ENSO. Journal of Geographical Sciences, 2018, 28(8), 1039–1058.
https://doi.org/10.1007/s11442-018-1540-7 |
| [7] | Su, J., Ding, Y., Liu, Y., et al. China is suffering from fewer but more severe drought to flood abrupt alternation events. Weather and Climate Extremes, 2024, 46, 100737.
https://doi.org/10.1016/j.wace.2024.100737 |
[6, 7]
, water supply
| [8] | Barendrecht, M. H., Matanó, A., Mendoza, H., et al. Exploring drought-to-flood interactions and dynamics: a global case review. WIREs Water, 2024, 11(4), e1726.
https://doi.org/10.1002/wat2.1726 |
[8]
, urban waterlogging control, and the ecological environment
| [8] | Barendrecht, M. H., Matanó, A., Mendoza, H., et al. Exploring drought-to-flood interactions and dynamics: a global case review. WIREs Water, 2024, 11(4), e1726.
https://doi.org/10.1002/wat2.1726 |
| [9] | Xie, L., Li, Y., Zhang, Z., et al. Exploring the combined effects of drought and drought-flood abrupt alternation on vegetation using interpretable machine learning model and r-vine copula function. Agricultural and Forest Meteorology, 2025, 370, 110568. https://doi.org/10.1016/j.agrformet.2025.110568 |
[8, 9]
. Scientifically identifying regional DFAA events and revealing their spatiotemporal evolution are therefore of considerable practical significance for improving disaster early warning and risk prevention and control.
At present, DFAA events are mostly identified on the basis of meteorological drought indices. Early indices used precipitation alone over monthly or longer windows, such as the long-cycle drought-flood abrupt alternation index (LDFAI), contrasting the standardized precipitation of two adjacent two-month periods, was the first index designed to quantify DFAA
| [6] | Shan L., Zhang L., Song J., et al. Characteristics of dry-wet abrupt alternation events in the middle and lower reaches of the Yangtze River Basin and the relationship with ENSO. Journal of Geographical Sciences, 2018, 28(8), 1039–1058.
https://doi.org/10.1007/s11442-018-1540-7 |
[6]
, but fixing the transition at the window boundary allows anomalies on either side to offset one another, smoothing events within a window and leaving abruptness unrepresented
| [6] | Shan L., Zhang L., Song J., et al. Characteristics of dry-wet abrupt alternation events in the middle and lower reaches of the Yangtze River Basin and the relationship with ENSO. Journal of Geographical Sciences, 2018, 28(8), 1039–1058.
https://doi.org/10.1007/s11442-018-1540-7 |
| [10] | Tu, X., Pang, W., Chen, X., et al. Limitations and improvement of the traditional assessment index for drought-wetness abrupt alternation. Advances in Water Science, 2022, 33(4), 592–601. https://doi.org/10.14042/j.cnki.32.1309.2022.04.007 (in Chinese with English abstract) |
[6, 10]
. The short-cycle index (SDFAI), the precipitation-based SPI, and the SPEI, which additionally accounts for evaporative demand, are likewise monthly or longer; as window averages, they weight all days equally, ignore earlier precipitation and cannot resolve the instantaneous state of the land-atmosphere system
| [10] | Tu, X., Pang, W., Chen, X., et al. Limitations and improvement of the traditional assessment index for drought-wetness abrupt alternation. Advances in Water Science, 2022, 33(4), 592–601. https://doi.org/10.14042/j.cnki.32.1309.2022.04.007 (in Chinese with English abstract) |
[10]
. Another identification method retains the index-plus-run-theory architecture but shortens the timescale. Lu
| [11] | Lu, E. Determining the start, duration, and strength of flood and drought with daily precipitation: rationale. Geophysical Research Letters, 2009, 36(12): L12707.
https://doi.org/10.1029/2009GL038817 |
[11]
proposed the weighted average precipitation (WAP), in which antecedent precipitation contributions decay exponentially, and standardized it with a fitted Gamma distribution to obtain the standardized weighted average precipitation (SWAP) index. Because the weights decay rather than being truncated by a window, SWAP requires no predefined timescale and permits daily determination of the onset, duration, and strength of drought and flood
| [11] | Lu, E. Determining the start, duration, and strength of flood and drought with daily precipitation: rationale. Geophysical Research Letters, 2009, 36(12): L12707.
https://doi.org/10.1029/2009GL038817 |
[11]
. Based on run theory and memory parameters, it has become a standard tool for daily DFAA identification in the Yangtze
| [2] | Wang, L., Yuan, Z., Shi, X., et al. A driving force analysis method for drought-flood abrupt alternation events. Ecological Informatics, 2025, 90, 103214.
https://doi.org/10.1016/j.ecoinf.2025.103214 |
| [12] | Yang, J., Chen, H., Hou, Y., et al. A method to identify the drought-flood transition based on the meteorological drought index. Acta Geographica Sinica, 2019, 74(11), 2358–2370. https://doi.org/10.11821/dlxb201911012 (in Chinese with English abstract) |
[2, 12]
and Pearl River Basins
| [13] | Liang, M., Liu, B., Li, D. Optimization of identification index for drought-flood abrupt alternation events in the Pearl River Basin. Journal of Natural Disasters, 2022, 31(4), 57–64.
https://doi.org/10.13577/j.jnd.2022.0405 (in Chinese with English abstract) |
[13]
and has outperformed SPI and SPEI in identification effectiveness
| [13] | Liang, M., Liu, B., Li, D. Optimization of identification index for drought-flood abrupt alternation events in the Pearl River Basin. Journal of Natural Disasters, 2022, 31(4), 57–64.
https://doi.org/10.13577/j.jnd.2022.0405 (in Chinese with English abstract) |
[13]
. In addition, with the improvement of data availability and the demand for capturing rapid transitions, DFAA identification has gradually moved from monthly scales toward daily or finer scales
| [3] | Lu, Q., Tu, G., Yan, B., et al. Review and prospect of research progress on drought-flood abrupt alternation. Journal of Yangtze River Scientific Research Institute, 2026, 43(2), 111–119. https://doi.org/10.11988/ckyyb.20241276 (in Chinese with English abstract) |
| [10] | Tu, X., Pang, W., Chen, X., et al. Limitations and improvement of the traditional assessment index for drought-wetness abrupt alternation. Advances in Water Science, 2022, 33(4), 592–601. https://doi.org/10.14042/j.cnki.32.1309.2022.04.007 (in Chinese with English abstract) |
[3, 10]
, which better reflects the suddenness of drought-flood shifts.
In China, considerable research on DFAA has already been carried out at different spatiotemporal scales, with most studies focusing on its spatiotemporal evolution, driving forces, and the associated ecological and socio-economic impacts
| [7] | Su, J., Ding, Y., Liu, Y., et al. China is suffering from fewer but more severe drought to flood abrupt alternation events. Weather and Climate Extremes, 2024, 46, 100737.
https://doi.org/10.1016/j.wace.2024.100737 |
| [8] | Barendrecht, M. H., Matanó, A., Mendoza, H., et al. Exploring drought-to-flood interactions and dynamics: a global case review. WIREs Water, 2024, 11(4), e1726.
https://doi.org/10.1002/wat2.1726 |
[7, 8]
. DFAA is prevalent in the central and southeastern part of the country, the principal hotspots being the Huang-Huai-Hai River Basin, the middle and lower Yangtze River Basin, the southeastern coast, and southwestern China
| [7] | Su, J., Ding, Y., Liu, Y., et al. China is suffering from fewer but more severe drought to flood abrupt alternation events. Weather and Climate Extremes, 2024, 46, 100737.
https://doi.org/10.1016/j.wace.2024.100737 |
| [14] | Bi, W., Li, M., Weng, B., et al. Drought-flood abrupt alteration events over China. Science of the Total Environment, 2023, 875, 162529. https://doi.org/10.1016/j.scitotenv.2023.162529 |
[7, 14]
; a soil-moisture-based assessment additionally identified the Yunnan-Guizhou Plateau, the Northeast China Plain, and the northern arid and semi-arid region
| [5] | Zheng, S., Weng, B., Bi, W., et al. Significant increase and escalation of drought-flood abrupt alteration in China’s future. Agricultural Water Management, 2025, 312, 109449.
https://doi.org/10.1016/j.agwat.2025.109449 |
| [15] | Qiu, J., He, C., Liu, X., et al. Projecting dry-wet abrupt alternation across China from the perspective of soil moisture. npj Climate and Atmospheric Science, 2024, 7(1), 1–13.
https://doi.org/10.1038/s41612-024-00808-w |
[5, 15]
. Seasonality is regionally phased: June-September is nationally the most frequent and intense period
| [7] | Su, J., Ding, Y., Liu, Y., et al. China is suffering from fewer but more severe drought to flood abrupt alternation events. Weather and Climate Extremes, 2024, 46, 100737.
https://doi.org/10.1016/j.wace.2024.100737 |
[7]
, with July dominating in the Huang-Huai-Hai Basin (40.8% of the annual total), June-July in the middle and lower Yangtze
| [6] | Shan L., Zhang L., Song J., et al. Characteristics of dry-wet abrupt alternation events in the middle and lower reaches of the Yangtze River Basin and the relationship with ENSO. Journal of Geographical Sciences, 2018, 28(8), 1039–1058.
https://doi.org/10.1007/s11442-018-1540-7 |
[6]
and June and August on the southeastern coast
| [7] | Su, J., Ding, Y., Liu, Y., et al. China is suffering from fewer but more severe drought to flood abrupt alternation events. Weather and Climate Extremes, 2024, 46, 100737.
https://doi.org/10.1016/j.wace.2024.100737 |
[7]
. Trends are non-uniform: nationally events have become fewer but more severe; in the Huang-Huai-Hai Basin July frequency fell by 0.6 per decade while intensity rose by 0.8 per decade
| [7] | Su, J., Ding, Y., Liu, Y., et al. China is suffering from fewer but more severe drought to flood abrupt alternation events. Weather and Climate Extremes, 2024, 46, 100737.
https://doi.org/10.1016/j.wace.2024.100737 |
[7]
; coverage has expanded and drought-to-flood events have migrated northward
. Case studies in the Beijing-Tianjin-Hebei region, Hainan Island and Henan Province
| [16] | Men, B., Li, G., Lü, X., et al. Characterization and risk assessment of drought⁃flood abrupt alternation in Beijing⁃Tianjin⁃Hebei region of China. Acta Ecologica Sinica, 2025, 45(11), 1–12. https://doi.org/10.20103/i.stxb.202410152504 (in Chinese with English abstract) |
| [17] | Wang, X., Hua, X., Tian, F., et al. Study on the Spatiotemporal Variation Characteristics and Driving Forces of Drought–Flood Abrupt Alternation in Hainan Island from 1951 to 2020 [J]. Climatic and Environmental Research, 2025, 30(1), 1–14. https://doi.org/10.3878/j.issn.1006-9585.2024.23115 (in Chinese with English abstract) |
| [18] | Chu, C., Zhang, X., Zhou, J. Evolution characteristics of short-period drought-flood abrupt alternation events in Henan Province from 1960 to 2018. Research of Soil and Water Conservation, 2023, 30(4), 275–285.
https://doi.org/10.13869/j.cnki.rswc.2023.04.012 (in Chinese with English abstract) |
[16-18]
show similar heterogeneity; attribution studies invoke large-scale circulation such as El Niño-Southern Oscillation (ENSO)
| [6] | Shan L., Zhang L., Song J., et al. Characteristics of dry-wet abrupt alternation events in the middle and lower reaches of the Yangtze River Basin and the relationship with ENSO. Journal of Geographical Sciences, 2018, 28(8), 1039–1058.
https://doi.org/10.1007/s11442-018-1540-7 |
[6]
, relative humidity and near-surface temperature
, and precipitation, evapotranspiration and vegetation
| [19] | Bai, X., Wang, Z., Wu, J., et al. A novel multivariate multiscale index for drought-flood abrupt alternations: considering precipitation, evapotranspiration, and soil moisture. Journal of Hydrology, 2024, 643, 132039.
https://doi.org/10.1016/j.jhydrol.2024.132039 |
[19]
.
The Pearl River Delta (PRD) is one of China's most densely populated and economically developed urban agglomerations, where the East Asian summer monsoon, the pre-flood season and typhoon activity drive extreme precipitation variability; its most severe DFAA events occur frequently
| [7] | Su, J., Ding, Y., Liu, Y., et al. China is suffering from fewer but more severe drought to flood abrupt alternation events. Weather and Climate Extremes, 2024, 46, 100737.
https://doi.org/10.1016/j.wace.2024.100737 |
[7]
. Basin-scale studies have established the most suitable index
| [13] | Liang, M., Liu, B., Li, D. Optimization of identification index for drought-flood abrupt alternation events in the Pearl River Basin. Journal of Natural Disasters, 2022, 31(4), 57–64.
https://doi.org/10.13577/j.jnd.2022.0405 (in Chinese with English abstract) |
[13]
and characterized the seasonal and spatial patterns of the basin as a whole
| [19] | Bai, X., Wang, Z., Wu, J., et al. A novel multivariate multiscale index for drought-flood abrupt alternations: considering precipitation, evapotranspiration, and soil moisture. Journal of Hydrology, 2024, 643, 132039.
https://doi.org/10.1016/j.jhydrol.2024.132039 |
| [20] | Lai, C., Wang, Y., Zhao, Y., et al. A novel daily-scale index for detecting drought-flood abrupt alternation events: proof from Pearl River Basin, China. Atmospheric Research, 2025, 315, 107892. https://doi.org/10.1016/j.atmosres.2024.107892 |
[19, 20]
, but they resolve neither the fine structure of the delta nor the full set of event attributes, and stop short of the most recent decades. A long, internally consistent record of the frequency, probability, intensity, and duration of DFAA events across the PRD, and of their spatial distribution, is therefore lacking. Therefore, by using a long-term daily precipitation dataset, the SWAP model, and run theory, this study identifies DFAA events in the PRD, quantifies their inter-annual and seasonal trends, maps the spatial patterns of event frequency, probability, intensity, and duration, and discusses the implications for disaster prevention and water resources management in a rapidly urbanizing coastal delta.
2. Materials and Methods
2.1. Study Area
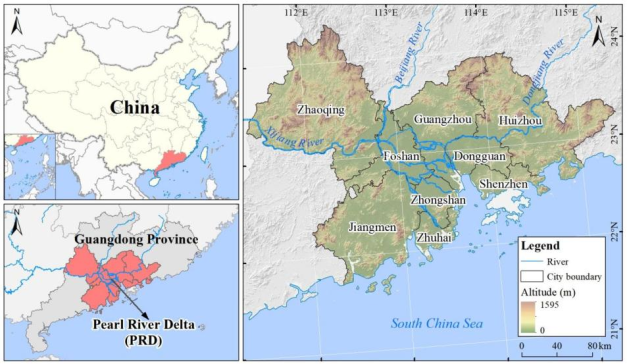
The PRD (21°17′36″-23°55′54″N, 111°59′42″-115°25′18″E) lies in the south-central part of Guangdong Province, at the estuary of the lower Pearl River Basin (PRB), and is one of the most important estuarine deltas on the southeast coast of China (
Figure 1). Administratively it comprises the entire territories of nine prefecture-level cities, i.e., Guangzhou, Shenzhen, Zhuhai, Foshan, Dongguan, Zhongshan, Jiangmen, Huizhou, and Zhaoqing. It covers a total land area of about 56,000 km
2, accounting for 31.5% of Guangdong Province, and is one of the regions of China with the highest population density, the highest level of urbanization and the most developed economy.
Figure 1. Geographic location of the study area.
The climate here belongs to the southern subtropical monsoon climate zone and is jointly affected by the East Asian summer monsoon, the western North Pacific subtropical high and typhoon activity, which gives it a distinctive climate: hot and rainy summers, mild and dry winters, a mean annual temperature of 22-23 °C and annual precipitation of 1500-2000 mm
| [20] | Lai, C., Wang, Y., Zhao, Y., et al. A novel daily-scale index for detecting drought-flood abrupt alternation events: proof from Pearl River Basin, China. Atmospheric Research, 2025, 315, 107892. https://doi.org/10.1016/j.atmosres.2024.107892 |
[20]
. Precipitation is highly uneven in space and time: more than 80% of it falls during the flood season from April to September; on average, three to four typhoons make landfall each year; and extreme heavy rainfall events occur frequently.
Topographically, the region is dominated by the PRD plain, with higher elevations in the northwest and lower ones in the southeast (
Figure 1). The northwest consists of low hills and the southeast is an alluvial plain crisscrossed by a dense river network; the density of this network ranks first in China, and water bodies account for more than 10% of the area. At the same time, the PRD is densely populated and industrially concentrated, with well-developed industry and agriculture and continuously expanding urban built-up areas. Its land surface is complex and highly sensitive to drought and flood hazards, and the vulnerability of the exposed receptors is high
| [11] | Lu, E. Determining the start, duration, and strength of flood and drought with daily precipitation: rationale. Geophysical Research Letters, 2009, 36(12): L12707.
https://doi.org/10.1029/2009GL038817 |
[11]
. DFAA events therefore readily pose a significant threat to regional agricultural production, water resource security and socioeconomic stability.
2.2. Data Sources and Processing
Calculation of the standardized weighted average precipitation (SWAP) index requires a continuous and complete daily precipitation series. The AgERA5 daily gridded precipitation dataset (https://cds.climate.copernicus.eu/) was therefore used as the data source. Released by the European Centre for Medium-Range Weather Forecasts (ECMWF), it covers the period 1979-2025, has a spatial resolution of 0.1°×0.1° and a daily temporal resolution, and provides daily accumulated precipitation (mm d
-1). Compared with conventional station-interpolated products, AgERA5 assimilates satellite remote sensing, ground observations, and numerical model information and has passed the operational quality-control procedures of ECMWF, effectively removing the data inhomogeneity caused by changes in the observing system
| [21] | Boogaard, H. and van der Grijn, G. Product User Guide and Specification, Data Stream 2: AgERA5 Historic and near Real Time Forcing Data. (2019). |
[21]
; it is therefore particularly suitable for constructing drought indices that require high spatiotemporal continuity. Compared with the traditional standardized precipitation index (SPI), the SWAP index introduces a decay weight for antecedent precipitation, allowing a finer characterization of the cumulative effect and the rapid transitions of drought and flood states, and it has proved better suited to DFAA identification in the PRB
| [12] | Yang, J., Chen, H., Hou, Y., et al. A method to identify the drought-flood transition based on the meteorological drought index. Acta Geographica Sinica, 2019, 74(11), 2358–2370. https://doi.org/10.11821/dlxb201911012 (in Chinese with English abstract) |
| [13] | Liang, M., Liu, B., Li, D. Optimization of identification index for drought-flood abrupt alternation events in the Pearl River Basin. Journal of Natural Disasters, 2022, 31(4), 57–64.
https://doi.org/10.13577/j.jnd.2022.0405 (in Chinese with English abstract) |
[12, 13]
.
In addition, the PRD referred to in this study is delineated by administrative boundaries. The city-level boundary data were obtained from the standard map service website of the Ministry of Natural Resources (https://www.tianditu.gov.cn/).
2.3. Methods
2.3.1. Standardized Weighted Average Precipitation (SWAP) Index
The SWAP index rests on the premise that the drought or flood state of a given day is affected both by the antecedent drought-flood state and by the precipitation of that day; it can therefore be used not only to measure the current meteorological drought-flood state but also to represent the cumulative effect of drought and flood
| [2] | Wang, L., Yuan, Z., Shi, X., et al. A driving force analysis method for drought-flood abrupt alternation events. Ecological Informatics, 2025, 90, 103214.
https://doi.org/10.1016/j.ecoinf.2025.103214 |
| [13] | Liang, M., Liu, B., Li, D. Optimization of identification index for drought-flood abrupt alternation events in the Pearl River Basin. Journal of Natural Disasters, 2022, 31(4), 57–64.
https://doi.org/10.13577/j.jnd.2022.0405 (in Chinese with English abstract) |
[2, 13]
. The SWAP is calculated by assuming that the weighted average precipitation (WAP) series for the same calendar day follows a Gamma distribution, fitting the WAP of a given period with the
Γ distribution, and finally standardizing the cumulative probability distribution to a normal distribution. The equations are as follows:
(1)
where WAP denotes the weighted average precipitation;
Pn is the precipitation on day
n;
wn is the weight of
Pn;
a is the decay parameter of the weight over time; and
N is the number of preceding days that affect precipitation. The values of
a and
N are generally determined by the local soil-water system of the study area; empirically,
a=0.9 and
N=14 are usually adopted
| [12] | Yang, J., Chen, H., Hou, Y., et al. A method to identify the drought-flood transition based on the meteorological drought index. Acta Geographica Sinica, 2019, 74(11), 2358–2370. https://doi.org/10.11821/dlxb201911012 (in Chinese with English abstract) |
| [13] | Liang, M., Liu, B., Li, D. Optimization of identification index for drought-flood abrupt alternation events in the Pearl River Basin. Journal of Natural Disasters, 2022, 31(4), 57–64.
https://doi.org/10.13577/j.jnd.2022.0405 (in Chinese with English abstract) |
[12, 13]
. A relatively large value of
a reduces the sensitivity of the SWAP to current precipitation, and
a=0.9 was chosen here to prevent the SWAP from fluctuating frequently in response to minor precipitation events. Because SPI, SPEI and SWAP follow the same standardization procedure, their values have the same statistical meaning
| [2] | Wang, L., Yuan, Z., Shi, X., et al. A driving force analysis method for drought-flood abrupt alternation events. Ecological Informatics, 2025, 90, 103214.
https://doi.org/10.1016/j.ecoinf.2025.103214 |
| [13] | Liang, M., Liu, B., Li, D. Optimization of identification index for drought-flood abrupt alternation events in the Pearl River Basin. Journal of Natural Disasters, 2022, 31(4), 57–64.
https://doi.org/10.13577/j.jnd.2022.0405 (in Chinese with English abstract) |
[2, 13]
. A uniform standardized cumulative frequency distribution was therefore used to classify drought and flood grades (
Table 1).
Table 1. Classification of drought and flood intensity based on the SWAP index.
Grade | Severity | SWAP value | Grade | Severity | SWAP value |
4 | Extreme flood | I ≥2.0 | -1 | Light drought | -1.0<I≤-0.5 |
3 | Severe flood | 1.5≤I<2.0 | -2 | Moderate drought | -1.5<I≤-1.0 |
2 | Moderate flood | 1.0≤I<1.5 | -3 | Severe drought | -2.0<I≤-1.5 |
1 | Light flood | 0.5≤I<1.0 | -4 | Extreme drought | I≤-2.0 |
0 | Normal | -0.5<I<0.5 | | | |
2.3.2. Identification of DFAA Events
Run theory (threshold theory) is a time-series analysis method that allows the various attributes of droughts and floods to be extracted easily
| [2] | Wang, L., Yuan, Z., Shi, X., et al. A driving force analysis method for drought-flood abrupt alternation events. Ecological Informatics, 2025, 90, 103214.
https://doi.org/10.1016/j.ecoinf.2025.103214 |
| [13] | Liang, M., Liu, B., Li, D. Optimization of identification index for drought-flood abrupt alternation events in the Pearl River Basin. Journal of Natural Disasters, 2022, 31(4), 57–64.
https://doi.org/10.13577/j.jnd.2022.0405 (in Chinese with English abstract) |
[2, 13]
. Following
Table 1, thresholds for identifying drought and flood events and the abrupt alternation process were set. The upper limit of the moderate drought grade, -1.0, was taken as the drought-event threshold
X0, and the lower limit of the moderate flood grade, 1.0, as the flood-event threshold
X1 . The minimum duration of a drought or flood event was set to 10 days (one 10-day period): a drought event is identified when the SWAP index remains below
X0 for at least 10 consecutive days, and a flood event when the index remains above
X1 for at least 10 consecutive days. The threshold for the interval between a drought state and a flood state was set to 8 days: if a drought event is followed by a flood event and the interval between them is no longer than 8 days, the process constitutes one complete DFAA event.
To avoid the influence of days with trace rainfall, an event-merging method was introduced to handle consecutive drought or flood events: adjacent drought events (or flood events) separated by only a short interval should be merged into a single event
| [12] | Yang, J., Chen, H., Hou, Y., et al. A method to identify the drought-flood transition based on the meteorological drought index. Acta Geographica Sinica, 2019, 74(11), 2358–2370. https://doi.org/10.11821/dlxb201911012 (in Chinese with English abstract) |
[12]
. Two conditions must both be satisfied for merging: (i) interval constraint, the interval between two consecutive drought events (or flood events), that is the difference between the start date of the later event and the end date of the earlier event, must not exceed 2 days; and (ii) intensity-ratio constraint, the ratio of the intensity exceeding
S within the interval between adjacent events to the event intensity
Sf of the preceding event must not exceed the critical value
Pc=0.2. The equation is as follows:
On the basis of the set of identified DFAA events, four core statistics were defined for the analysis of spatiotemporal characteristics: the frequency, probability, intensity, and duration of DFAA events. Frequency is the total number of DFAA events within the statistical period, including both drought-to-flood and flood-to-drought events. Probability expresses the frequency of occurrence as an annual probability, that is, the ratio (%) of the number of years in which DFAA events occurred (counted once regardless of how many events occurred in a year) to the total number of years. Intensity is the abrupt-alternation intensity of an entire DFAA event, that is, the ratio of the sum of the absolute SWAP values during a DFAA event to the length of the abrupt alternation period. The equations are as follows:
where
I is the event intensity,
D is the length of the abrupt alternation period, and SWAP
i is the SWAP index value on day
i of the abrupt alternation period. The natural breaks (Jenks) method was used to classify abrupt-alternation intensity into five grades to facilitate the subsequent analysis and description, i.e., low, relatively low, moderate, relatively high and high (
Table 2).
Table 2. Grading criteria for the intensity of DFAA event.
DFAA intensity grade | Range of I | DFAA intensity grade | Range of I |
Low | 0≤I<18 | Relatively high | 55≤I<74 |
Relatively low | 18≤I<36 | High | 74≤I<93 |
Moderate | 36≤I<55 | | |
The duration of a DFAA event is the total elapsed time of one complete DFAA event: for a drought-to-flood event, from the onset of drought to the end of flooding; for a flood-to-drought event, from the onset of flooding to the end of drought.
2.3.3. Sen's Slope Trend Analysis and the Mann-Kendall Test
Sen's slope trend analysis is a robust non-parametric statistical method suitable for time series containing outliers or missing values
. It evaluates the trend of a time series by computing the median slope of the data (the Theil-Sen median trend analysis), which makes it insensitive to outliers and extreme values and thus allows long-term trends to be captured more robustly. It is calculated as follows:
where β is the median slope of the series and xi and xj are the data values at the i-th and j-th time points of the series, respectively. A value of >0 indicates an upward trend in the data, whereas <0 indicates a downward trend.
The Mann-Kendall (MK) test is a non-parametric test for trends in time series. When testing the significance of trends in long time series, it requires neither a normal distribution of the measured values nor freedom from missing values and outliers
| [23] | Kendall, M. G. Rank Correlation Methods. Charles Griffin, London, 1970. |
[23]
. In this study the MK trend test was used to test the trend of the DFAA index, as follows. Given a series
xt, let the magnitude relationship between
xi and
xj be
S. The test statistic
Z is used for the trend test, and is calculated as follows:
(6)
In Equation (
6),
S is the test statistic and
Var(…) is the variance, calculated as follows:
(7)
In Equation (
7),
sgn (…) is the sign function, calculated as follows:
(9)
In the above equations, n is the number of data points in the series. When n≥8, the statistic S approximately follows a normal distribution. From the standard normal distribution table, the critical value at the 0.05 significance level is Z1-α/2, i.e. 1.96. When |Z| is less than or equal to 1.96, the series shows no significant trend; otherwise, it exhibits a clear trend (upward or downward).
3. Results
3.1. Spatiotemporal Variation of the SWAP
3.1.1. Temporal Variation of the SWAP
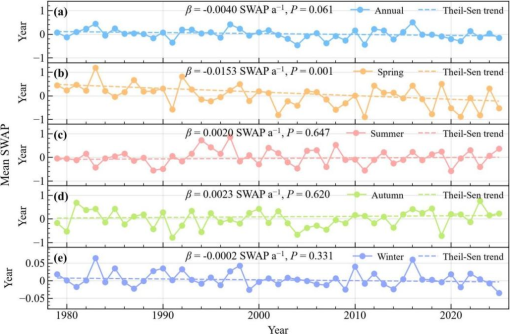
Figure 2 shows the inter-annual variation in the annual and seasonal mean SWAP over the PRD from 1979 to 2025. Each panel reports the Theil-Sen slope (
β, in SWAP a
-1) and its associated significance value (
P), with the dashed line representing the fitted trend. The annual series fluctuated around zero without any sustained dry or wet phase and declined slightly over the study period (
β=−0.0040 SWAP a
-1,
P=0.061), a change that did not reach the 5% significance level (
Figure 2a). The annual series exhibited pronounced inter-annual oscillations, with no persistently extreme high or low phases, indicating that DFAA events in the study area are manifested mainly as alternating wet-dry transitions at the inter-annual scale. The relatively high annual mean SWAP values occurred in 1983, 1997 and 2016, years in which DFAA events were relatively intense and the wet-dry transitions vigorous; the relatively low values were concentrated in 1991, 2004, 2007, 2011 and 2021, reflecting relatively gentle wet-dry transitions and weaker DFAA intensity in those years.
The changes of seasonal series differed markedly (
Figure 2b-e). Spring showed the largest and the only statistically significant trend, decreasing at 0.0153 SWAP a
-1 (
P=0.001), and this spring decline essentially determined the sign of the annual trend. Summer and autumn produced small positive slopes that were not statistically significant (
β=0.0020 SWAP a
-1,
P=0.647 and
β=0.0023 SWAP a
-1,
P=0.620, respectively), and winter was close to trendless (
β=−0.0002 SWAP a
-1,
P=0.331). Note that the ordinate of the winter panel spans only −0.05 to 0.05, far less than those of the other four panels; the amplitude of winter variation is therefore much smaller.
Figure 2. Inter-annual variation of seasonal SWAP in the PRD from 1979-2025.
3.1.2. Spatial Variation of the SWAP
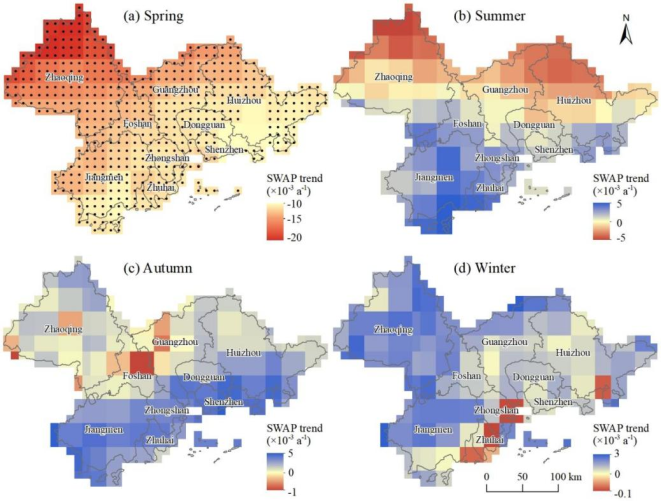
Figure 3 shows the spatial distribution of the seasonal trends in the SWAP over the PRD during the study period; the changes in the SWAP differed markedly among seasons. Spring is the season with the most pronounced SWAP trend in the PRD: over most of the region the SWAP trend was negative, with change rates generally below -0.01 SWAP a
-1, and the great majority of grid cells passed the significance test at the 95% confidence level (
Figure 3a). Spatially, the decrease was most pronounced in the northwest (Zhaoqing), where trend values reached -0.02 to -0.015 SWAP a
-1, showing marked aridification and a continuously deepening DFAA intensity; the trends in the central-eastern and southern coastal areas were somewhat smaller but still significantly negative. This indicates that in spring, the intensity of DFAA events increased significantly throughout the PRD, and that the DFAA risk has continued to rise against a background of aridification.
In summer, the spatial pattern of the SWAP trend showed a clear north-south contrast (
Figure 3b). The northern part was dominated by weak negative trends, with change rates between -0.005 SWAP a
-1 and 0, indicating a tendency towards drought; the southern part was dominated by positive trends, with change rates between 0 and 0.005 SWAP a
-1, indicating a tendency towards flooding. Overall, the SWAP change rates of all grid cells in summer fell between -0.005 and 0.005 SWAP a
-1, but none of the trends was significant, indicating that DFAA in the PRD has no marked long-term trend in summer.
Figure 3. Spatial distribution of the seasonal trends of SWAP over the PRD from 1979-2025.
In autumn, the spatial distribution of the SWAP trend showed a pattern of positive trends in the south and weak trends in the north (
Figure 3c). The southern coastal area was dominated by significant positive trends, with change rates between 0 and 0.005 SWAP a
-1, representing a tendency towards flooding there in autumn, whereas the trends in the northern area were weak and showed no clear bias towards drought or flood. No grid cell passed the significance test in autumn either, indicating that autumn DFAA characteristics likewise show no statistically significant trend.
In winter, the spatial distribution of the SWAP trend consisted mainly of weak positive trends over the whole region (
Figure 3d), with only sporadic weak negative trends along the southern coast; the change rates over the region ranged from -0.0001 to 0.003 SWAP a
-1, far smaller in magnitude than in spring. Again, no grid cell passed the significance test in winter, indicating that DFAA events in the PRD have no significant long-term trend in winter and that their characteristics are relatively stable.
3.2. Spatiotemporal Distribution of DFAA Events in the PRD
3.2.1. Temporal Characteristics of DFAA Events
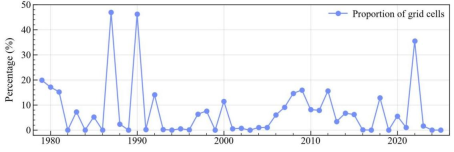
Figure 4 shows the inter-annual variation in the proportion of grid cells affected by DFAA events in the PRD from 1979 to 2025. Over the study period this proportion averaged 7.55%, with marked inter-annual differences. The years 1987 and 1990 were the peak years with proportions of 47.0% and 46.3%, respectively, indicating that DFAA in the two years had the widest impact and the greatest severity; they were followed by 2022, with 35.50%, the most prominent year for DFAA in the last decade. At the same time, no obvious DFAA events were detected in a number of years, mainly 1982-1986, 1993-1996, 2001-2005, and 2023-2025, indicating that precipitation processes in those years were relatively stable and the wet-dry transitions weak. In addition, the proportion exceeded 10% in 1979-1981, 1992, 2000, 2008-2009, 2012 and 2017. The period 2006-2015 was one of moderate, fluctuating activity, showing a clear intermittent pattern of high occurrence. These results reflect the large inter-annual variability and pronounced episodicity of DFAA events in the PRD, and an overall tendency towards greater activity after the beginning of the 21st century.
Figure 4. Inter-annual variation in the proportion of grid cells experiencing DFAA events in the PRD from 1979 to 2025.
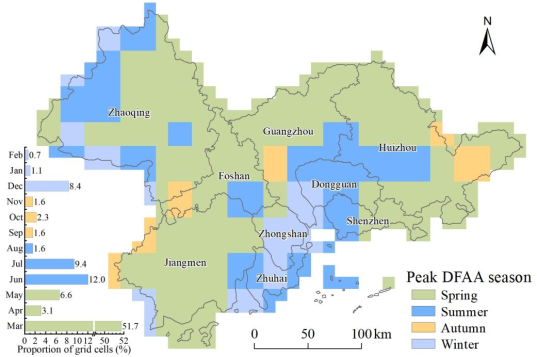
Figure 5 illustrates the spatial differentiation and seasonal distribution of peak DFAA events across the PRD from 1979 to 2025. Seasonally, spring is the most dominant high-incidence period, covering over half of the region (accounting for 61.4% of total grid cells collectively), with March exhibiting an absolute peak at 51.7%. Spatially, spring-dominated events are continuously distributed across the northern, central, and eastern parts of the PRD. This widespread coverage is closely linked to the frequent convergence of cold and warm air masses during the pre-flood season, where unstable atmospheric circulation and high precipitation variability render rapid drought-to-flood transitions highly probable. Summer represents a secondary high-incidence season, primarily driven by June (12.0%) and July (9.4%), with affected grid cells scattered across Zhaoqing, Huizhou, Dongguan, and Zhuhai. These summer occurrences are mainly attributed to frontal precipitation during the early pre-flood season, followed by tropical cyclones, local strong convection, and monsoon variations during the post-flood period
| [24] | Zhou, X., Li, Y., Xiao, C., et al. High-impact extreme weather and climate events in China: summer 2024 overview. Advances in Atmospheric Sciences, 2025, 42(6), 1064–1076.
https://doi.org/10.1007/s00376-024-4462-6 |
[24]
. Notably, winter exhibits a secondary peak in December (8.4%), primarily concentrated along the western and northwestern margins, which can be explained by circulation anomalies during the early stage of the winter monsoon and brief cold-warm air encounters. In contrast, autumn features the lowest frequency (totaling less than 6%), appearing only sporadically due to the stable control of the subtropical high with only occasional interference from remnant typhoon circulations and weak cold surges.
Figure 5. Temporal distribution of DFAA events in the PRD from 1979-2025.
3.2.2. Spatial Distribution of the Statistical Characteristics of DFAA Events
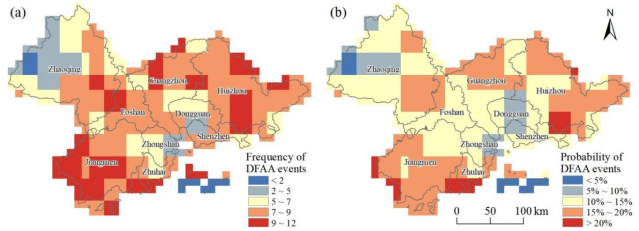
Figure 6 shows the spatial distribution of the frequency and the probability of DFAA events in the PRD from 1979 to 2025. The two are highly coupled in space, being generally low in the northwest, around the Pearl River Estuary and on the islands, and relatively high elsewhere.
The frequency of DFAA shows a clear spatial differentiation (
Figure 6a). High-value areas (9-12 events) are concentrated in central and western Jiangmen and its southern islands, the southern coast of Zhuhai, central and northern Huizhou, and parts of Zhaoqing, Foshan, and Guangzhou; they coincide almost entirely with the high-probability areas and constitute the most DFAA-prone parts of the study area. Sub-high-value areas (7-9 events) cover most of Guangzhou, Foshan, Huizhou, Zhaoqing, and Jiangmen, together with the central plains of Zhongshan and northern Zhuhai, where the frequencies are moderately high. Median areas (5-7 events) occur mainly in transitional zones such as Dongguan, Zhongshan, and northern Zhaoqing, showing a gradient that decreases gradually from the coast inland. Low-value areas (0-4 events) are concentrated in the mountains of western Zhaoqing and on the islands outside the Pearl River Estuary, where the frequency is generally below 2, making them the low-frequency DFAA zones of the study area.
The spatial distribution of the occurrence probability of DFAA events (
Figure 6b) resembles that of their frequency. High-probability areas (20%-25%) are concentrated in western Jiangmen, the southern coast of Zhuhai, and southern Huizhou, which are the areas at greatest risk of DFAA; influenced jointly by the South China Sea monsoon, typhoon activity, and the pre-flood season in South China, these areas have extremely high spatiotemporal precipitation variability and frequent rapid transitions between drought and flood. Sub-high-probability areas (15%-20%) are widely distributed in Guangzhou, Zhaoqing, Jiangmen, and Huizhou, where the DFAA probability is moderately high. Medium-probability areas (10%-15%) occur mainly in land-sea transitional zones such as Zhaoqing, Foshan, northern Jiangmen, southern Guangzhou, parts of Dongguan, western Zhongshan, Shenzhen, and Huizhou; shielded by the mountains to the north and dissected by the dense river network in the center, precipitation variability is somewhat reduced there, forming a clear transitional zone. Low-probability areas (0%-10%) are concentrated in the mountains of western Zhaoqing, northern Shenzhen, and the Pearl River Estuary and its offshore islands. In northwestern Zhaoqing, blocked by the Nanling Mountains, moisture transport weakens and precipitation processes are stable, giving the lowest DFAA probability; the island areas are constrained by local circulation and have low precipitation variability, and likewise belong to the low-probability zone.
Figure 6. Spatial distribution of the frequency (a) and the probability (b) of DFAA events in the PRD from 1979-2025.
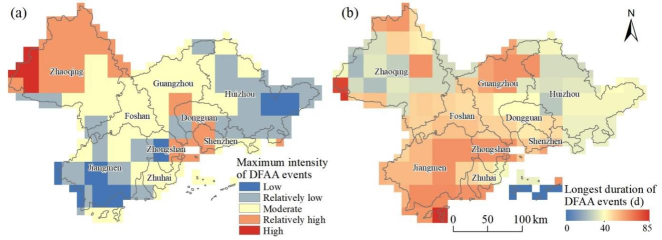
Figure 7a shows the spatial distribution of DFAA event intensity during the study period, which is high in the southwest and southeast and low in the northwest. Low-intensity areas occur only sporadically in northwestern Zhaoqing, the least intense part of the study area. Relatively low-intensity areas are concentrated over most of Zhaoqing, eastern Zhongshan, western Shenzhen, and parts of the border area between southern Guangzhou and Dongguan. Moderate-intensity areas form the most extensive class in the study area, covering large parts of Foshan, Guangzhou, Zhuhai, and parts of Dongguan, Jiangmen, Zhongshan, and Shenzhen. Relatively high-intensity areas are scattered across Zhaoqing, Foshan, Jiangmen, and Huizhou. High-intensity areas are concentrated in patches along the southwestern coast and in the central-west of Jiangmen, in central Zhongshan, and in parts of eastern Huizhou; these form the core zone of the most intense drought-flood transitions in the study area.
Figure 7. Spatial distribution of the maximum intensity (a) and the longest duration (b) of DFAA events in the PRD from 1979-2025.
Figure 7b shows the spatial distribution of the longest duration of DFAA events during the study period. Overall, the spatial pattern of the longest DFAA duration shows a decreasing trend from south to north, with some local abnormal highs and a very clear correspondence between high-value and low-value centres. Southwestern Jiangmen, Zhuhai, and central Zhongshan are the main centres of long-duration DFAA events. In most grid cells of this area the duration is between 60 and 85 days, reaching a maximum of 85 days in western Zhaoqing and on the islands of southern Jiangmen, which reflects longer and more persistent DFAA events there, in which the rapid switching between drought and flood states appears more continuous and stable in time. In contrast, Huizhou in the northeast, the northern margin and the south of Guangzhou, and central Zhaoqing are low-value areas for DFAA duration.
In most grid cells of the study area, the longest DFAA duration falls within the range of 20-45 days, and in some areas, it is even shorter than 20 days. This indicates that DFAA events in these places last for a relatively short time and take the form of a drought-flood transition completed rapidly over a short period, the whole event being briefer and more concentrated. In addition, Foshan and the central and southern parts of Guangzhou show a transitional spatial pattern, with DFAA durations of roughly 45-60 days and gentle spatial gradients. This reflects an overall continuous gradient in the duration of DFAA events across the PRD, decreasing progressively from high values in the southwest to low values in the northeast.
The frequency, probability, intensity, and duration of DFAA events in the PRD show a highly consistent spatial pattern, characterized by high values in the southwest and low values in the northeast. The high-value areas are concentrated mainly in coastal zones such as southwestern Jiangmen and western Zhuhai, whereas the low-value areas lie in the mountains of northern Zhaoqing and on the islands beyond the Pearl River Estuary. This close spatial coupling indicates that the activity of the South China Sea monsoon, the frequency and tracks of typhoons, and the evolution of precipitation during the pre-flood season in South China together constitute the dominant factors controlling the level of DFAA risk in the region. At the same time, the topographic barrier formed by the mountains to the north, together with the moderating effect of local circulation systems, substantially reduces the DFAA risk faced by the inland hinterland and the island areas. Disaster prevention and mitigation strategies based on DFAA event identification should therefore focus on the southwestern coastal urban agglomeration.
4. Discussion
4.1. Spatiotemporal Characteristics of DFAA Events
The annual mean SWAP declined only weakly over 1979-2025, and the Mann-Kendall test could not separate that decline from inter-annual variability. The seasonal decomposition shows that the trend is essentially a spring phenomenon: spring SWAP decreased significantly and set the sign of the annual series, whereas summer and autumn were marginally wetter and winter was trendless. Significant spring drying covered most of the delta, reaching the largest in the northwest, and no grid cell was significant in the other three seasons.
This seasonality departs from the national pattern. Across China, DFAA is predominantly a summer phenomenon, with roughly 85% of events occurring then
and a June-September peak in frequency and intensity
| [7] | Su, J., Ding, Y., Liu, Y., et al. China is suffering from fewer but more severe drought to flood abrupt alternation events. Weather and Climate Extremes, 2024, 46, 100737.
https://doi.org/10.1016/j.wace.2024.100737 |
[7]
. In the PRD, spring accounts for the peak event in 61.4% of grid cells (51.7% in March alone), summer is secondary, December forms a secondary peak (8.4%) and autumn is the least active (below 6%). Basin-scale studies support our findings, which reported the most severe DFAA in the PRD in April and May
| [7] | Su, J., Ding, Y., Liu, Y., et al. China is suffering from fewer but more severe drought to flood abrupt alternation events. Weather and Climate Extremes, 2024, 46, 100737.
https://doi.org/10.1016/j.wace.2024.100737 |
[7]
and drought-to-flood events peaking in spring and winter in the PRB
| [19] | Bai, X., Wang, Z., Wu, J., et al. A novel multivariate multiscale index for drought-flood abrupt alternations: considering precipitation, evapotranspiration, and soil moisture. Journal of Hydrology, 2024, 643, 132039.
https://doi.org/10.1016/j.jhydrol.2024.132039 |
[19]
. These patterns are controlled by the regional rainfall regime: the pre-flood season, frontal in origin and the first wet phase after the winter dry season, varies strongly on interannual to interdecadal scales in association with Pacific sea surface temperatures
| [25] | Yao, S., Huang, Q. and Zhao, C. Variation characteristics of rainfall in the pre-flood season of south China and its correlation with sea surface temperature of Pacific. Atmosphere, 2016, 7(1), 5. https://doi.org/10.3390/atmos7010005 |
[25]
. Because SWAP is precipitation-based, this decline originates in rainfall rather than in evaporative demand.
The four event attributes were spatially coupled, indicating that common controls act across the whole event life cycle rather than on individual attributes. Frequency, probability, intensity, and duration were highest along the urbanized coast, southwestern Jiangmen, western Zhuhai, central Zhongshan, and Huizhou, and lowest in the mountains of northern Zhaoqing and on the offshore islands, with durations declining from 60-85 days in the southwest to 20-45 days or less elsewhere. This matches the basin-scale pattern, in which PRB events were mainly located in the west, east, and south
| [20] | Lai, C., Wang, Y., Zhao, Y., et al. A novel daily-scale index for detecting drought-flood abrupt alternation events: proof from Pearl River Basin, China. Atmospheric Research, 2025, 315, 107892. https://doi.org/10.1016/j.atmosres.2024.107892 |
[20]
. Urbanization may reinforce the coastal maximum, as its contribution to extreme precipitation over the Greater Bay Area is distinguishable from large-scale climate change
| [26] | Deng, Z., Wang, Z., Wu, X., et al. Effect difference of climate change and urbanization on extreme precipitation over the Guangdong-Hong Kong-Macao Greater Bay area. Atmospheric Research, 2023, 282, 106514.
https://doi.org/10.1016/j.atmosres.2022.106514 |
[26]
, and it modifies hourly intense precipitation over the PRD before and after monsoon onset
| [27] | Yang, T., Lu, X., Xiang, K., et al. Variation characteristics and the influences of urbanization on hourly intense precipitation before and after monsoon onset over the Pearl River Delta. Scientific Reports, 2024, 14(1), 26864.
https://doi.org/10.1038/s41598-024-78574-1 |
[27]
. Impervious surfaces shorten the rainfall-to-runoff lag, while urban heat depletes soil moisture faster during dry spells, sharpening both ends of the alternation.
4.2. Implications for DFAA Monitoring and Water Resources Management
The results reported above imply that DFAA in the PRD is a spring hazard with a coastal signature, whereas regional preparedness is organized around the summer flood season. Because roughly three-fifths of grid cells peak in spring, a monitoring calendar indexed to the typhoon season would miss most events.
For urban drainage and water-supply resilience, the operative finding is that the high-value belt coincides with the most urbanized corridor of the delta. Drainage design storms are conventionally specified from extreme rainfall statistics and an assumed imperviousness, and summer rainfall dominates those statistics. Our results suggest that the design load should instead be defined by the DFAA sequence, namely a prolonged spring dry spell followed by heavy rainfall, because the first substantial storm after a dry spell is not hydrologically equivalent to the same storm on a wet catchment. Where spring drying is intensifying, the drought leg of that sequence is lengthening, so sizing blue-green infrastructure on summer rainfall alone risks under-designing the spring transition. Supply-side planning faces the mirror-image problem: spring follows the winter dry season, when storage is near its seasonal minimum, so the deficit-to-excess switch occurs with the least buffering of the year.
For agriculture, the same window matters because DFAA damage is compounded rather than additive
| [8] | Barendrecht, M. H., Matanó, A., Mendoza, H., et al. Exploring drought-to-flood interactions and dynamics: a global case review. WIREs Water, 2024, 11(4), e1726.
https://doi.org/10.1002/wat2.1726 |
[8]
and vegetation responses depend on the sequence of drought and flood
| [9] | Xie, L., Li, Y., Zhang, Z., et al. Exploring the combined effects of drought and drought-flood abrupt alternation on vegetation using interpretable machine learning model and r-vine copula function. Agricultural and Forest Meteorology, 2025, 370, 110568. https://doi.org/10.1016/j.agrformet.2025.110568 |
[9]
. Scheduling rules fixed to a seasonal quota cannot accommodate a reversal within one season. Short-cycle, reversible allocation that alternates between supplemental irrigation and drainage within weeks and withholds reservoir releases when a transition is forecast would be more appropriate than a static seasonal plan. If DFAA frequency, intensity, and coverage continue to increase in China as projected
| [5] | Zheng, S., Weng, B., Bi, W., et al. Significant increase and escalation of drought-flood abrupt alteration in China’s future. Agricultural Water Management, 2025, 312, 109449.
https://doi.org/10.1016/j.agwat.2025.109449 |
[5]
, these design margins will tighten.
4.3. Uncertainties and Limitations
Several constraints bound these results. This study pooled drought-to-flood and flood-to-drought events, although their drivers differ; in the PRB, drought-to-flood events are governed mainly by precipitation, whereas flood-to-drought events also respond to evapotranspiration
| [19] | Bai, X., Wang, Z., Wu, J., et al. A novel multivariate multiscale index for drought-flood abrupt alternations: considering precipitation, evapotranspiration, and soil moisture. Journal of Hydrology, 2024, 643, 132039.
https://doi.org/10.1016/j.jhydrol.2024.132039 |
[19]
. Pooling may conceal opposing seasonal trends, and separate identification of the two types is the most obvious next step.
In identifying DFAA, SWAP, a precipitation-only index, is computed from precipitation alone, so these results describe meteorological rather than agricultural or hydrological alternation. Where the water balance rather than rainfall is limiting, a precipitation-only index can misrepresent both the timing and the severity of events. Multi-variable indices such as the MSDFI
| [19] | Bai, X., Wang, Z., Wu, J., et al. A novel multivariate multiscale index for drought-flood abrupt alternations: considering precipitation, evapotranspiration, and soil moisture. Journal of Hydrology, 2024, 643, 132039.
https://doi.org/10.1016/j.jhydrol.2024.132039 |
[19]
and soil-moisture-based frameworks
| [15] | Qiu, J., He, C., Liu, X., et al. Projecting dry-wet abrupt alternation across China from the perspective of soil moisture. npj Climate and Atmospheric Science, 2024, 7(1), 1–13.
https://doi.org/10.1038/s41612-024-00808-w |
[15]
exist for this reason; the diversity of definitions and thresholds still limits comparison between regions
| [4] | Qiao, Y., Xu, W., Meng, C., et al. Review of study on dry wet abrupt alternation: progress and challenge. Journal of Catastrophology, 2023, 38(3), 131–138.
https://doi.org/10.3969/j.issn.1000-811X.2023.03.021 (in Chinese with English abstract) |
| [10] | Tu, X., Pang, W., Chen, X., et al. Limitations and improvement of the traditional assessment index for drought-wetness abrupt alternation. Advances in Water Science, 2022, 33(4), 592–601. https://doi.org/10.14042/j.cnki.32.1309.2022.04.007 (in Chinese with English abstract) |
[4, 10]
. Besides, the memory parameter (a=0.9) and antecedent window (N=14 days) were adopted from the PRB index-optimization study
| [13] | Liang, M., Liu, B., Li, D. Optimization of identification index for drought-flood abrupt alternation events in the Pearl River Basin. Journal of Natural Disasters, 2022, 31(4), 57–64.
https://doi.org/10.13577/j.jnd.2022.0405 (in Chinese with English abstract) |
[13]
rather than re-estimated for the delta, and the duration and interval thresholds are conventional rather than calibrated. Other defensible choices would change the event counts, so the values reported here are conditional on this configuration. The precipitation input was also used without validation against local gauges; reanalysis products can be systematically biased in coastal and mountainous terrain
| [21] | Boogaard, H. and van der Grijn, G. Product User Guide and Specification, Data Stream 2: AgERA5 Historic and near Real Time Forcing Data. (2019). |
[21]
.
Finally, this study focuses on the spatial and temporal patterns of DFAA, and future work will extend the analysis to its underlying drivers. In particular, it would be valuable to examine whether DFAA is linked to the Pacific sea surface temperature anomalies that modulate pre-flood rainfall over South China
| [25] | Yao, S., Huang, Q. and Zhao, C. Variation characteristics of rainfall in the pre-flood season of south China and its correlation with sea surface temperature of Pacific. Atmosphere, 2016, 7(1), 5. https://doi.org/10.3390/atmos7010005 |
[25]
, to the timing of South China Sea monsoon onset, or to regional urbanization
| [26] | Deng, Z., Wang, Z., Wu, X., et al. Effect difference of climate change and urbanization on extreme precipitation over the Guangdong-Hong Kong-Macao Greater Bay area. Atmospheric Research, 2023, 282, 106514.
https://doi.org/10.1016/j.atmosres.2022.106514 |
| [27] | Yang, T., Lu, X., Xiang, K., et al. Variation characteristics and the influences of urbanization on hourly intense precipitation before and after monsoon onset over the Pearl River Delta. Scientific Reports, 2024, 14(1), 26864.
https://doi.org/10.1038/s41598-024-78574-1 |
[26, 27]
. El Niño-Southern Oscillation has been linked to DFAA in the middle and lower Yangtze
| [6] | Shan L., Zhang L., Song J., et al. Characteristics of dry-wet abrupt alternation events in the middle and lower reaches of the Yangtze River Basin and the relationship with ENSO. Journal of Geographical Sciences, 2018, 28(8), 1039–1058.
https://doi.org/10.1007/s11442-018-1540-7 |
[6]
, and causal-inference frameworks suited to such drivers are available
| [1] | Cui, H., Jiang, S., Ren, L., et al. Identification of drought-flood abrupt alternation by a new non-stationary framework considering natural-social system impacts. Journal of Hydrology, 2025, 654, 132899.
https://doi.org/10.1016/j.jhydrol.2025.132899 |
| [2] | Wang, L., Yuan, Z., Shi, X., et al. A driving force analysis method for drought-flood abrupt alternation events. Ecological Informatics, 2025, 90, 103214.
https://doi.org/10.1016/j.ecoinf.2025.103214 |
[1, 2]
.
5. Conclusions
Using the AgERA5 daily precipitation dataset for 1979-2025, the Standardized Weighted Average Precipitation (SWAP) index, and run theory, we characterized the spatiotemporal evolution of DFAA in the Pearl River Delta (PRD). The main findings are as follows:
1) The annual mean SWAP declined weakly but not significantly (β=−0.0040 SWAP a-1, P=0.061), and the decline was essentially a spring signal, which decreased significantly (β=−0.0153 SWAP a-1, P=0.001) and determined the sign of the annual series, whereas no other season showed a significant trend. Significant spring drying covered most of the delta, steepest in the northwest.
2) DFAA events affected 7.55% of grid cells in an average year. Spring dominated the event season (61.4% of grid cells, 51.7% in March alone), followed by summer and a secondary December peak (8.4%), with autumn being the least active (below 6%), a spring-centred regime that differs from the summer-dominated national pattern.
3) Frequency, probability, intensity and duration were spatially coupled and all peaked along the urbanized coast (southwestern Jiangmen, western Zhuhai, central Zhongshan and Huizhou) and were lowest in northern Zhaoqing and on the offshore islands; duration declined from south to north, with the longest episodes (60-85 days) in the southwest.
DFAA in the PRD is therefore a spring, pre-flood-season hazard with a coastal signature rather than a summer typhoon-season hazard; monitoring and water-management schedules indexed to the flood season would miss most events.





 Share This Article
 Twitter
 Linked In
 Facebook

 Copy
 Download