Abstract
Background: Malaria remains a major public health challenge in Uganda, particularly among children under five years of age. Between 2019 and 2023, the prevalence increased with age, from 3% in infants under six months to 12% in children aged 48–59 months, and was markedly higher in rural areas (11%) than in urban areas (3%). However, analysis of the data on malaria has been focused on a single variable, while the impact of climate variation on malaria is over several factors and over time. This study assesses the temporal patterns of climate variability and malaria incidence among children aged 0–5 years in Uganda using a time series analysis. Methods: The study analysed 150 monthly time series records from 2015 to 2022. It used the Vector Error Correction Model (VECM), which allows examination of both short-term changes and long-term relationships among variables. The variables included confirmed malaria cases in children under five years, rainfall, minimum and maximum temperatures, and vegetation cover. Data were obtained from the Ministry of Health/DHIS2, NASA Earth Data, CHIRPS, and NASA EOSDIS. Results: The results revealed significant long-term relationships and short-term feedback mechanisms between malaria incidence and climatic factors. The error correction term (ECT) for malaria was -0.006, indicating a slow adjustment to equilibrium. In contrast, rainfall, minimum temperature, and the Normalized Difference Vegetation Index (NDVI) showed correction behaviours, adjusting upward following deviations. Short-term changing aspects revealed that previous values of malaria cases among children under five years (coefficient = 0.091) and rainfall (coefficient = 0.061) positively influenced current malaria trends. The minimum temperature displayed strong autocorrelation (coefficient = 0.810), whereas the NDVI showed a large short-term response (coefficient = 140.100), highlighting its sensitivity to environmental shifts. Maximum temperature had a negative short-term association with malaria incidences (coefficient = -0.259), suggesting inverse seasonal effects. Conclusions: The study reveals significant short-term and long-term interactions among malaria cases among children under five years, rainfall, temperature, and NDVI. The presence of statistically significant error correction terms indicates that the system adjusts to restore equilibrium following deviations, with malaria cases among children under five years exhibiting consistent correction. Lagged coefficients show that past changes, particularly in minimum temperature and NDVI, exert a strong influence on current conditions.
|
Published in
|
Ecology and Evolutionary Biology (Volume 11, Issue 3)
|
|
DOI
|
10.11648/j.eeb.20261103.13
|
|
Page(s)
|
62-78 |
|
Creative Commons
|

This is an Open Access article, distributed under the terms of the Creative Commons Attribution 4.0 International License (http://creativecommons.org/licenses/by/4.0/), which permits unrestricted use, distribution and reproduction in any medium or format, provided the original work is properly cited.
|
|
Copyright
|
Copyright © The Author(s), 2026. Published by Science Publishing Group
|
Keywords
Malaria Incidence, Climate Variability, NDVI, Children Under Five, VECM, Time Series Analysis, Public Health Planning
1. Introduction
Malaria remains a public health concern worldwide, with nearly half of the world’s population at risk. In 2022 alone, an estimated 249 million people contracted malaria across 85 countries
| [1] | Thellier M, Gemegah AAJ, Tantaoui I. Global fight against malaria: goals and achievements 1900–2022. J Clin Med. 2024; 13: 5680. https://doi.org/10.3390/jcm13195680 |
| [2] | World Malaria Report. 2021. |
[1, 2]
. Approximately 608,000 malaria-related deaths were recorded that same year
| [3] | Sugiarto SR. A study of pharmacokinetic properties of artemisinin combination therapy for malaria in specific populations. 2023. |
[3]
. It is apparent that the tropical region, especially Africa and Asia, shoulders much of the burden
. Particularly in sub-Saharan Africa, which accounted for 93% of all malaria deaths globally in 2022
| [5] | Lukindu M. Molecular Tools and Genetic Approaches for Studying the Genetic Structure of Major Malaria Vectors in Sub-Saharan Africa. University of Notre Dame; 2020. |
[5]
. In 2020, the region was home to 95% of all malaria cases among children under five years and 96% of malaria-related deaths. Children under five years of age remain the most vulnerable, accounting for nearly 80% of these deaths
| [6] | Abdishu M, Gobena T, Damena M, Abdi H, Birhanu A. Determinants of Malaria Morbidity Among School-Aged Children Living in East Hararghe Zone, Oromia, Ethiopia: A Community-Based Case–Control Study. Pediatr Heal Med Ther. 2022; Volume 13: 183–93.
https://doi.org/10.2147/PHMT.S347621 |
[6]
. Spatial disparities are evident within the region. The four African countries of Nigeria, the Democratic Republic of Congo (DRC), Tanzania, and Mozambique together accounted for over half of the global malaria deaths
| [7] | Debash H, Alemayehu E, Belete MA, Ebrahim H, Mohammed O, Gebretsadik D, et al. Prevalence and associated factors of malaria among the displaced population in refugee camps in Africa: a systematic review and meta-analysis. Malar J. 2025; 24: 15.
https://doi.org/10.1186/s12936-025-05246-4 |
[7]
, highlighting the uneven disease distribution. In contrast, countries such as Burundi and Swaziland accounted for less than 1% according to a study done in the Democratic Republic of Congo
| [8] | Panzi EK, Okenge LN, Kabali EH, Tshimungu F, Dilu AK, Mulangu F, et al. Geo-climatic factors of malaria morbidity in the Democratic Republic of Congo from 2001 to 2019. Int J Environ Res Public Health. 2022; 19: 3811.
https://doi.org/10.3390/ijerph19073811 |
[8]
. Notably, 96% of malaria-related deaths in the region occurred in children under five years of age
| [9] | Sarfo JO, Amoadu M, Kordorwu PY, Adams AK, Gyan TB, Osman A-G, et al. Malaria amongst children under five in sub-Saharan Africa: a scoping review of prevalence, risk factors and preventive interventions. Eur J Med Res. 2023; 28: 80.
https://doi.org/10.1186/s40001-023-01046-1 |
[9]
.
Uganda remains one of the countries with the highest malaria burden. It ranks third in Africa and sixth globally in terms of malaria-related mortality, reporting more than 16 million cases and more than 10,000 deaths annually
| [10] | Kooko R, Wafula ST, Orishaba P. Socioeconomic determinants of malaria prevalence among under five children in Uganda: Evidence from 2018-19 Uganda Malaria Indicator Survey. J Vector Borne Dis. 2023; 60: 38–48.
https://doi.org/10.4103/0972-9062.353251 |
[10]
. The country’s tropical climate, with relatively stable temperatures and frequent rainfall, supports year-round malaria transmission, particularly in lowland and rural areas. Approximately 95% of the population lives in malaria-endemic zones, with transmission risks varying by region
| [11] | Longo-Pendy N-M, Sevidzem SL, Makanga BK, Ndotit-Manguiengha S, Boussougou-Sambe ST, Obame Ondo Kutomy P, et al. Assessment of environmental and spatial factors influencing the establishment of Anopheles gambiae larval habitats in the malaria endemic province of Woleu-Ntem, northern Gabon. Malar J. 2024; 23: 158.
https://doi.org/10.1186/s12936-024-04980-5 |
[11]
. According to the Uganda Malaria Indicator Survey (2018–2019), 9% of children under five tested positive for malaria parasites
| [12] | Ahmed A. An estimation of Severe Malaria prevalence in Children aged 0-59 months in Uganda: A Secondary Analysis of Uganda’s Malaria Indicator Survey 2019. 2021. |
[12]
. The prevalence increased with age, from 3% in infants under six months to 12% in children aged 48–59 months, and was markedly higher in rural (11%) than in urban (3%) settings. Regionally, Karamoja had the highest prevalence (34%), followed by West Nile (22%) and Busoga (21%), whereas areas such as Kampala and Kigezi reported less than 1% prevalence
| [13] | Zalwango MG, Bulage L, Zalwango JF, Migisha R, Agaba BB, Kadobera D, et al. Trends and Distribution of Severe Malaria Cases, Uganda, 2017–2021: Analysis of Health Management Information System Data. Uganda Natl Inst Public Heal Q Epidemiol Bull. 2023; 8: 2. |
[13]
. These disparities are partly accounted for by variability in the patterns of weather factors, which have a direct impact on the survivorship, longevity, and distribution of
Anopheles gambiae, the primary mosquito vector of malaria.
Environmental and climatic variables such as rainfall, temperature, and vegetation cover are known to significantly influence malaria transmission by affecting the survival, breeding, and biting behaviour of
Anopheles mosquitoes
. Rainfall creates breeding grounds through the formation of stagnant water pools, which are ideal for mosquito larval development
. However, excessive rainfall can also wash away larvae and breeding habitats, making the relationship nonlinear
| [16] | Tulak N, Handoko H, Hidayati R, Kesumawati U, Hakim L. Effect of climatic factors and habitat characteristics on Anopheles larval density. J Kesehat Masy. 2018; 13: 345–55.
https://doi.org/10.15294/kemas.v13i3.11560 |
[16]
. Minimum temperature plays a critical role in the maturation of mosquito larvae and the sporogonic development of
Plasmodium parasites within the mosquito. When minimum night temperatures remain above 16°C, it enhances vector survival and increases malaria risk
. On the other hand, maximum temperatures, when moderately high (approximately 30–32°C), accelerate the mosquito’s life cycle and the development of the malaria parasite, thereby shortening the transmission cycle
. However, extreme heat (above 35°C) may reduce vector survival
| [19] | de Souza WM, Weaver SC. Effects of climate change and human activities on vector-borne diseases. Nat Rev Microbiol. 2024; 22: 476–91. |
[19]
.
Additionally, vegetation cover, measured via the normalized difference vegetation index (NDVI), is closely linked to malaria risk. Dense vegetation provides favourable resting and hiding habitats for adult mosquitoes and contributes to maintaining humid microenvironments that extend vector survival
| [20] | Ndyamuhaki Y. Ecological determinants of malaria incidence and its regional prevalence variation among children under five years old in Uganda. 2024; http://hdl.handle.net/1807/139557 |
[20]
. Studies have shown a strong association between high NDVI values and increased malaria incidence, especially in rural and semi-forested regions
| [21] | Palaniyandi M. The environmental Risk Factors Significant to Anopheles Species Vector Mosquito Profusion, P. falciparum, P. vivax Parasite Development, and Malaria Transmission, Using Remote Sensing and Gis. Indian J Public Heal Res Dev. 2021; 12. |
[21]
.
Malaria imposes a significant socioeconomic burden on Ugandan households and the national economy. Direct costs, such as consultation fees, drugs, transport, and care, are compounded by indirect costs, including the loss of workdays, reduced productivity, and impaired educational outcomes
| [22] | Kempter E, Upadhayay NB. Uncovering the role of education in the uptake of preventive measures against malaria in the african population. University of Tübingen Working Papers in Business and Economics; 2022.
http://dx.doi.org/10.15496/publikation-72149 |
[22]
. A single malaria episode costs an average household $26, which amounts to $78 annually for families experiencing three episodes, representing 3% of their income. Poor households in endemic regions may spend up to 25% of their income on prevention and treatment, further aggravating poverty. Among children under five, the annual economic impact is estimated at $614 million, with $57.7 million attributed to direct medical costs
| [23] | Ozawa S, Evans DR, Higgins CR, Laing SK, Awor P. Development of an agent-based model to assess the impact of substandard and falsified anti-malarials: Uganda case study. Malar J. 2019; 18: 1–14.
https://doi.org/10.1186/s12936-018-2628-3 |
[23]
.
In addition to individual and household impacts, malaria undermines national development by reducing agricultural and industrial productivity and discouraging foreign investment
. Severe malaria also impairs cognitive development in children by up to 60%, weakening human capital and hindering the performance of Uganda’s universal education programs
.
Moreover, many current interventions do not adequately reflect region-specific climatic and ecological drivers of malaria transmission
| [27] | Musoke D, Atusingwize E, Namata C, Ndejjo R, Wanyenze RK, Kamya MR. Integrated malaria prevention in low-and middle-income countries: a systematic review. Malar J. 2023; 22: 79.
https://doi.org/10.1186/s12936-023-04500-x |
[27]
. High-prevalence regions, such as Karamoja, West Nile, and Busoga, remain underserved, with intervention strategies not tailored to their unique environmental profiles. This limits Uganda's ability to implement climate-sensitive and evidence-based malaria control programmes, even as climate change increasingly alters the dynamics of malaria transmission across time and space.
Understanding the complex interplay between climate factors and malaria incidence is critical for informing timely and effective public health interventions. Malaria transmission is influenced by a combination of climatic conditions, such as rainfall and temperature, and ecological indicators like the vegetation cover, which together affect mosquito breeding, parasite development, and human exposure risk
. Analysing these variables in isolation often fails to capture the dynamic and interdependent nature of their effects over time.
To address this, the study employed a time series analysis using the Vector Error Correction Model (VECM), a robust econometric technique designed to examine both short-term dynamics and long-term equilibrium relationships among multiple time series variables that are co-integrated. The short-term changing dynamics refer to seasonal or inter-annual variations in climate factors such as rainfall, temperature, or vegetation cover that trigger immediate fluctuations in mosquito breeding and malaria transmission. For instance, a surge in rainfall during a particular season may lead to a temporary increase in mosquito populations and malaria cases. In contrast, long-term relationships capture the sustained or equilibrium linkages between climate variables and malaria prevalence that persist over extended periods, reflecting how gradual shifts such as rising average temperatures or long-term vegetation changes shape the overall dynamics and geographic distribution of malaria transmission.
Unlike standard regression models, the VECM accounts for the influence of past values (lags) of each variable and includes an error correction term that measures how quickly the system returns to equilibrium after experiencing a disturbance. This makes it relevant for epidemiological studies, where delayed effects and interactions among climate variables are common.
2. Objective
This study assesses the temporal patterns of climate variability and malaria incidence among children aged 0–5 years in Uganda using a time series analysis.
3. Materials and Methods
3.1. Study Design
The study used a retrospective time series design. This was based on 150 confirmed malaria cases among children under five years and climate variables, including maximum temperature, minimum temperature, and vegetation cover.
3.2. Data Sources
The study used secondary data from January 2015 to December 2022 as follows.
1) For the Uganda National Meteorological Authority (UNMA), we obtained data on climate variables, including rainfall and temperature.
2) For the Uganda Ministry of Health (MoH), we obtained data on confirmed malaria cases among children under the age of five.
3) Satellite data (vegetation indices: NDVI), from which we obtained data on vegetation cover.
3.3. Selection Criteria
The study covered four regions: West Nile, Karamoja, Ankole, and South-Central. The selection of the regions was based on data from the Uganda malaria indicator survey of 2019, which revealed that the West Nile and Karamoja regions had the highest incidence rates of malaria and that southern Buganda and Ankole had the lowest incidence rates of malaria among children under five years of age.
The study considered thirteen districts in all four regions. These were selected on the basis of the load of malaria cases among children under five years reported by the Ministry of Health. Three districts were selected from each region, two with high loads and one with a lower load.
3.4. Variables and Their Measurement
Records for malaria cases of children under the age of five years were sourced from the District Health Information System (DHIS2), MoH. In Uganda, all health facilities are required to submit monthly reports from their out-patients department (OPD) registers on all reported diseases to the Department of Health information of the Ministry of Health (MoH). Health facilities are either private-for-profit (PFP) or public, comprised of the government-owned and private-not-for-profit (PNFP) facilities. Health Management Information System (HMIS) was introduced in 1997 as a paper-based reporting system from each health facility to the Ministry of Health. In 2012, however, a web-based reporting version, the DHIS-2, was implemented with full roll-out across the country in 2013. For this study, HMIS data consisted of monthly counts of all reported and confirmed malaria cases for children 0-5 years from study facilities. Confirmed malaria cases were laboratory confirmed cases using either blood slide microscopy (B/S) or Rapid Diagnostic Test for malaria (RDT) as per national guidelines. This study used data for the confirmed malaria cases for children under the age of five years. The researcher used point data for malaria cases among children under five years from the health facilities that are reported monthly using the HMIS and DHIS-2. This data is what is presented in the analysis for this paper. The results presented did not have the population denominator; rather, they are point data as reported from the health facilities. This data covered the districts of West Nile, Karamoja, Ankole, and South-central.
Vegetation cover data were obtained from the Moderate Resolution Imaging Spectroradiometer (MODIS) at a spatial resolution of 250 m. For each health facility, the MODIS pixel corresponding to its geographic coordinates was extracted. Rainfall data were sourced from the Climate Hazards Group InfraRed Precipitation with Station data (CHIRPS) at 0.05° (~5 km) resolution, with values extracted for the pixel containing each facility. Temperature data were obtained from the European Centre for Medium-Range Weather Forecasts (ECMWF) Reanalysis 5 (ERA5) reanalysis dataset at 0.1° (~9 km) resolution, with facility-specific pixel values extracted. Weather station temperature and rainfall data were used in place of satellite-derived data under the following conditions:
1) When cloud cover, missing scenes, or retrieval errors resulted in gaps in the satellite dataset for specific days or locations.
2) When a facility was located within 10 km of a weather station with complete daily records, the ground observation was considered more accurate for local conditions.
3) For validation purposes, where both sources were available, weather station data were used to cross-check satellite values and adjust for bias through statistical standardization.
The climate data and malaria data were aligned to cover the same time span. Both datasets were aggregated to be in the monthly period over the same period of study from 2015-2022. The data was collected from the regions of Karamoja, West Nile, South Central, and Ankole. Both datasets were aligned to a common coordinate system (latitude/longitude) at the health facilities for accurate spatial integration.
3.5. Data Processing and Standardization
Before integrating the datasets, both climate and malaria data were processed in compatible formats to cover the same time periods and spatial locations. Climate data and malaria data were aligned to cover the same time span. Both data sets were aggregated to be in the monthly period over the same period of study from 2015 to 2022. Both datasets were aligned to a common coordinate system (latitude/longitude) for accurate spatial integration.
3.6. Data Analysis
Time series analysis was used to identify the magnitude and direction of the relationship between malaria and climate variability. Three stages of analysis were adopted to facilitate the achievement of this objective. There was a visualization of the time series data. This was in the form of trends and seasonality. This helped to identify any upward or downward trends and recurring seasonal effects.
Time-Series Analysis Procedures
Stationarity tests
Ensuring stationarity in time series data is essential for accurate statistical analysis. Non-stationary variables can produce misleading regression results, affecting statistical significance,
and Durbin–Watson values
. A stationary time series maintains a constant mean, variance, and covariance over time, with temporary shocks dissipating
| [30] | Fors A, Markiewicz O. Swedish Equities: Casanovas or commited Cointegrated partners. 2016. |
[30]
. To detect non-stationary, the augmented Dickey‒Fuller (ADF) test is applied
. This test, an improvement over the standard Dickey‒Fuller test, is more effective for large samples. It examines the null hypothesis that a unit root exists (indicating non-stationary) against the alternative hypothesis of stationarity. The malaria and climate data are tested via the ADF model, which incorporates both a constant term and a trend component, as represented by the following equation:
+(1)
Where α is a constant, is a coefficient on a time trend, p is the lag in the autoregressive process that ranges from 1 to m, m=t-p+1, and is the error term.
Autocorrelation plots (ACFs) serve as useful tools for assessing stationarity. If the time series exhibits significant correlations at multiple lags, it suggests the presence of trends or seasonality, indicating non-stationarity. A stationary time series typically shows a rapid decline in autocorrelation, whereas a non-stationary series exhibits a gradual decrease.
ACF plots also aid in determining the differencing order required to achieve stationarity and can help identify the order of the moving average (MA) process. Similarly, partial autocorrelation function (PACF) plots measure the direct correlation between a variable and its lags, excluding intermediate effects. This is particularly useful in determining the order of the autoregressive (AR) process. In Stata, the ACF and PACF plots include 95% significance boundaries, represented by blue dotted lines, providing a clear visual reference for assessing the stationarity of the data.
Optimum lag selection
Determining the optimal lag length is crucial for accurate econometric analysis, as it influences the causality direction and model precision. Selecting too few lags can lead to auto-correlated errors, whereas too many lags can increase forecast errors
. Several criteria aid in lag selection, including the Akaike information criterion (AIC), Schwarz-Bayesian information criterion (SIC), Hannan-Quinn information criterion (HQ), and final prediction error (FPE). AIC and FPE are preferred for small samples, whereas SIC and HQ are better for large samples because of their consistency in selecting the correct model order
| [33] | Zivot E, Wang J. Vector autoregressive models for multivariate time series. Model Financ time Ser with S-PLUS®. 2006; 385–429. |
[33]
. The study will compare these criteria and select the lag length that minimizes the chosen metric, ensuring a balance between model simplicity and forecasting accuracy. The specifications for each criterion are presented below:
Akaike information criterion (AIC):
The Schwarz-Bayesian information criterion (SIC):
SICp=(3)
Hannan-Quinn information criterion (HQ):
HQp=In+(4)
Final prediction error (FPE):
FPEp= ln () (T+p)T-p)-1(5)
Where
is a covariance matrix for residuals from a VAR (ρ) without correcting for degrees of freedom; T is the sample size,
=
;
are residuals in the model; and ρ is the lag order, where n is the number of observations
| [33] | Zivot E, Wang J. Vector autoregressive models for multivariate time series. Model Financ time Ser with S-PLUS®. 2006; 385–429. |
[33]
.
In this study, these criteria are compared in the analysis, and the criterion with the least optimal lag is selected for further analysis. This approach is necessary to maintain a balance between the principles of parsimony and forecasting, which is the focus of this study.
Co-integration tests
Johansen’s test for co-integration is a statistical method designed to identify long-run equilibrium relationships among multiple time series, even if the series themselves are non-stationary. The test was performed via the Johansen trace and maximal eigenvalue tests of cointegration
. This test tests whether the dependent and independent variables have long-run associations or a common stochastic trend. This test is used to determine the presence of co-integration among variables and detect the number of co-integrating relationships among the variables in the simultaneous system of equations. The general Johansen test is based on the null hypothesis that there is no co-integration, in contrast to the alternative in which there is co-integration. The Johansen test is based on 2 tests, namely, the trace statistic test and the maximum eigenvalue test. For the trace statistic test, the likelihood statistic is given by
LKtr(m) = - (T-p)(6)
The null hypothesis Ho: Rank () = m is tested against the alternative hypothesis HA: Rank (tr (m) is large.
For the maximum eigenvalue test, the statistic is given by
LKmax(m) = - (T-p) ln (1-(7)
The null hypothesis Ho: Rank () = m is tested against the alternative hypothesis HA: Rank () = m+1. If m=0, then there is no cointegration, and if m=1, it implies that there is one cointegrating equation. The null hypothesis is rejected when LKmax (m) is large. This can be achieved by combining the results from the trace and maximum eigenvectors because both the trace and the Max-Eigen test statistics are equally efficient. If the variables are co-integrated, the researcher will use the VECM; however, if the variables are not co-integrated, the researcher will use the Vector Autoregression (VAR) model.
Model estimation
When the time series variables are co-integrated, the VAR model is extended to include the error term that captures long term relationships. The Error Correction term (ECM), which is also the co-integrating term, estimates the rate at which a dependent variable converges back to equilibrium, due to changes in other variables Johansen (1995). The Vector Error Correction Model (VECM) is hence obtained. A Vector error correction model (VECM) is a type of the VAR model, also referred to as the restricted VAR, which is specially used when variables are stationary at first difference or even second difference, and are co-integrated.
To achieve the objective of the study, the researcher used the vector error correction model (VECM): The final model was fitted after understanding the optimal lag length and establishing the number of co-integrating equations as explained above. When the time series variables are co-integrated, the VAR model is extended to include the error term that captures long-term relationships. The error correction (ECM) term, which is also a co-integrating term, estimates the rate at which a dependent variable converges back to equilibrium due to changes in other variables
| [35] | Johansen S. Estimation and hypothesis testing of cointegration vectors in Gaussian vector autoregressive models. Econom J Econom Soc. 1991; 1551–80.
https://doi.org/10.2307/2938278 |
[35]
. The vector error correction model (VECM) is hence obtained in the equation (
8).
+(8)
Where Π = - (I-Φ1- Φ2,…, -Φp)=- Φ(1); I is an identity matrix; = -; j=1,…, p-1.
where Rank (Π)= m; 0<m<k; Π (a k x k matrix) is considered equal to , with α being a (k x m) matrix of Eigenvalues, m, that are cointegrating vectors; β being a (k x m)’ matrix of Eigenvalues, m, that are adjusting vectors; represents the lagged error-correction term that explains the long-run relationship; explains the short-run relationship between the variables; i=1,…, k-1 is the number of optimal lags; is the first difference; and is a matrix of coefficients that explain the short-run dynamics in the system.
3.7. Ethical Approval
Ethical approval was sought from Mulago Hospital Research and Ethics Committee under the number (MHREC-2910). Administrative approval was obtained from Makerere University and the Ministry of Health before data was obtained from the Ministry.
4. Results
4.1. Presentation of Summery Statistics
Analysis was conducted on a total of 44,624 observations collected monthly over 8 years (2015-2022). The outcome variable was the total number of malaria cases among children under five, treated as a count variable, along with variables such as total rainfall, minimum and maximum temperatures, and vegetation cover. The data was obtained from thirteen districts spread across four regions in Uganda.
Table 1 shows the summary statistics for each variable by district.
Table 1. Summary of Variables and their measurements.
Variable | Measurement Method | Data Source | Units of measurement | Spatial Resolution |
Dependent variable | |
Malaria Incidence | Confirmed malaria cases among children 0-5 years per health facility | Local Health Centers | Confirmed cases among children 0-5 years | |
Independent variables | |
Vegetation Cover | Derived from satellite reflectance (NIR and RED bands) | MODIS | NDVI (-1 to +1) | 250m |
Rainfall | Measured via satellite-based precipitation estimates and ground stations | CHIRPS, Weather Stations | mm (month) | 0.05° |
Temperature | Measured via satellite or ground-based meteorological stations | ERA 5, Weather Stations | °C, minimum and maximum | 0.1/9km |
NIR- Near-infrared, RED- Red region of the electromagnetic spectrum, MODIS- Moderate Resolution Imaging Spectroradiometer, NDVI- Normalized Difference Vegetation Index, CHIRPS-Climate Hazards Group InfraRed Precipitation with Station data.
Table 2. Summary Statistics for Variables under study by district.
| Malaria Cases among children 0-5 years | Total rainfall amounts (MM) | Minimum Temperature (°C) | Maximum Temperature (°C) | NDVI (-1 to +1) |
Adjumani | 168 | 99.313 | 18.702 | 32.95 | 0.514 |
Bukomansimbi | 28 | 98.255 | 16.710 | 26.98 | 0.556 |
Gomba | 27 | 103.371 | 16.485 | 28.058 | 0.580 |
Isingiro | 34 | 78.456 | 14.533 | 27.61 | 0.504 |
Kiruhura | 16 | 78.702 | 14.738 | 27.239 | 0.515 |
Koboko | 150 | 112.091 | 17.738 | 30.639 | 0.480 |
Kotido | 141 | 64.08 | 16.367 | 30.716 | 0.351 |
Lwengo | 36 | 97.415 | 16.491 | 27.539 | 0.487 |
Nabilatuk | 196 | 82.832 | 17.131 | 32.34 | 0.435 |
Napak | 130 | 81.135 | 16.675 | 31.329 | 0.407 |
Rwampara | 6 | 61.739 | 10.294 | 19.749 | 0.411 |
Wakiso | 60 | 118.267 | 18.106 | 27.896 | 0.464 |
Yumbe | 214 | 102.461 | 18.576 | 32.199 | 0.499 |
Source: Analysis from the Research data
Table 2 shows the summary statistics for variables by district. The study was done in the regions of Karamoja, Ankole, West Nile, and South Central. The results show a considerable variation by districts: for instance, West Nile (Yumbe) and Karamoja (Nabilatuk) have high malaria cases among children under five years, while Ankole (Rwampara) has the lowest. Rainfall also varies, with South Central (Wakiso) receiving the most amount of rainfall, while Karamoja (Kotido) has the least amount of rainfall. Temperature ranges are broad, with higher temperatures generally observed in areas with more malaria cases among children under five years, possibly indicating a relationship between these factors.
Table 3. Summary Statistics for Analysis Variables by Year.
| Malaria cases for children 0-5 years | rainfall amounts | Minimum Temperature | Maximum Temperature | NDVI |
2015 | 77 | 91.879 | 16.105 | 30.019 | 0.523 |
2016 | 85 | 83.76 | 16.207 | 30.244 | 0.509 |
2017 | 84 | 91.899 | 16.213 | 30.284 | 0.512 |
2018 | 75 | 104.899 | 15.941 | 29.58 | 0.519 |
2019 | 88 | 108.216 | 16.504 | 29.678 | 0.528 |
2020 | 94 | 111.034 | 15.876 | 27.989 | 0.534 |
2021 | 87 | 87.04 | 17.973 | 26.876 | 0.51 |
2022 | 95 | 95.201 | 17.998 | 26.931 | .4094 |
Source: Analysis from the Research data
Figure 1. Distribution of malaria cases among children under five years in the regions of study.
Table 3 presents summary statistics by year. From the table, the average number of malaria cases among children under five years fluctuates, with a general increase observed from 2018 to 2022. Rainfall amounts also show variability, peaking in 2019 and 2020. The minimum temperature remains relatively stable, while the maximum temperature shows a gradual decline from 2016 onward. The NDVI values suggest slight changes in vegetation health, with a peak in 2020 followed by a decrease in subsequent years, potentially indicating variations in environmental conditions over time. The map (
Figure 1) shows key variations of malaria cases among children under five years across the studied districts. The results show that over time, Malaria cases among children under five years are highest in the West Nile sub-region. In the central region, the cases are highest in Wakiso District, while the Karamoja sub-region revealed moderate to high incidence. The western region, specifically Ankole, registered the lowest cases for all the years considered in this study.
Figure 1 presents the distribution of malaria cases among children under five years across the study regions from 2015 to 2023. The results indicate that the West Nile region recorded the highest malaria prevalence, followed by Karamoja and parts of South Buganda. These findings are consistent with the Malaria Indicator Survey report, which also highlights these regions as having persistently high malaria burden.
4.2. Visualization of Time Series Trends of the Variables
Figure 2 illustrates the trends of malaria cases among children under five years in relation to rainfall, showing notable peaks in malaria episodes between March–June and August–October. These peaks occur following the onset of rains in February, corresponding to the two-month lag period indicated in
Figure 2. This confirms that the strongest effect of rainfall on malaria incidence is typically observed 3–6 weeks after the onset of rain. The peaks consistently follow periods of increased rainfall, particularly during the long rainy season (March–May) and, in some years, the shorter rainy season (September–November). This pattern reflects the role of rainfall in creating favourable breeding sites for mosquitoes, the primary vectors of malaria.
Figure 2. Visualization of time series trends for Malaria Cases among children under five years and Rainfall.
Figure 3. Visualization of time series trends for Malaria Cases among children under five years and Temperature.
In
Figure 3, both minimum and maximum temperature trends remain relatively stable over the years, exhibiting only slight seasonal variations that correspond with rainfall patterns. While minimum temperature shows some influence on malaria prevalence, its effect appears relatively modest compared to other climatic factors.
Figure 4. Visualization of time series trends for Malaria Cases among children under five years and NDVI.
The monthly trends from 2015 to 2022 (as shown in
Figure 4) reveal a consistent seasonal pattern in malaria cases among children under five years, with peak cases typically occurring between April and August each year. Vegetation cover, as reflected by increased greenness (NDVI), also rises during months of high malaria episodes. Since NDVI serves as a proxy for environmental moisture and habitat suitability, this pattern highlights its close association with rainfall. The observed lag in NDVI response reflects the time required for vegetation to flourish following rainfall events.
4.3. Seasonality
This section presents the results of the Friedman test for seasonality conducted on all variables used in the analysis. Understanding these seasonal trends is vital for interpreting the temporal behaviour of environmental and climatic factors before examining their interaction with malaria cases among children under five years. It also clarifies the drivers of malaria transmission, as factors such as temperature, rainfall, and vegetation directly influence mosquito breeding, survival, and human exposure.
Table 4 summarizes the Friedman test results for malaria cases, total rainfall, minimum and maximum temperature, and NDVI. The nonparametric test assessed whether these variables exhibited systematic seasonal patterns. Results show statistically significant seasonality for all variables, with test statistics ranging from 41.36 (malaria cases) to 55.3 (NDVI) and p-values below 0.05, confirming recurring seasonal patterns (“TRUE” in the seasonal column).
These findings highlight the need to account for seasonality in subsequent analyses and models. Incorporating seasonal components in regression or forecasting models ensures accurate estimation and prediction, while ignoring them could lead to biased or misleading interpretations, especially for climate-sensitive variables like malaria cases and rainfall.
Table 4. Friedman test for seasonality.
Variable | Fried Test Statistics | p -value | Seasonal |
Malaria cases among children 0-5 years | 41.36 | 0.0002 | TRUE |
Total Rainfall | 49.24 | 0.0000 | TRUE |
Minimum Temperature | 48.03 | 0.0000 | TRUE |
Maximum Temperature | 45.18 | 0.0000 | TRUE |
NDVI | 55.3 | 0.0000 | TRUE |
4.4. Testing for Stationarity Using the Augmented Dickey‒Fuller (ADF) Test
Table 5. Augmented Dicky–Fuller tests of unit roots and Phillips‒Perron (PP) tests.
Variable | ADF test |
Levels | p value |
Malaria | -3.447** | 0.0095 |
Rainfall | -6.165** | 0.0000 |
Min Temp | -4.645** | 0.0001 |
Max Temp | -3.368** | 0.0121 |
NDVI | -4.424** | 0.0003 |
Testing for unit roots is a fundamental step in time series analysis to determine whether a series is stationary or non-stationary, which affects the validity of subsequent modelling and forecasting. Common methods include the augmented Dickey‒Fuller (ADF) test, which checks for unit roots under the null hypothesis of non-stationarity, and the Phillips‒Perron (PP) test, which is robust against heteroscedasticity and autocorrelation. The process involves comparing test statistics and P-values with critical values to assess stationarity. Identifying and addressing unit roots is crucial to ensure accurate regression analysis, co-integration testing, and forecasting, as it allows for necessary data transformations, such as differencing, to achieve stationarity and maintain the integrity of econometric models.
Table 5 shows the results of unit root tests (specifically, the Dickey‒Fuller test) conducted on time series data. The variables were not differenced because they were all stationary at levels. If the test statistic in levels is lower than the critical values, the null hypothesis of a unit root is rejected, suggesting that the series is stationary in levels. Similarly, if the test statistic is not lower than the critical values, it indicates that the series likely has a unit root (i.e., it is non-stationary). The results of the unit root test, namely, the augmented Dickey‒Fuller (ADF), indicate that all the variables tested (Malaria, Rainfall, Minimum Temperature, Maximum Temperature, and NDVI) are stationary at their levels. For each variable, the null hypothesis that the series has a unit root (non-stationary) is rejected at the 5% significance level, as indicated by the statistically significant test statistics and p-values below 0.05.
4.5. Optimal Lag Length
Selecting the appropriate maximum lag length is a critical step in time series analysis, particularly when testing for co-integration via the Johansen test and estimating a vector error correction model. The lag length determines how well the model captures both short-term dynamics and long-term relationships among variables. An incorrect choice of lags can lead to biased co-integration results, poor model performance, or over-fitting, which is particularly problematic when the goal is accurate forecasting. For this analysis, the Bayesian information criterion (BIC) was chosen as the preferred lag selection criterion. BIC is well-suited for models where parsimony is essential, as it imposes a stronger penalty for additional parameters than other criteria, such as the Akaike information criterion (AIC).
Using the BIC to select the maximum lag length ensures that the resulting Johansen test for co-integration is not influenced by unnecessary lags while still capturing the key dynamics of the system. Furthermore, the selected lags provide a solid foundation for estimating the VECM, which integrates short-term adjustments and long-term equilibrium relationships.
Table 6 provides lag selection results based on four commonly used criteria. The criteria suggest varying lag lengths. The AIC selects lag 9 as optimal, favouring a more complex model with more lags to maximize fit. On the other hand, the HQ and BIC, which impose stronger penalties for additional parameters, select lag 1 as the most parsimonious choice. The FPE identifies lag 2 as optimal. These differences reflect the trade-offs between model simplicity and the ability to capture more dynamics: the AIC tends to favour longer lags, whereas the HQ, BIC, and FPE lean toward parsimony or balance.
Table 6. Maximum lag selection.
Lag | AIC | HQ | BSC | FPE |
1 | 8.930 | 9.274* | 9.786* | 7560.105 |
2 | 8.690 | 9.321 | 10.259 | 5983.009* |
3 | 8.683 | 9.601 | 10.966 | 6030.261 |
4 | 8.668 | 9.874 | 11.665 | 6116.779 |
5 | 8.921 | 10.414 | 12.631 | 8256.021 |
6 | 8.774 | 10.554 | 13.198 | 7658.325 |
7 | 8.864 | 10.931 | 14.001 | 9301.513 |
8 | 9.032 | 11.386 | 14.882 | 12735.289 |
9 | 8.350* | 10.991 | 14.914 | 7867.202 |
10 | 8.095 | 11.024 | 15.373 | 8006.562 |
The Akaike information criterion (AIC), Hannan-Quinn criterion (HQ), Bayesian information criterion (BSC), and final prediction error (FPE). Each criterion evaluates the performance of the model at different lag lengths, balancing model fit and complexity.
For this study, the Bayesian information criterion (BSC), which selects a lag of 1, is the most appropriate choice. BIC's stronger penalization for over-fitting ensures that the model remains robust and generalizes well to out-of-sample data. While the FPE (lag 2) minimizes prediction error, the slight increase in complexity compared with lag 1 may introduce unnecessary lags. Thus, the selected lag length of 1 provides a parsimonious and effective foundation for subsequent analyses, such as the Johansen co-integration test and the vector error correction model (VECM), ensuring accurate and reliable forecasts.
The study considered biological plausibility when determining the optimal lag length. The study used monthly data, so a lag of 2 corresponds to approximately 8 weeks. For instance, following heavy rainfall, mosquito breeding sites form. Mosquito larvae typically mature into adults within 10–14 days, and the malaria parasite requires about 10 days to develop inside the mosquito before it can be transmitted. Thus, the strongest effect of rainfall on malaria incidence would be expected 3–6 weeks later. This process is accelerated by warmer temperatures, while higher vegetation cover may indicate more suitable mosquito breeding habitats and resting sites.
4.6. Co-integration Test
The test assessed the presence of co-integration by evaluating the rank of the co-integration matrix via two test statistics: the trace statistic, which sums the log-likelihood ratios of the eigenvalues, and the maximum eigenvalue statistic, which tests the null hypothesis of no co-integration against the presence of at least one co-integrating vector. This test is crucial in multivariate time series models such as vector auto-regression (VAR) and vector error correction (VECM) models, as detecting co-integration ensures proper modelling of long-term relationships, enabling more accurate analysis and forecasting in fields such as economics, climatology, and agricultural studies.
Table 7. Co-integration test for the variables under study.
Rank | Null Hypothesis | Alternative Hypothesis | Eigenvalue | Trace Statistic | 5% Critical Value | Co-integration Result |
0 | r ≤ 0 | r > 0 | 0.532 | 2.639 | 9.240 | Not Rejected |
1 | r ≤ 1 | r > 1 | 0.373 | 17.517 | 19.960 | Not Rejected |
2 | r ≤ 2 | r > 2 | 0.216 | 40.430 | 34.910 | Rejected |
3 | r ≤ 3 | r > 3 | 0.146 | 84.264 | 53.120 | Rejected |
4 | r ≤ 4 | r > 4 | 0.028 | 155.549 | 76.070 | Rejected |
Table 7 presents the results of the Johansen test for co-integration, showing the trace statistics for different ranks (r) along with their corresponding eigenvalues and critical values. For each rank, the test evaluates the null hypothesis that the number of co-integrating relationships is less than or equal to the rank against the alternative hypothesis that it is greater than the rank. For ranks 0 and 1, the trace statistics (2.639 and 17.517) do not exceed the 5% critical values (9.240 and 19.960), so the null hypothesis is not rejected, indicating no significant co-integration at these levels. However, for ranks 2 and higher, the trace statistics (40.430, 84.264, and 155.549) surpass the critical values (34.910, 53.120, and 76.070), leading to the rejection of the null hypothesis. This suggests that co-integration relationships become significant starting at rank 2, with subsequent ranks confirming the presence of strong long-term relationships among the variables under study. This further confirms the presence of at least two long-term equilibrium relationships among malaria incidence and the climatic and environmental variables. This finding implies that malaria transmission dynamics are not governed by a single driver but are instead shaped by multiple stable interactions, such as the combined effects of rainfall, temperature, and vegetation cover. In practical terms, malaria cases are anchored to more than one consistent environmental pathway over time. This highlights the complexity of malaria transmission and underscores the need for integrated control strategies that address multiple environmental determinants simultaneously, rather than focusing narrowly on a single factor. This further justifies the use of the VECM as the appropriate modelling approach to capture the long-term relationships and short-term dynamics among the variables included in the analysis.
4.7. Model Estimation Using the Vector Error Correction Model (VECM)
The VECM results revealed both short-term dynamics and long-term equilibrium relationships among malaria cases among children under five years, rainfall, temperature (minimum and maximum), and the NDVI. The error correction term (ect. 1) highlights long-run adjustments, with small but significant coefficients indicating the system's return to equilibrium after deviations. The lag coefficients show that past changes in variables such as malaria, rainfall, and temperature strongly influence current states. These relationships underscore the importance of seasonal interactions, climate patterns, and vegetation dynamics, which are crucial for climate impact assessments and effective intervention strategies in areas such as epidemiology and agricultural planning.
Table 8. Vector Error Correction Model (VECM) Results.
Variable | malaria | rainfall | Min-temp | Max-temp | NDVI |
ect1 | -0.006 | 0.041 | 0.001 | 0.002 | 0.000 |
malaria.dl1 | 0.091 | 0.185 | -0.002 | -0.011 | 0.000 |
rainfall.dl1 | 0.061 | -0.111 | -0.003 | -0.029 | 0.001 |
min_temp.dl1 | 0.810 | 8.928 | -0.245 | -0.252 | 0.015 |
max_temp.dl1 | -0.259 | 7.969 | -0.061 | -0.414 | 0.007 |
NDVI.dl1 | 140.100 | 197.800 | -2.679 | 2.411 | -0.074 |
Table 8 shows VECM results that reveal the relationships among malaria cases in children under five, rainfall, temperature (both minimum and maximum), and NDVI through both short-term dynamics and long-term equilibrium adjustments. The error correction term (ect1) reflects the long-term relationships among these variables. For example, the coefficient for malaria (-0.006) indicates a small negative adjustment toward equilibrium, meaning that deviations from the expected long-term relationship leads to slight corrections in malaria cases among children under five. Additionally, an error correction term of –0.006 suggests that malaria prevalence in children adjusts very slowly to its long-term equilibrium aftershocks from climate variability only 0.6% of the deviation is corrected each month. This implies that climate-driven surges in malaria cases may last a long time without intensified control efforts. Conversely, the error correction terms for rainfall and minimum temperature are positive, indicating that deviations in these variables are corrected upward to maintain long-term relationships. The error correction term (ECT) for NDVI was zero (0.000), showing that vegetation cover does not play a role in the long-term adjustment of malaria cases back to equilibrium. This suggests that while changes in vegetation (indicated by NDVI) may influence malaria transmission in the short run by providing suitable mosquito breeding sites, they do not stabilize malaria cases over time. Practically, malaria incidence does not “self-correct” through vegetation dynamics alone, so sustained public health measures such as indoor residual spraying, distribution of insecticide-treated nets, and environmental management are essential for long-term control.
The lag coefficients further highlight the temporal dynamics of these variables. For example, the coefficients for malaria.dl1 (0.091) and rainfall.dl1 (0.061) show that past changes in malaria and rainfall significantly impact current variations in these variables. The coefficient for min_temp.dl1 (0.810) is notably high, suggesting a strong influence of past minimum temperature changes on the current state of minimum temperature. Similarly, the negative coefficient for max_temp.dl1 (-0.259) suggests an inverse relationship with previous maximum temperature changes. For the NDVI, the large coefficient (140.100) highlights its significant impact on vegetation dynamics, emphasizing the importance of seasonal changes in vegetation for climate and ecological interactions. An NDVI coefficient of 140.100 suggests that greener vegetation cover is strongly associated with higher malaria incidence. Specifically, for every unit rise in vegetation index, malaria cases are expected to increase by about 140 cases in children under five years. This indicates that areas with dense vegetation, which often provide favourable breeding habitats for mosquitoes, tend to experience significantly higher malaria transmission.
Overall, these VECM results indicate that the system has both short-term and long-term interactions among the studied variables. The error correction term ensures that any deviations from the equilibrium relationships are corrected over time, whereas the lag coefficients show how past changes in each variable influence their present states. Understanding these relationships helps in developing effective models for forecasting, climate impact assessments, and epidemiological interventions, for example, predicting seasonal malaria outbreaks on the basis of temperature and normalized difference vegetation index (NDVI) trends.
5. Discussion
This study aimed to assess the temporal patterns of climate variability and malaria incidence among children (0-5) in Uganda. The vector error correction model (VECM) results reveal both short-term dynamics and long-term equilibrium relationships among malaria cases among children under five years, rainfall, temperature (both minimum and maximum), and the NDVI.
Significant relationships were found between the identified temporal patterns of climate variability and the incidence of malaria in children under five years old. The short-term impact of conducive mosquito breeding circumstances was shown in the seasonal peaks in malaria incidence that coincided with times of higher rainfall and vegetation cover. The findings of this study correspond with the study done by Begum that highlighted the significant impact of climate change, specifically temperature and rainfall, on the transmission dynamics of vector-borne diseases in Dhaka, Bangladesh
. Furthermore, higher temperatures were linked to increased transmission, yet in certain cases, intense heat seemed to reduce mosquito survival. The findings of this study agreed with the study by Nosrat et al. in Cameroon, which found that mosquito eggs and adults were significantly more abundant one month following an abnormally wet month
| [37] | Nosrat C, Altamirano J, Anyamba A, Caldwell JM, Damoah R, Mutuku F, et al. Impact of recent climate extremes on mosquito-borne disease transmission in Kenya. PLoS Negl Trop Dis. 2021; 15: e0009182.
https://doi.org/10.1371/journal.pntd.0009182 |
[37]
. Long-term trends in malaria prevalence were associated with both modest changes in rainfall distribution and persistent vegetation changes, highlighting the influence of both short-term climatic fluctuations and long-term environmental changes on the dynamics of malaria in young children. However, these findings are in disagreement with the findings by Smith DL, et al, who found that while climate change’s effect on malaria is highly plausible, empirical evidence is much less certain
.
At the core of long-term dynamics is the error correction term (ECT1), which indicates how each variable adjusts when the system deviates from its equilibrium state. The ECT coefficient for malaria is -0.006, suggesting that malaria cases among children under five years adjust slightly downward when there are deviations from the expected long-term relationship. This small negative value indicates a slow but steady correction mechanism, indicating that malaria cases among children under five years is relatively stable in response to external shocks and do not rapidly revert to equilibrium. These findings are in line with the finding of the study done by Ochomba which showed that recoveries and temporary immunity keep the populations at oscillation patterns and eventually converge to a steady state
| [39] | Ochomba WN. A Mathematical Model For The Control Of Malaria With Temporary Immunity. 2013. |
[39]
. They stated that proper combination of treatment and concerted effort aimed at prevention, malaria could be eliminated from our society.
On the other hand, the positive error correction terms for rainfall, minimum temperature, and the NDVI imply that these variables tend to adjust upward following a deviation, reinforcing their role as more dynamic factors in maintaining the system’s long-term balance. This study is consistent with studies highlighting the climatic and environmental responsiveness of disease transmission systems
| [40] | Kumar S, Singh R, Kumari N, Karmakar S, Behera M, Siddiqui AJ, et al. Current understanding of the influence of environmental factors on SARS-CoV-2 transmission, persistence, and infectivity. Environ Sci Pollut Res. 2021; 28: 6267–88. https://doi.org/10.1007/s11356-020-12165-1 |
[40]
. This study shows the short-term and long-term effects of the climate variables on malaria incidence.
Short-term dynamics, as captured by lagged differenced variables, offer insight into how past values influence present behaviour. The coefficient for malaria, dl1, is 0.091, indicating that past changes in malaria cases among children under five years have contributed positively to current malaria trends. This suggests a degree of persistence in malaria transmission, where high case numbers in previous periods may carry forward. The findings of this study are in line with the study conducted in Uganda by Andolina, which found out that individuals with asymptomatic infections were important drivers of malaria transmission
| [41] | Andolina C, Rek JC, Briggs J, Okoth J, Musiime A, Ramjith J, et al. Sources of persistent malaria transmission in a setting with effective malaria control in eastern Uganda: a longitudinal, observational cohort study. Lancet Infect Dis. 2021; 21: 1568–78. https://doi.org/10.1016/s1473-3099(21)00072-4 |
[41]
.
Rainfall.dl1 has a coefficient of 0.061, highlighting the role of recent rainfall patterns in shaping current climatic conditions, which can, in turn, affect mosquito breeding habitats and the risk of malaria transmission. These findings are in line with those of Fall et al. and those of Mirzajonova et al. who emphasized the impact of rainfall patterns on vector-borne disease transmission
| [42] | Fall P, Diouf I, Deme A, Diouf S, Sene D, Sultan B, et al. Enhancing Understanding of the Impact of Climate Change on Malaria in West Africa Using the Vector-Borne Disease Community Model of the International Center for Theoretical Physics (VECTRI) and the Bias-Corrected Phase 6 Coupled Model Intercomparison Proj. Microbiol Res (Pavia). 2023; 14: 2148–80. https://doi.org/10.3390/microbiolres14040145 |
| [43] | Mirzajonova M, Abdullayeva Z. THE IMPACT OF CLIMATE CHANGE ON HUMAN HEALTH 2025; 2: 9–14.
https://doi.org/10.5281/зенодо.15171948 |
[42, 43]
. Notably, the coefficient for min_temp.dl1 is 0.810, a substantial value that reflects strong short-term autocorrelation. This implies that changes in minimum temperature are heavily influenced by past temperatures, indicating stable temperature trends over time. In contrast, the coefficient for max_temp.dl1 is -0.259, indicating an inverse short-term relationship, where increases in maximum temperature during previous periods are associated with decreases in the current period, possibly due to, compensatory seasonal or weather-related effects
| [44] | Wang Z, Liu Y, Li Y, Wang G, Lourenço J, Kraemer M, et al. The relationship between rising temperatures and malaria incidence in Hainan, China, from 1984 to 2010: a longitudinal cohort study. Lancet Planet Heal. 2022; 6: e350–8.
https://doi.org/10.1016/s2542-5196(22)00039-0 |
| [45] | Agyekum TP, Botwe PK, Arko-Mensah J, Issah I, Acquah AA, Hogarh JN, et al. A systematic review of the effects of temperature on Anopheles mosquito development and survival: implications for malaria control in a future warmer climate. Int J Environ Res Public Health. 2021; 18: 7255.
https://doi.org/10.3390/ijerph18147255 |
[44, 45]
.
While temperature is an important factor for mosquito and parasite development, its relatively consistent pattern suggests that it serves more as a permissive background condition rather than a triggering factor in the seasonal rise of malaria cases among children under five years. These findings, however, contradict the findings by Azerigyik et al. that intricate the interdependence between the virus, larval habitat temperatures, and vector competence necessitate increased efforts in addressing RVFV disease burden
| [46] | Azerigyik FA, Cagle SM, Wilson WC, Mitzel DN, Kading RC. The Temperature-Associated Effects of Rift Valley Fever Virus Infections in Mosquitoes and Climate-Driven Epidemics: A Review. Viruses. 2025; 17: 217.
https://doi.org/10.3390/v17020217 |
[46]
.
Notably, the years 2020 and 2021, which coincided with the global Coronavirus Disease 2019 (COVID-19) pandemic, presented anomalies in the malaria trend, with either flatter peaks or delayed increases. These deviations may reflect disruptions in healthcare services, reduced access to malaria testing and treatment, or interruptions in vector control programmes such as indoor residual spraying and the distribution of insecticide-treated nets.
The NDVI variable displays the most affected short-term response, with a coefficient of 140.100. This large value underscores the sensitivity of vegetation dynamics to prior changes. The NDVI, a proxy for vegetation health and density, responds strongly to seasonal and climatic changes, such as rainfall and temperature shifts
| [47] | Mehmood K, Anees SA, Muhammad S, Hussain K, Shahzad F, Liu Q, et al. Analyzing vegetation health dynamics across seasons and regions through NDVI and climatic variables. Sci Rep. 2024; 14: 11775.
https://doi.org/10.1038/s41598-024-62464-7 |
[47]
. Its high coefficient highlights the importance of environmental cues in driving vegetation patterns, which may indirectly influence malaria transmission by affecting mosquito habitat availability. These findings concur with the findings of Omeye Francis and Smith, which highlight how climate change and habitat alterations could further complicate transmission dynamics by expanding suitable habitats and disrupting seasonal patterns
| [48] | Omeye Francis I. Ecosystem Variability and Malaria Transmission: The Role of Environmental Factors in Vector Dynamics. |
| [49] | Smith DC, Schäfer SM, Golding N, Nunn MA, White SM, Callaghan A, et al. Vegetation structure drives mosquito community composition in UK’s largest managed lowland wetland. Parasit Vectors. 2024; 17: 201.
https://doi.org/10.1186/s13071-024-06280-y |
[48, 49]
. These results collectively demonstrate the interconnectedness of climatic, environmental, and health variables, aligning with ecological frameworks that view disease patterns through environmental and climatic lenses
| [50] | Singh S, Sharma P, Pal N, Sarma DK, Tiwari R, Kumar M. Holistic one health surveillance framework: synergizing environmental, animal, and human determinants for enhanced infectious disease management. ACS Infect Dis. 2024; 10: 808–26. https://doi.org/10.1021/acsinfecdis.3c00625 |
| [51] | Sherman JD, Thiel C, MacNeill A, Eckelman MJ, Dubrow R, Hopf H, et al. The green print: advancement of environmental sustainability in healthcare. Resour Conserv Recycl. 2020; 161: 104882. https://doi.org/10.1016/j.resconrec.2020.104882 |
[50, 51]
.
In summary, the findings show that the system under study operates with both long-run correction mechanisms and short-term feedback loops. While malaria cases among children under five years are slow to adjust toward equilibrium, they are significantly influenced by previous values and climatic variables. Rainfall, temperature, and the NDVI display more dynamic short-term behaviour and play a critical role in restoring long-term balance. These relationships have important implications for disease modeling and public health planning. For example, the responsiveness of the NDVI and rainfall suggests their potential as early warning indicators for malaria outbreaks
| [52] | Evans DL, Apel JR. Spaceborne synthetic aperture radar: current status and future directions: a report to the Committee on Earth Sciences, Space Studies Board, National Research Council. 1995. |
| [53] | Evans M V, Bhatnagar S, Drake JM, Murdock CM, Mukherjee S. An integrative approach to mosquito dynamics reveals differences in people’s everyday experiences of mosquitoes. bioRxiv. 2021; 2009–21.
https://doi.org/10.1101/2021.09.06.459057 |
[52, 53]
. Similarly, the strong temporal dependence of temperature trends supports the integration of climate data into surveillance tools. Ultimately, understanding these dynamics is essential for designing effective interventions, forecasting malaria risk, and responding to seasonal and environmental changes in disease-prone regions, especially in settings where climate variability exacerbates public health vulnerabilities
| [54] | Abbasi AS. Climate-Induced Flooding Contributes to Infectious and Zoonotic Disease Transmission: A Case Study of 2022 Floods in Pakistan. School of Social Sciences & Humanities, S3H-NUST; 2024. |
| [55] | Babanejaddehaki G, An A, Papagelis M. Disease Outbreak Detection and Forecasting: A Review of Methods and Data Sources. ACM Trans Comput Healthc. 2025; 6: 1–40.
https://doi.org/10.1145/370854 |
[54, 55]
.
6. Conclusions
The study reveals significant short-term and long-term interactions among malaria cases among children under five years, rainfall, temperature, and NDVI. The presence of statistically significant error correction terms indicates that the system adjusts to restore equilibrium following deviations, with malaria cases among children under five years exhibiting a modest but consistent correction. Lagged coefficients show that past changes, particularly in minimum temperature and NDVI, exert a strong influence on current conditions. These findings underscore the role of climatic and ecological variables in shaping malaria dynamics and highlight the potential for integrated models that incorporate seasonal and environmental patterns. Such models are essential for guiding timely and effective public health interventions, particularly in regions vulnerable to climate-sensitive diseases like malaria.
The significant influence of lagged climatic factors and vegetation indices on malaria incidence supports the integration of environmental monitoring into disease surveillance and early warning systems. In particular, the strong associations observed between the NDVI and malaria underscore the potential for vegetation-based indices to serve as predictive tools in malaria forecasting models. Furthermore, the observed temperature dynamics, especially the high autocorrelation in minimum temperatures, highlight the need for temperature-sensitive intervention strategies, especially in regions facing rapid climate change.
Ultimately, this study emphasizes the importance of adopting an eco-epidemiological approach for malaria control and prevention. By understanding the temporal and equilibrium dynamics between environmental factors and disease patterns, policymakers and health planners can develop more targeted, data-driven responses to malaria outbreaks. These insights are especially pertinent for regions vulnerable to climate variability, where proactive, climate-informed public health strategies can significantly reduce the burden of malaria and increase the resilience of affected communities.
Abbreviations
VECM | Vector Error Correction Model |
DHIS2 | District Health Information System Two. |
MODIS | Moderate Resolution Imaging Spectroradiometer |
NDVI | Normalized Difference Vegetation Index |
CHIRPS | Climate Hazards Group InfraRed Precipitation with Station Data |
ECT | Error Correction Term |
VECM | Vector Error Correction Model |
DRC | Democratic Republic of Congo |
UNMA | Uganda National Meteorological Authority |
MoH | Ministry of Health |
Author Contributions
Okello George Robert: Conceptualization, Resources, Writing – original draft
Robert Wamala: Supervision, Validation, Writing – review & editing
Hellen Namawejje: Supervision, Writing – review & editing
John Rek: Writing – review & editing
Sendege Susan Hebert: Data curation, Methodology
Funding
This research was funded by Makerere University Research and Innovations Fund.
Data Availability Statement
The data is available from the corresponding author upon reasonable request.
Conflicts of Interest
The authors declare no conflicts of interest for this research.
References
| [1] |
Thellier M, Gemegah AAJ, Tantaoui I. Global fight against malaria: goals and achievements 1900–2022. J Clin Med. 2024; 13: 5680.
https://doi.org/10.3390/jcm13195680
|
| [2] |
World Malaria Report. 2021.
|
| [3] |
Sugiarto SR. A study of pharmacokinetic properties of artemisinin combination therapy for malaria in specific populations. 2023.
|
| [4] |
Sumpter J. Analysis of malarial impact: understanding disease transmission, epidemiology, and effects on fetal life. 2024;
https://spiral.lynn.edu/etds/426
|
| [5] |
Lukindu M. Molecular Tools and Genetic Approaches for Studying the Genetic Structure of Major Malaria Vectors in Sub-Saharan Africa. University of Notre Dame; 2020.
|
| [6] |
Abdishu M, Gobena T, Damena M, Abdi H, Birhanu A. Determinants of Malaria Morbidity Among School-Aged Children Living in East Hararghe Zone, Oromia, Ethiopia: A Community-Based Case–Control Study. Pediatr Heal Med Ther. 2022; Volume 13: 183–93.
https://doi.org/10.2147/PHMT.S347621
|
| [7] |
Debash H, Alemayehu E, Belete MA, Ebrahim H, Mohammed O, Gebretsadik D, et al. Prevalence and associated factors of malaria among the displaced population in refugee camps in Africa: a systematic review and meta-analysis. Malar J. 2025; 24: 15.
https://doi.org/10.1186/s12936-025-05246-4
|
| [8] |
Panzi EK, Okenge LN, Kabali EH, Tshimungu F, Dilu AK, Mulangu F, et al. Geo-climatic factors of malaria morbidity in the Democratic Republic of Congo from 2001 to 2019. Int J Environ Res Public Health. 2022; 19: 3811.
https://doi.org/10.3390/ijerph19073811
|
| [9] |
Sarfo JO, Amoadu M, Kordorwu PY, Adams AK, Gyan TB, Osman A-G, et al. Malaria amongst children under five in sub-Saharan Africa: a scoping review of prevalence, risk factors and preventive interventions. Eur J Med Res. 2023; 28: 80.
https://doi.org/10.1186/s40001-023-01046-1
|
| [10] |
Kooko R, Wafula ST, Orishaba P. Socioeconomic determinants of malaria prevalence among under five children in Uganda: Evidence from 2018-19 Uganda Malaria Indicator Survey. J Vector Borne Dis. 2023; 60: 38–48.
https://doi.org/10.4103/0972-9062.353251
|
| [11] |
Longo-Pendy N-M, Sevidzem SL, Makanga BK, Ndotit-Manguiengha S, Boussougou-Sambe ST, Obame Ondo Kutomy P, et al. Assessment of environmental and spatial factors influencing the establishment of Anopheles gambiae larval habitats in the malaria endemic province of Woleu-Ntem, northern Gabon. Malar J. 2024; 23: 158.
https://doi.org/10.1186/s12936-024-04980-5
|
| [12] |
Ahmed A. An estimation of Severe Malaria prevalence in Children aged 0-59 months in Uganda: A Secondary Analysis of Uganda’s Malaria Indicator Survey 2019. 2021.
|
| [13] |
Zalwango MG, Bulage L, Zalwango JF, Migisha R, Agaba BB, Kadobera D, et al. Trends and Distribution of Severe Malaria Cases, Uganda, 2017–2021: Analysis of Health Management Information System Data. Uganda Natl Inst Public Heal Q Epidemiol Bull. 2023; 8: 2.
|
| [14] |
Chandra G, Mukherjee D. Effect of climate change on mosquito population and changing pattern of some diseases transmitted by them. Adv Anim Exp Model. Elsevier; 2022. p. 455–60.
https://doi.org/10.1016/B978-0-323-90583-1.00030-1
|
| [15] |
Megersa DM, Luo X-S. Effects of Climate Change on Malaria Risk to Human Health: A Review. Atmosphere (Basel). 2025; 16: 71.
https://doi.org/10.3390/atmos16010071
|
| [16] |
Tulak N, Handoko H, Hidayati R, Kesumawati U, Hakim L. Effect of climatic factors and habitat characteristics on Anopheles larval density. J Kesehat Masy. 2018; 13: 345–55.
https://doi.org/10.15294/kemas.v13i3.11560
|
| [17] |
Eikenberry SE, Gumel AB. Mathematical modeling of climate change and malaria transmission dynamics: a historical review. J Math Biol. 2018; 77: 857–933.
https://doi.org/10.1007/s00285-018-1229-7
|
| [18] |
Estupiñán Méndez JD. Analysis of Biotic and Abiotic Factors on the Life History Traits of Anopheles Mosquitoes. 2024;
https://doi.org/10.18452/29153.
|
| [19] |
de Souza WM, Weaver SC. Effects of climate change and human activities on vector-borne diseases. Nat Rev Microbiol. 2024; 22: 476–91.
|
| [20] |
Ndyamuhaki Y. Ecological determinants of malaria incidence and its regional prevalence variation among children under five years old in Uganda. 2024;
http://hdl.handle.net/1807/139557
|
| [21] |
Palaniyandi M. The environmental Risk Factors Significant to Anopheles Species Vector Mosquito Profusion, P. falciparum, P. vivax Parasite Development, and Malaria Transmission, Using Remote Sensing and Gis. Indian J Public Heal Res Dev. 2021; 12.
|
| [22] |
Kempter E, Upadhayay NB. Uncovering the role of education in the uptake of preventive measures against malaria in the african population. University of Tübingen Working Papers in Business and Economics; 2022.
http://dx.doi.org/10.15496/publikation-72149
|
| [23] |
Ozawa S, Evans DR, Higgins CR, Laing SK, Awor P. Development of an agent-based model to assess the impact of substandard and falsified anti-malarials: Uganda case study. Malar J. 2019; 18: 1–14.
https://doi.org/10.1186/s12936-018-2628-3
|
| [24] |
Asenso‐Okyere K, Asante FA, Tarekegn J, Andam KS. A review of the economic impact of malaria in agricultural development. Agric Econ. 2011; 42: 293–304.
https://doi.org/10.1111/j.1574-0862.2010.00515.x
|
| [25] |
Finn K. Pediatric Survivors of Severe Malaria: Academic Performance Following a Cognitive Intervention in Uganda. 2018.
https://hdl.handle.net/2027.42/144150
|
| [26] |
Moraga Fernández M. Malaria and Economic Development in Sub-Saharan Africa: Long-lasting Effects on Cognitive Abilities. 2018;
https://lup.lub.lu.se/student-papers/record/8951978
|
| [27] |
Musoke D, Atusingwize E, Namata C, Ndejjo R, Wanyenze RK, Kamya MR. Integrated malaria prevention in low-and middle-income countries: a systematic review. Malar J. 2023; 22: 79.
https://doi.org/10.1186/s12936-023-04500-x
|
| [28] |
Obeagu EI, Obeagu GU. Adapting to the shifting landscape: Implications of climate change for malaria control: A review. Medicine (Baltimore). 2024; 103: e39010.
https://doi.org/10.1097/MD.0000000000039010
|
| [29] |
Granger CWJ, Newbold P. Spurious regressions in econometrics. J Econom. 1974; 2: 111–20.
https://doi.org/10.3390/math9222839
|
| [30] |
Fors A, Markiewicz O. Swedish Equities: Casanovas or commited Cointegrated partners. 2016.
|
| [31] |
Allen WB. Antwerp, 74 Atkin, John, 38 Augmented Dickey-Fuller Unit root test, 57, 146-7. balance. 146: 7.
https://doi.org/10.1017/9781108878333.019
|
| [32] |
Asghar Z, Abid I. Performance of lag length selection criteria in three different situations. 2007;
https://mpra.ub.uni-muenchen.de/40042
|
| [33] |
Zivot E, Wang J. Vector autoregressive models for multivariate time series. Model Financ time Ser with S-PLUS®. 2006; 385–429.
|
| [34] |
Johansen S. Statistical analysis of cointegration vectors. J Econ Dyn Control. 1988; 12: 231–54.
https://doi.org/10.1016/0165-1889(88)90041-3
|
| [35] |
Johansen S. Estimation and hypothesis testing of cointegration vectors in Gaussian vector autoregressive models. Econom J Econom Soc. 1991; 1551–80.
https://doi.org/10.2307/2938278
|
| [36] |
Begum A. Climate change and emerging infectious diseases: Investigating the influence on transmission dynamics of vector-borne diseases. Saudi J Med Pharm Sci. 2024; 10: 766–75.
https://doi.org/10.36348/sjmps.2024.v10i10.009
|
| [37] |
Nosrat C, Altamirano J, Anyamba A, Caldwell JM, Damoah R, Mutuku F, et al. Impact of recent climate extremes on mosquito-borne disease transmission in Kenya. PLoS Negl Trop Dis. 2021; 15: e0009182.
https://doi.org/10.1371/journal.pntd.0009182
|
| [38] |
Smith DL, Laydon DJ, Chakradeo K, Khurana MP, Okiring J, Duchene DA, et al. Climate Change and Malaria: A Call for Robust Analytics. 2024;
https://doi.org/10.1101/2024.09.16.24313623
|
| [39] |
Ochomba WN. A Mathematical Model For The Control Of Malaria With Temporary Immunity. 2013.
|
| [40] |
Kumar S, Singh R, Kumari N, Karmakar S, Behera M, Siddiqui AJ, et al. Current understanding of the influence of environmental factors on SARS-CoV-2 transmission, persistence, and infectivity. Environ Sci Pollut Res. 2021; 28: 6267–88.
https://doi.org/10.1007/s11356-020-12165-1
|
| [41] |
Andolina C, Rek JC, Briggs J, Okoth J, Musiime A, Ramjith J, et al. Sources of persistent malaria transmission in a setting with effective malaria control in eastern Uganda: a longitudinal, observational cohort study. Lancet Infect Dis. 2021; 21: 1568–78.
https://doi.org/10.1016/s1473-3099(21)00072-4
|
| [42] |
Fall P, Diouf I, Deme A, Diouf S, Sene D, Sultan B, et al. Enhancing Understanding of the Impact of Climate Change on Malaria in West Africa Using the Vector-Borne Disease Community Model of the International Center for Theoretical Physics (VECTRI) and the Bias-Corrected Phase 6 Coupled Model Intercomparison Proj. Microbiol Res (Pavia). 2023; 14: 2148–80.
https://doi.org/10.3390/microbiolres14040145
|
| [43] |
Mirzajonova M, Abdullayeva Z. THE IMPACT OF CLIMATE CHANGE ON HUMAN HEALTH 2025; 2: 9–14.
https://doi.org/10.5281/зенодо.15171948
|
| [44] |
Wang Z, Liu Y, Li Y, Wang G, Lourenço J, Kraemer M, et al. The relationship between rising temperatures and malaria incidence in Hainan, China, from 1984 to 2010: a longitudinal cohort study. Lancet Planet Heal. 2022; 6: e350–8.
https://doi.org/10.1016/s2542-5196(22)00039-0
|
| [45] |
Agyekum TP, Botwe PK, Arko-Mensah J, Issah I, Acquah AA, Hogarh JN, et al. A systematic review of the effects of temperature on Anopheles mosquito development and survival: implications for malaria control in a future warmer climate. Int J Environ Res Public Health. 2021; 18: 7255.
https://doi.org/10.3390/ijerph18147255
|
| [46] |
Azerigyik FA, Cagle SM, Wilson WC, Mitzel DN, Kading RC. The Temperature-Associated Effects of Rift Valley Fever Virus Infections in Mosquitoes and Climate-Driven Epidemics: A Review. Viruses. 2025; 17: 217.
https://doi.org/10.3390/v17020217
|
| [47] |
Mehmood K, Anees SA, Muhammad S, Hussain K, Shahzad F, Liu Q, et al. Analyzing vegetation health dynamics across seasons and regions through NDVI and climatic variables. Sci Rep. 2024; 14: 11775.
https://doi.org/10.1038/s41598-024-62464-7
|
| [48] |
Omeye Francis I. Ecosystem Variability and Malaria Transmission: The Role of Environmental Factors in Vector Dynamics.
|
| [49] |
Smith DC, Schäfer SM, Golding N, Nunn MA, White SM, Callaghan A, et al. Vegetation structure drives mosquito community composition in UK’s largest managed lowland wetland. Parasit Vectors. 2024; 17: 201.
https://doi.org/10.1186/s13071-024-06280-y
|
| [50] |
Singh S, Sharma P, Pal N, Sarma DK, Tiwari R, Kumar M. Holistic one health surveillance framework: synergizing environmental, animal, and human determinants for enhanced infectious disease management. ACS Infect Dis. 2024; 10: 808–26.
https://doi.org/10.1021/acsinfecdis.3c00625
|
| [51] |
Sherman JD, Thiel C, MacNeill A, Eckelman MJ, Dubrow R, Hopf H, et al. The green print: advancement of environmental sustainability in healthcare. Resour Conserv Recycl. 2020; 161: 104882.
https://doi.org/10.1016/j.resconrec.2020.104882
|
| [52] |
Evans DL, Apel JR. Spaceborne synthetic aperture radar: current status and future directions: a report to the Committee on Earth Sciences, Space Studies Board, National Research Council. 1995.
|
| [53] |
Evans M V, Bhatnagar S, Drake JM, Murdock CM, Mukherjee S. An integrative approach to mosquito dynamics reveals differences in people’s everyday experiences of mosquitoes. bioRxiv. 2021; 2009–21.
https://doi.org/10.1101/2021.09.06.459057
|
| [54] |
Abbasi AS. Climate-Induced Flooding Contributes to Infectious and Zoonotic Disease Transmission: A Case Study of 2022 Floods in Pakistan. School of Social Sciences & Humanities, S3H-NUST; 2024.
|
| [55] |
Babanejaddehaki G, An A, Papagelis M. Disease Outbreak Detection and Forecasting: A Review of Methods and Data Sources. ACM Trans Comput Healthc. 2025; 6: 1–40.
https://doi.org/10.1145/370854
|
Cite This Article
-
APA Style
Robert, O. G., Wamala, R., Namawejje, H., Rek, J., Hebert, S. S. (2026). Temporal Patterns of Climate Variability and Malaria Incidences Among Children (0-5) Years in Uganda: A Time Series Analysis. Ecology and Evolutionary Biology, 11(3), 62-78. https://doi.org/10.11648/j.eeb.20261103.13
 Copy
|
Copy
|
 Download
ACS Style
Robert, O. G.; Wamala, R.; Namawejje, H.; Rek, J.; Hebert, S. S. Temporal Patterns of Climate Variability and Malaria Incidences Among Children (0-5) Years in Uganda: A Time Series Analysis. Ecol. Evol. Biol. 2026, 11(3), 62-78. doi: 10.11648/j.eeb.20261103.13
Copy
|
Download
AMA Style
Robert OG, Wamala R, Namawejje H, Rek J, Hebert SS. Temporal Patterns of Climate Variability and Malaria Incidences Among Children (0-5) Years in Uganda: A Time Series Analysis. Ecol Evol Biol. 2026;11(3):62-78. doi: 10.11648/j.eeb.20261103.13
Copy
|
Download
-
@article{10.11648/j.eeb.20261103.13,
  author = {Okello George Robert and Robert Wamala and Hellen Namawejje and John Rek and Sendege Susan Hebert},
  title = {Temporal Patterns of Climate Variability and Malaria Incidences Among Children (0-5) Years in Uganda: A Time Series Analysis},
  journal = {Ecology and Evolutionary Biology},
  volume = {11},
  number = {3},
  pages = {62-78},
  doi = {10.11648/j.eeb.20261103.13},
  url = {https://doi.org/10.11648/j.eeb.20261103.13},
  eprint = {https://article.sciencepublishinggroup.com/pdf/10.11648.j.eeb.20261103.13},
  abstract = {Background: Malaria remains a major public health challenge in Uganda, particularly among children under five years of age. Between 2019 and 2023, the prevalence increased with age, from 3% in infants under six months to 12% in children aged 48–59 months, and was markedly higher in rural areas (11%) than in urban areas (3%). However, analysis of the data on malaria has been focused on a single variable, while the impact of climate variation on malaria is over several factors and over time. This study assesses the temporal patterns of climate variability and malaria incidence among children aged 0–5 years in Uganda using a time series analysis. Methods: The study analysed 150 monthly time series records from 2015 to 2022. It used the Vector Error Correction Model (VECM), which allows examination of both short-term changes and long-term relationships among variables. The variables included confirmed malaria cases in children under five years, rainfall, minimum and maximum temperatures, and vegetation cover. Data were obtained from the Ministry of Health/DHIS2, NASA Earth Data, CHIRPS, and NASA EOSDIS. Results: The results revealed significant long-term relationships and short-term feedback mechanisms between malaria incidence and climatic factors. The error correction term (ECT) for malaria was -0.006, indicating a slow adjustment to equilibrium. In contrast, rainfall, minimum temperature, and the Normalized Difference Vegetation Index (NDVI) showed correction behaviours, adjusting upward following deviations. Short-term changing aspects revealed that previous values of malaria cases among children under five years (coefficient = 0.091) and rainfall (coefficient = 0.061) positively influenced current malaria trends. The minimum temperature displayed strong autocorrelation (coefficient = 0.810), whereas the NDVI showed a large short-term response (coefficient = 140.100), highlighting its sensitivity to environmental shifts. Maximum temperature had a negative short-term association with malaria incidences (coefficient = -0.259), suggesting inverse seasonal effects. Conclusions: The study reveals significant short-term and long-term interactions among malaria cases among children under five years, rainfall, temperature, and NDVI. The presence of statistically significant error correction terms indicates that the system adjusts to restore equilibrium following deviations, with malaria cases among children under five years exhibiting consistent correction. Lagged coefficients show that past changes, particularly in minimum temperature and NDVI, exert a strong influence on current conditions.},
 year = {2026}
}
Copy
|
Download
-
TY  - JOUR
T1  - Temporal Patterns of Climate Variability and Malaria Incidences Among Children (0-5) Years in Uganda: A Time Series Analysis
AU  - Okello George Robert
AU  - Robert Wamala
AU  - Hellen Namawejje
AU  - John Rek
AU  - Sendege Susan Hebert
Y1  - 2026/08/22
PY  - 2026
N1  - https://doi.org/10.11648/j.eeb.20261103.13
DO  - 10.11648/j.eeb.20261103.13
T2  - Ecology and Evolutionary Biology
JF  - Ecology and Evolutionary Biology
JO  - Ecology and Evolutionary Biology
SP  - 62
EP  - 78
PB  - Science Publishing Group
SN  - 2575-3762
UR  - https://doi.org/10.11648/j.eeb.20261103.13
AB  - Background: Malaria remains a major public health challenge in Uganda, particularly among children under five years of age. Between 2019 and 2023, the prevalence increased with age, from 3% in infants under six months to 12% in children aged 48–59 months, and was markedly higher in rural areas (11%) than in urban areas (3%). However, analysis of the data on malaria has been focused on a single variable, while the impact of climate variation on malaria is over several factors and over time. This study assesses the temporal patterns of climate variability and malaria incidence among children aged 0–5 years in Uganda using a time series analysis. Methods: The study analysed 150 monthly time series records from 2015 to 2022. It used the Vector Error Correction Model (VECM), which allows examination of both short-term changes and long-term relationships among variables. The variables included confirmed malaria cases in children under five years, rainfall, minimum and maximum temperatures, and vegetation cover. Data were obtained from the Ministry of Health/DHIS2, NASA Earth Data, CHIRPS, and NASA EOSDIS. Results: The results revealed significant long-term relationships and short-term feedback mechanisms between malaria incidence and climatic factors. The error correction term (ECT) for malaria was -0.006, indicating a slow adjustment to equilibrium. In contrast, rainfall, minimum temperature, and the Normalized Difference Vegetation Index (NDVI) showed correction behaviours, adjusting upward following deviations. Short-term changing aspects revealed that previous values of malaria cases among children under five years (coefficient = 0.091) and rainfall (coefficient = 0.061) positively influenced current malaria trends. The minimum temperature displayed strong autocorrelation (coefficient = 0.810), whereas the NDVI showed a large short-term response (coefficient = 140.100), highlighting its sensitivity to environmental shifts. Maximum temperature had a negative short-term association with malaria incidences (coefficient = -0.259), suggesting inverse seasonal effects. Conclusions: The study reveals significant short-term and long-term interactions among malaria cases among children under five years, rainfall, temperature, and NDVI. The presence of statistically significant error correction terms indicates that the system adjusts to restore equilibrium following deviations, with malaria cases among children under five years exhibiting consistent correction. Lagged coefficients show that past changes, particularly in minimum temperature and NDVI, exert a strong influence on current conditions.
VL  - 11
IS  - 3
ER  -
Copy
|
Download

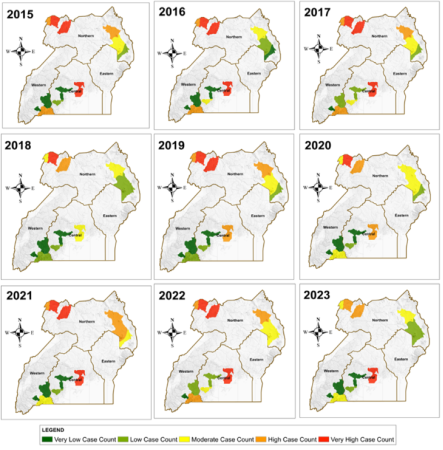
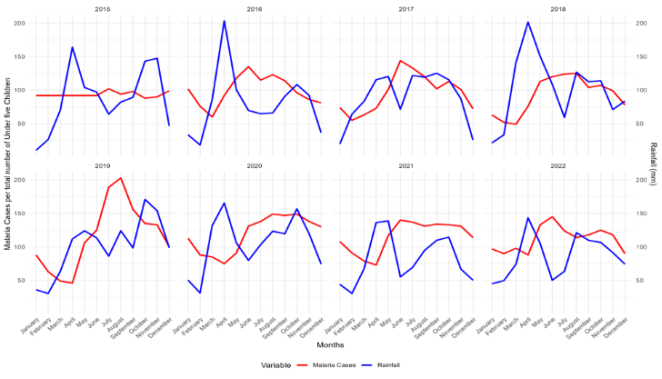
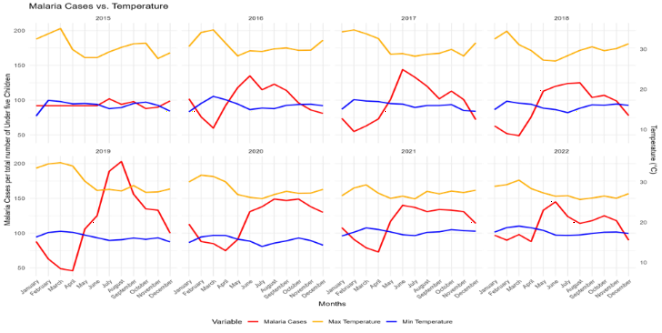
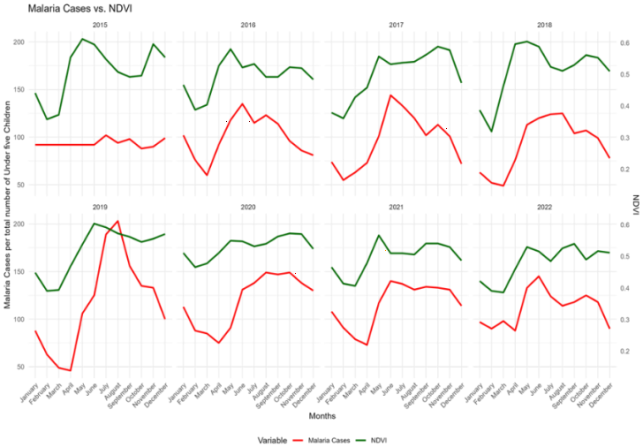




 Share This Article
 Twitter
 Linked In
 Facebook