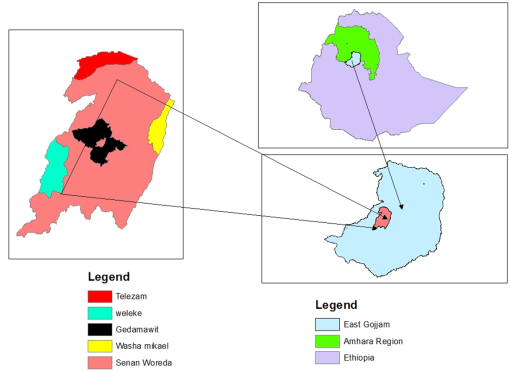
Commercializing smallholder farmers in the fruit production is an indispensable path to boost the household income and economic growth in Ethiopia. Apple is the main source of income in Sinan district. However, the district faces various production and marketing problems of apple. Therefore, the study was designed to analysis market chain of apple specifically to identify the determinants of apple supply to the market and to assess of market structure, conduct and performance of apple in Sinan district, East Gojjam zone, Ethiopia. The study used data from primary and secondary sources. A random sampling procedure was used to draw a sample of 121 apple producers. Multiple linear regression model and marketing margin were used to analysis the collected data. The market concentration ratio (37.8%) of the four largest firms was shown that the market structure were weak oligopolistic nature in the study area. The market margin shows that retailers were taken the highest market margin from the available actors. The output of OLS model shows that man equivalent, land size, market distance, access to market information, experience and frequency of extension contact were the key variables influencing the amount of apple provided to the market. The authors suggest that the government and concerned bodies should develop market information delivery system, aware farmers to use land efficiently and wisely, build better roads in apple growing areas and allow access for transport vehicles to cut down transportation expense and product damage during the route to market.
| Published in | Innovation Economics (Volume 1, Issue 1) |
| DOI | 10.11648/j.iecon.20260101.17 |
| Page(s) | 64-80 |
| Creative Commons |
This is an Open Access article, distributed under the terms of the Creative Commons Attribution 4.0 International License (http://creativecommons.org/licenses/by/4.0/), which permits unrestricted use, distribution and reproduction in any medium or format, provided the original work is properly cited. |
| Copyright |
Copyright © The Author(s), 2026. Published by Science Publishing Group |
Apple, Marketing Chain, Multiple Linear Regression, Sinan District
Sample kebele | Number of apple producer HHH | Sample household | Proportion in% |
|---|---|---|---|
Gedamawit | 516 | 39 | 32 |
WashaMikael | 220 | 17 | 14 |
Telezam | 396 | 30 | 25 |
Wolekie | 472 | 35 | 29 |
Total | 1604 | 121 | 100 |
Variable | Notation | Type of variable | Measurement | Expected effect |
|---|---|---|---|---|
Quantity supplied to the market | QS | Continuous | Quintal | |
Independent variable | ||||
Land alloted for apple | LAND | Continuous | Hectare | +ve |
Distance to the nearest market | DSTMKT | Continuous | Walking hours | -ve |
Access to market information | ACCMKT | Dummy | 1if yes, 0 no | +ve |
Sex of the household head | SEX | Dummy | 1 if male, 0 otherwise | +ve |
Family size | FAMSZ | Continuous | Man equivalent | +ve |
Age of the household head | AGHH | Continuous | Year | -ve/+ve |
Off/non-farm income | OFFIN | Dummy | 1if yes, 0 no | +ve |
Livestock holding | TLU | Continuous | tropical livestock unit | +ve |
Frequency of extension contact | FEXC | Continuous | Number | +ve |
Distance from training center | DSFTC | Continuous | Walking minutes | -ve |
Level of education of the household head | EDU | Categorical | 0 if not read and write, 1 if read and write, 2 if attend primary school, 3 if attend secondary school, 4 attends preparatory and above | +ve |
Variable | Frequency | Percent | |||
|---|---|---|---|---|---|
Sex of household head | Male | 105 | 87.5 | ||
Female | 15 | 12.5 | |||
Total | 120 | 100 | |||
Marital status | Single | 0 | 0 | ||
Married | 12 | 93.3 | |||
Divorced | 6 | 5 | |||
Windowed | 2 | 1.7 | |||
Total | 120 | 100 | |||
Educational level | Do not write and read | 51 | 42.5 | ||
Write and read | 46 | 38.3 | |||
Primary school | 15 | 12.5 | |||
Secondary school | 8 | 6.7 | |||
Total | 120 | 100 | |||
Non/off farm income | Yes | 20 | 16.3 | ||
No | 100 | 83.3 | |||
Total | 120 | 100 | |||
Variable | N | Minimum | Maximum | Mean | Std. Deviation |
Age | 120 | 26 | 75 | 48.91 | 9.933 |
family size | 120 | 1.3 | 8 | 3.92 | 1.605 |
Experience | 120 | 4 | 12 | 7.3 | 1.858 |
Variable | Collector | Wholesaler | Retailer | Total | |||||
|---|---|---|---|---|---|---|---|---|---|
N | % | N | % | N | % | N | % | ||
Sex | Female | - | 4 | 57.1 | 13 | 72.2 | 17 | 60.7 | |
Male | 3 | 100 | 3 | 42.9 | 5 | 27.8 | 11 | 39.3 | |
Educational status | Can’t read and write | - | - | - | 3 | 16.7 | 3 | 10.7 | |
Read and write | - | 1 | 14.3 | 3 | 16.7 | 4 | 14.3 | ||
Primary school | 1 | 33.3 | 2 | 28.6 | 1 | 5.6 | 4 | 14.3 | |
Secondary school | - | - | - | - | 7 | 38.9 | 7 | 25 | |
Preparatory and above | 2 | 66.7 | 4 | 57.1 | 4 | 22.2 | 10 | 35.7 | |
Marital status | Single | 3 | 100 | 4 | 57.1 | 6 | 33.3 | 13 | 46.5 |
Married | - | - | 3 | 42.9 | 7 | 38.9 | 10 | 35.7 | |
Divorced | - | - | 2 | 11.1 | 2 | 7.1 | |||
Window | - | - | 3 | 16.7 | 3 | 10.7 | |||
Religion | Christian | 3 | 100 | 7 | 100 | 16 | 88.9 | 26 | 92.9 |
Muslim | - | - | 2 | 11.1 | 2 | 7.1 | |||
Mean | Std | Mean | Std | Mean | Std | Mean | Std | ||
Age | 30.3 | 4.9 | 37.1 | 9.1 | 34.6 | 8.8 | 34.8 | 8.5 | |
Family size | 1.7 | 1.2 | 4 | 1.9 | 2.9 | 1.5 | 3 | 1.7 | |
Apple trade experience | 2.7 | 0.57 | 3.8 | 1.1 | 2.9 | 1.1 | 3 | 1.1 | |
No of trader (X) | % of trader (X/28) | Quantity purchased within a year in quantal (Y) | Total purchase in quantal (Z=X*Y) | % purchase share (Si=Z/5602) | %cumulative ∑Si share |
|---|---|---|---|---|---|
1 | 3.6 | 600.00 | 600.00 | 10.7 | 10.7 |
1 | 3.6 | 540.00 | 540.00 | 9.6 | 20.3 |
1 | 3.6 | 500.00 | 500.00 | 8.9 | 29.2 |
1 | 3.6 | 480.00 | 480.00 | 8.6 | 37.8 |
1 | 3.6 | 450.00 | 450.00 | 8 | 45.8 |
1 | 3.6 | 420.00 | 420.00 | 7.5 | 53.3 |
1 | 3.6 | 400.00 | 400.00 | 7.1 | 60.4 |
1 | 3.6 | 180.00 | 180.00 | 3.2 | 63.6 |
1 | 3.6 | 160.00 | 160.00 | 2.7 | 66.3 |
1 | 3.6 | 150.00 | 150.00 | 2.7 | 69 |
1 | 3.6 | 140.00 | 140.00 | 2.5 | 71.5 |
1 | 3.6 | 130.00 | 130.00 | 2.3 | 73.8 |
1 | 3.6 | 122.00 | 122.00 | 2.2 | 76 |
1 | 3.6 | 114.00 | 114.00 | 2 | 78 |
1 | 3.6 | 112.00 | 112.00 | 2 | 80 |
1 | 3.6 | 110.00 | 110.00 | 2 | 82 |
1 | 3.6 | 106.00 | 106.00 | 1.9 | 83.9 |
1 | 3.6 | 104.00 | 104.00 | 1.9 | 85.8 |
1 | 3.6 | 100.00 | 100.00 | 1.8 | 87.6 |
1 | 3.6 | 97.00 | 97.00 | 1.7 | 89.3 |
1 | 3.6 | 86.00 | 86.00 | 1.5 | 90.8 |
1 | 3.6 | 84.00 | 84.00 | 1.5 | 92.3 |
1 | 3.6 | 80.00 | 80.00 | 1.4 | 93.7 |
1 | 3.6 | 78.00 | 78.00 | 1.4 | 95.1 |
1 | 3.6 | 75.00 | 75.00 | 1.3 | 96.4 |
1 | 3.6 | 70.00 | 70.00 | 1.2 | 97.6 |
1 | 3.6 | 64.00 | 64.00 | 1.1 | 98.7 |
1 | 3.6 | 50.00 | 50.00 | 0.9 | 99.6 |
28 | 100.0 | 5602 | 5602 | 100 | 100 |
Entry barrier | Collector | Wholesaler | Retailer | Total | ||||
|---|---|---|---|---|---|---|---|---|
N | % | N | % | N | % | N | % | |
Lack of capital | 2 | 66.7 | 4 | 57.2 | 9 | 50 | 15 | 53.6 |
computation of un licensed trader | - | - | 1 | 14.3 | 3 | 16.6 | 4 | 14.3 |
lack of continuous supply | 1 | 33.3 | 5 | 71.4 | 3 | 16.6 | 9 | 32.1 |
Cost item in birr | Collector | Wholesaler | Retailer |
|---|---|---|---|
Packaging material cost | 13 | 55 | 23 |
Labor cost for packaging | - | 8 | - |
Loading and unloading cost | 10 | 10 | 8 |
Transport cost | 17 | 28 | 16 |
Storage cost | 49 | ||
Telephone cost | 1 | 1.5 | 0.6 |
License and tax | - | 2.28 | 0.8 |
Wastage loss | 15 | 10.72 | 12 |
Total cost | 56 | 164.5 | 60.4 |
Marketing actors | Birr/qt | I | II | III | IV | V |
|---|---|---|---|---|---|---|
Producer | Selling price | 2681 | 1867 | 1867 | 2059 | 2247 |
GMMP (%) | 100 | 59.4 | 59.4 | 65.5 | 71.5 | |
Collector | Purchasing price | - | 1867 | 1867 | - | - |
Marketing costs | - | 56 | 78 | |||
Selling price | - | 2297 | 2155 | |||
Gross profit | - | 374 | 210 | |||
GMMC | 13.7 | 9.2 | ||||
Wholesaler | Purchasing price | - | - | 2155 | 2059 | |
Marketing cost | 164.5 | 164.5 | ||||
Selling price | 2686 | 2686 | ||||
Gross profit | 366.5 | 462.5 | ||||
GMMW | 16.9 | 20 | ||||
Retailer | Purchasing price | 2297 | 2525 | 2525 | 2247 | |
Marketing cost | 82 | 60.4 | 60.4 | 96 | ||
Selling price | 3143 | 3143 | 3143 | 3143 | ||
Gross profit | 764 | 5576 | 557.6 | 800 | ||
GMMR | 27 | 20 | 20 | 28.5 | ||
TGMM | 100 | 40.6 | 40.6 | 34.5 | 39.5 |
Variables | Coef. | Robust Std. Err. | T-value | P>t |
|---|---|---|---|---|
Constant | -4.283 | 2.377 | -1.80 | 0.074* |
SEXHH | .286 | 1.018 | 0.28 | 0.779 |
AGHH | -.017 | .029 | -0.57 | 0.572 |
ACCMKT | 1.53 | .733 | 2.08 | 0.040** |
EDU | ||||
read and write | .21 | .834 | 0.25 | 0.801 |
primary school | -1.267 | 1.25 | -1.01 | 0.313 |
secondary school | .857 | 1.379 | 0.62 | 0.536 |
FAMSZ | .695 | .299 | 2.32 | 0.022** |
DSTMKT | -.579 | .236 | -2.45 | 0.016** |
TLU | -.068 | .215 | -0.32 | 0.751 |
OFFIN | .441 | .886 | 0.50 | 0.620 |
LAND | 60.671 | 11.729 | 5.17 | 0.000*** |
FREXC | .763 | .293 | 2.61 | 0.010** |
EXPR | .538 | .276 | 1.95 | 0.053* |
DSFTC | .001 | .015 | 0.09 | 0.929 |
Number of observations | 120 | |||
F (14, 105) | 22.94 | |||
Prob > F | 0.0000 | |||
R-squared | 0.723 |
FAO | Food and Agriculture Organization |
FTC | Farmer Training Center |
NBE | National Bank of Ethiopia |
MLRM | Multiple Linear Regression Model |
OLS | Ordinary Least Square |
SCP | Structure Conduct Performance |
| [1] | Addisu, H. (2016). Value Chain Analysis of Vegetables: The Case of Ejere District, West Shoa Zone, Oromia National Regional State of Ethiopia. MSc Thesis, Haramaya University, Haramaya. |
| [2] | Adugnaw, A. (2017). Analysis of Teff (Eragrostis tef) Market Chain: The Case of Hulet Ej Enese District, East Gojam Zone, Amhara Region, Ethiopia. MSc Thesis, Haramaya University. |
| [3] | Alagh, M. (2014). Assessment of Marketed and Marketable Surplus of Major Foodgrains in Gujarat. Centre for Management in Agriculture Indian Institute of Management, Ahmedabad. |
| [4] | Aklilu, A. (2015). Institutional Context For Soil Resources Management in Ethiopia. a Review. |
| [5] | Alemnew, A. (2010). “Market Chain Analysis of Red Pepper: the case of Bure Woreda, West Gojjam zone, Amhara National Regional State, Ethiopia. MSc Thesis, Haramaya University. |
| [6] | Alfredo Iriarte, Pablo Yáñez, Pablo Villalobos, Carlos Huenchuleo, Ricardo Rebolledo-Leiva. (2021). Carbon footprint of southern hemisphere fruit exported to Europe: The case of Chilean apple to the UK. Journal of Cleaner Production, 293. |
| [7] | Aemro, W. (2018). Vegetable Market Chain Analysis in Mecha District, West Gojjam Zone, Amhara National Regional State. Archives of Current Research International, 15(4), 5-11. |
| [8] | Ayelech, T. (2011). Market Chain Analysis of Fruits for Gomma Woreda, Jimma Zone, Oromia National Regional State. Haramaya University. |
| [9] | Barakade, A., Lokhande, T., & Todkari, G. (2011). Economics of onion cultivation and it’s marketing pattern in Satara District of Maharashtra. International Journal of Agriculture Sciences, 3(3). |
| [10] | Benyam, T., & Abatneh, T. (2019). Value Chain Analysis of Banana in Mizan Aman Town of Benchi Maji Zone, Southwest Ethiopia. International journal of Horticulture, Agriculture and Food science (IJHAF), 3(1). |
| [11] | Berhanu, M. (2011). Avocado value chain analysis in Jimma zone. MSc Thesis, Haramaya University. |
| [12] | Bezabih E. and Hadera, G. (2007). Constraints and opportunities of horticulture production and marketing in Eastern Ethiopia. Dry Lands Coordination Group Report (46). Grensen 9b. Norway. |
| [13] | Birhanu, t. (2017). Analysis of dairy marketing chain: in the case of Gondar city. Amhara region, Ethiopia. University of Gondar. |
| [14] | Debela, A. (2013). Analysis of Onion Marketing: The Case of Fentalle Woreda, East Shewa Zone, Oromia National Regional State, Ethiopia. M. Sc. Thesis, Haramaya University. |
| [15] | Derib, W., Leake, G., & Tihitina, A. (2014). Avocado Producers’ Market Participation in ‘Damot Gale’ and ‘Boloso Bombe’. Journal of Economics and Sustainable Development, 5(15). |
| [16] | Ebrahim Endris. (2018). Analysis of Vegetables Market Chain: The Case of Habru District, North Wollo Zone, Amhara Regional State, Ethiopia. MSc Thesis, Haramaya University. |
| [17] | Fayera, B., & Benyam, T. (2019). Market chain analysis for potato: A case study in Masha District, Southwestern Ethiopia. Journal of Economics and International Business Management, 7(3). |
| [18] | Fetena, S., Sabura, S., Agena, A., Guchie, G., Woldesenbet, F., & Belete, Y. (2014). Survey on Apple Production and Variety Identification in Chencha District of Gamo Gofa Zone, Southern Ethiopia. Journal of Agriculture. |
| [19] | Firdous Ahmad Wan, Dr. Manoj Songara. (2019). Problems and constraints in marketing and production of apple crop in himachal pradesh. european journal of research p. 161-169. |
| [20] | Food and Agriculture Organization of the United Nations (FAO). (2021). World Food and Agriculture - Statistical Yearbook 2021. Rome. |
| [21] | Gebrerufael, G., Mesfin, M., Melkamu, M., & Tora, A. (2014). Empirical Study on Apple Production, Marketing and its Contribution to Household Income in Chencha District of Southern Ethiopia. Scholarly Journal of Agricultural Science. |
| [22] | Getahun, K., Eskinder, y., & Desalegn, A. (2017). Market Chain Analysis of High value Fruits in Bench Maji Zone, Southwest Ethiopia. International Journal of Marketing Studies, 9. |
| [23] | Gizachew, W. (2018). Analysis of Red Pepper Value Chain: The Case of Weberma District, West Gojam Zone of Amhara National Regional State, Ethiopia. MSc Thesis, Haramaya university. |
| [24] | Gousoddin, Miyan, J., & Kumar, A. (2017). Supply Chain Management of Fruits: A Case Study on Marketing Channels of Mango in Bidar District, Karnataka. IRA-International Journal of Management & Social Sciences, 08. |
| [25] | Gujarati, D. (2003). Basic Econometrics. 4th Edition. Tata McGraw-Hill Publishing Company Limited, New Delhi, India. |
| [26] | Hailu, N. (2010). Cereal Market Performance of Mekelle Market, Tigray, Ethiopia. MA thesis, Mekelle University. |
| [27] | Islam, M. M. (2001). Marketing system of marine fish in Bangladish. Bangladish Journal of Agricultural Economics. Bangladish Journal of Agricultural Economics., 127-142. |
| [28] | Kohl, R., & Uhl, J. (2002). Principle of Marketing. New Delhi: S. Chand & Company Ltd. |
| [29] | Kohls, R. L., & Uhl, J. (1985). Marketing of Agricultural Product (fifth edition ed.). NewYork, USA: McMillan. |
| [30] | Lee, C. (2007). SCP, NEIO and Beyond. Nottingham University. |
| [31] | Lemlem Ayichew. (2019). Determinants of Apple Based Agroforestry Technology Adoption in Lay Gayint District Northwestern Ethiopia. International Journal of Research in Agriculture and Forestr, 6(1). |
| [32] | Muluken, M. (2014). Value Chain Analysis of Fruits for Debub Bench Woreda, Bench Maji Zone. MA thesis, Mekelle University. |
| [33] | (National Bank of Ethiopia (NBE), (2021). Annual report of 2020/21. |
| [34] | Nega Mathewos and Samuel Elias. (2016). Supply Chain Analysis of Avocado and Mango Fruits in Gedeo Zone. Industrial Engineering Letters, 6(9). |
| [35] | Ram, B. (2017). Value chain analysis of papaya in Bilaspurdistrict of Chhattisgarch. M. Sc. Thesis. |
| [36] | Shah, V. D., & Makwana, M. (2013). Marketed and Marketable Surplus of Major Food grains in Rajasthan. Sardar Patel University. |
| [37] | Selamawit, M., Dubale, A., Chigign, A., Aklok, Z., & Yonnas, A. (2019). Value chain analysis of fruits: The case of mango and avocado producing smallholder farmers in Gurage Zone, Ethiopia. Journal of Development and Agricultural Economics, 11(5). |
| [38] | Simon Mada Mbovora, Cousin Musvosvi, and Edmore Gasura. (2021). Morphological Diversity among Accessions of Apple Tree (Malus × Domestica Borkh). Advances in Agriculture. |
| [39] | Singh, R., Mishra, S., & Shikh, S. A. (2017). A Study about area and production ofapple in JJammu and kashmr. International Journal For Research In Agricultural And Food Science, 3(4). |
| [40] | Solomon, A., Zemedu, L., & Gebremdhin Berhanu. (2017). Analysis of Market Structure, Conduct and Performance of Beef Cattle: The Case of Dugda District, East Shoa Zone, Oromia Regional State, Ethiopia. Journal of Biology, Agriculture and Healthcare, 7(5). |
| [41] | Tamirat, G., & Muluken, P. (2018). Analysis of Apple Fruit Value Chain in Southern Ethiopia; the Case of Chencha District. Greener Journal of Plant Breeding and Crop Science, 6. |
| [42] | Tilahun, M. (2018). Woolly Apple Aphid, Eriosoma lanigerum Hausmann, Management Using Non Synthetic Insecticides on Apple Orchard Central Highlands of Ethiopia. International Journal of Agriculture and Biosciences. |
| [43] | Wan, F. A., & Songara, i. (2019). Problems and constraints in marketing and production of apple crop in Himachalpradesh. European Journal of Research, 3(-). |
| [44] | Wani, F. A., & Songara, M. (2017). Production and Marketing of Apple in Himachal Pradesh: An Empirical Study. International Journal of Research Culture Society, 1(10). |
| [45] | Wudineh, G., Tesfaye, A., Mamo, T., & Ferede, S. (2018). Apple Value Chain Analysis in the Central Highlands of Ethiopia. International Journal of Agriculture Innovations and Research, 7(1), 134-142. |
| [46] | Yaregal, T. (2018). Potato Market Chain Analysis: The Case of Sekela District, West Gojjam Zone, Amhara National Regional State, Ethiopia. MSc Thesis, Haramaya University, Haramaya. |
| [47] | Yimer, A. (2015). Factors Affecting Fruit Supply in the Market: The Case of Habru Woerda, North Wollo, Ethiopia. European Journal of Business and Management, |
| [48] | Zhichao Wu and Chen Pan. (2021). IOP Conference Series: Earth and Environmental Science. |
APA Style
Ayalew, M. A., Worku, S. S. (2026). Determinants of Market Supply Along the Apple Market Chain: In Case of Sinan District, East Gojjam Zone, Ethiopia. Innovation Economics, 1(1), 64-80. https://doi.org/10.11648/j.iecon.20260101.17
ACS Style
Ayalew, M. A.; Worku, S. S. Determinants of Market Supply Along the Apple Market Chain: In Case of Sinan District, East Gojjam Zone, Ethiopia. Innov. Econ. 2026, 1(1), 64-80. doi: 10.11648/j.iecon.20260101.17
@article{10.11648/j.iecon.20260101.17,
  author = {Mamaru Abebe Ayalew and Seblewongiel Solomon Worku},
  title = {Determinants of Market Supply Along the Apple Market Chain: In Case of Sinan District, East Gojjam Zone, Ethiopia},
  journal = {Innovation Economics},
  volume = {1},
  number = {1},
  pages = {64-80},
  doi = {10.11648/j.iecon.20260101.17},
  url = {https://doi.org/10.11648/j.iecon.20260101.17},
  eprint = {https://article.sciencepublishinggroup.com/pdf/10.11648.j.iecon.20260101.17},
  abstract = {Commercializing smallholder farmers in the fruit production is an indispensable path to boost the household income and economic growth in Ethiopia. Apple is the main source of income in Sinan district. However, the district faces various production and marketing problems of apple. Therefore, the study was designed to analysis market chain of apple specifically to identify the determinants of apple supply to the market and to assess of market structure, conduct and performance of apple in Sinan district, East Gojjam zone, Ethiopia. The study used data from primary and secondary sources. A random sampling procedure was used to draw a sample of 121 apple producers. Multiple linear regression model and marketing margin were used to analysis the collected data. The market concentration ratio (37.8%) of the four largest firms was shown that the market structure were weak oligopolistic nature in the study area. The market margin shows that retailers were taken the highest market margin from the available actors. The output of OLS model shows that man equivalent, land size, market distance, access to market information, experience and frequency of extension contact were the key variables influencing the amount of apple provided to the market. The authors suggest that the government and concerned bodies should develop market information delivery system, aware farmers to use land efficiently and wisely, build better roads in apple growing areas and allow access for transport vehicles to cut down transportation expense and product damage during the route to market.},
 year = {2026}
}
TY  - JOUR
T1  - Determinants of Market Supply Along the Apple Market Chain: In Case of Sinan District, East Gojjam Zone, Ethiopia
AU  - Mamaru Abebe Ayalew
AU  - Seblewongiel Solomon Worku
Y1  - 2026/03/14
PY  - 2026
N1  - https://doi.org/10.11648/j.iecon.20260101.17
DO  - 10.11648/j.iecon.20260101.17
T2  - Innovation Economics
JF  - Innovation Economics
JO  - Innovation Economics
SP  - 64
EP  - 80
PB  - Science Publishing Group
UR  - https://doi.org/10.11648/j.iecon.20260101.17
AB  - Commercializing smallholder farmers in the fruit production is an indispensable path to boost the household income and economic growth in Ethiopia. Apple is the main source of income in Sinan district. However, the district faces various production and marketing problems of apple. Therefore, the study was designed to analysis market chain of apple specifically to identify the determinants of apple supply to the market and to assess of market structure, conduct and performance of apple in Sinan district, East Gojjam zone, Ethiopia. The study used data from primary and secondary sources. A random sampling procedure was used to draw a sample of 121 apple producers. Multiple linear regression model and marketing margin were used to analysis the collected data. The market concentration ratio (37.8%) of the four largest firms was shown that the market structure were weak oligopolistic nature in the study area. The market margin shows that retailers were taken the highest market margin from the available actors. The output of OLS model shows that man equivalent, land size, market distance, access to market information, experience and frequency of extension contact were the key variables influencing the amount of apple provided to the market. The authors suggest that the government and concerned bodies should develop market information delivery system, aware farmers to use land efficiently and wisely, build better roads in apple growing areas and allow access for transport vehicles to cut down transportation expense and product damage during the route to market.
VL  - 1
IS  - 1
ER  -
Department of Agribusiness and Value Chain Management, Debre Markos University, Debre Markos, Ethiopia
Department of Agribusiness and Value Chain Management, Debre Markos University, Debre Markos, Ethiopia
Information