1. Introduction
Public debt is one of the most prominent economic issues that has received increasing attention in economic literature due to its direct impacts on economic growth and financial stability. Governments resort to borrowing to finance budget deficits and support public spending. However, the continuous accumulation of debt may lead to higher debt service burdens and crowding out of private investment, which may adversely affect economic performance. In Egypt, this issue has gained growing importance due to the noticeable rise in public debt levels over recent decades. This trend has sparked debate over the nature of the relationship between public debt and economic growth, specifically whether debt continues to stimulate growth or becomes a limiting factor once certain levels are exceeded. This study analyzes the impact of public debt on economic growth in Egypt using recent data and an appropriate econometric methodology, thereby providing scientific evidence to support economic policymaking.
1.1. Research Problem
Over recent decades, the Egyptian economy has witnessed a noticeable increase in public debt levels—both domestic and external—as a result of relying on borrowing to finance the public budget deficit and economic development requirements. This trend has coincided with varying rates of economic growth, raising questions about the nature of the relationship between public debt and economic growth, as well as the extent to which the impact of debt varies across different levels. Despite the multiplicity of studies addressing this relationship in Egypt, their findings remain mixed regarding several key aspects: the direction of the relationship, its linear or non-linear nature, the existence of critical debt thresholds beyond which its impact shifts from stimulating growth to hindering it, and the differing impacts of domestic versus external debt. The main problem of the study is represented in answering the following primary question: What is the impact of public debt on economic growth in Egypt? From this main question, the following sub-questions emerge:
1) What is the nature of the relationship between public debt and economic growth in Egypt?
2) Is the relationship linear or non-linear?
3) Is there a debt threshold beyond which the impact of debt on economic growth changes?
4) To what extent does the impact of domestic debt differ from that of external debt on economic growth?
1.2. Research Hypotheses
The study tests the following hypotheses:
1) Public debt positively impacts economic growth in the long run in Egypt.
2) The relationship between public debt and economic growth in Egypt is non-linear.
3) There is a critical threshold for public debt in Egypt beyond which the positive impact of public debt on economic growth declines, reflecting a negative effect.
4) The impact of public debt on economic growth in Egypt differs according to its components (domestic debt vs. external debt).
1.3. Research Objectives
This study aims to analyze the impact of public debt on economic growth in Egypt through achieving the following objectives:
1) Analyzing the nature of the relationship between public debt and economic growth in Egypt.
2) Testing whether the relationship between public debt and economic growth is linear or non-linear.
3) Estimating the critical public debt threshold beyond which the impact of debt on economic growth shifts.
4) Analyzing the comparative impact of domestic debt and external debt on economic growth in Egypt.
1.4. Significance of the Study
Academic Significance: Consists in enriching the economic literature related to the impact of public debt on economic growth in Egypt by analyzing the nature of the relationship, testing its linearity, and estimating the critical debt threshold, as well as comparing the impact of domestic debt and external debt.
Applied Significance: Consists in providing econometric evidence that supports policymakers in managing public debt and rationalizing borrowing policies, thereby contributing to enhancing economic growth and fiscal sustainability in Egypt.
1.5. Scope of the Study
1) Spatial Scope: The study is limited to the Egyptian economy.
2) Temporal Scope: The study covers the time period extending from 1980 to 2024.
3) Objective Scope: Objectively, the study is limited to analyzing the relationship between public debt (both domestic and external) and economic growth.
1.6. Research Methodology
The research relies on the descriptive-analytical approach to analyze the relationship between public debt and Gross Domestic Product growth rates in Egypt, while utilizing econometric tools to analyze, explain, and infer this relationship.
1.7. Previous Studies
Previous studies have used various econometric approaches to examine the relationship between public debt and economic growth. Reinhart and Rogoff
analyzed historical data across countries, finding that growth slows significantly when public debt reaches high levels relative to Gross Domestic Product. Chudik et al
| [2] | Chudik, A., Mohaddes, K., Pesaran, M. H., & Raissi, M. (2017). Is there a debt-threshold effect on output growth? Review of Economics and Statistics, 99(1), 135–150.
https://doi.org/10.1162/REST_a_00593 |
[2]
employed dynamic models and found that debt effects vary across countries, with no universal critical threshold. Similarly, Égert
used nonlinear regression models and concluded that the relationship is nonlinear and that the threshold at which negative effects emerge depends on the sample and methodology.
Previous findings also differ regarding the nature of this relationship. Reinhart and Rogoff
and Lee et al
associated higher public debt with lower growth, particularly beyond certain levels, suggesting nonlinear effects. Conversely, Panizza and Presbitero
found no evidence of a universal critical threshold, emphasizing the influence of economic and institutional conditions and development levels. Thus, although the literature recognizes a close relationship between public debt and growth, it differs on its direction and the debt level at which negative effects begin, highlighting the need for country-specific empirical analysis.
Moreover, much of the previous literature has focused on linear estimates without quantitatively identifying critical debt thresholds and has relied on periods preceding recent economic developments. This underscores the need to reassess the relationship using recent data and econometric techniques capable of testing nonlinear effects and identifying critical debt thresholds.
1.8. Research Gap
Previous studies agree on the existence of a relationship between public debt and economic growth, yet they differ regarding the nature of this relationship and the respective impacts of domestic versus external debt. Most of these studies relied on linear models and did not provide a quantitative estimation of the critical debt threshold. Additionally, they used data that does not cover recent economic developments. The current study fills these gaps by testing nonlinearity, estimating the critical debt threshold, and comparing the impact of domestic debt versus external debt using recent data for the Egyptian economy up to the year 2024.
1.9. The Study's Contribution Relative to the Closest Egyptian Studies
The present study differs from the closest Egyptian studies in three methodological and empirical respects. First, it employs the Augmented ARDL (AARDL) approach rather than the conventional ARDL used by Badr (2019) and other Egyptian studies, which allows for a proper treatment of a dependent variable that is stationary at level, I (0), and avoids the degenerate cases inherent in the conventional bounds test. Second, the study combines AARDL with Threshold Regression within a single framework, whereas the 2025 study and El-Barmawy (2021) relied on Threshold Regression alone, and other studies relied on ARDL only. Third, the study covers the period 1980–2024, which is longer than the span of most previous Egyptian studies, and distinguishes between domestic and external debt in both the linear and nonlinear estimations, whereas Abu El-Nour (2024) focused on external debt only and the 2023 study on domestic debt only. The estimated threshold (79.8%) falls within the range reported by the 2025 study (78.17%–89.42%), which reinforces the external consistency of the findings.
3. Relationship Between Public Debt and Economic Growth Rate in Egypt
3.1. Evolution of Public Debt and Its Components in Egypt During the Period (1980–2024)
3.1.1. Evolution of Public Debt to Gross Domestic Product Ratio During the Period
The preceding graph illustrates Egypt's public debt-to-GDP ratio during (1980–2024), showing a non-linear trajectory shaped by domestic and international economic developments and debt management policies. This evolution can be divided into four main stages:
(1980–1990), Public debt exceeded 115% in the early 1980s, reaching approximately 127% in some years, before declining to 83%–87% by the decade's end. This increase was partly linked to the global oil shocks of 1973, following the Arab-Israeli War and oil embargo, and 1979, following the Iranian Revolution. Higher oil prices raised import costs, widened budget and balance of payments deficits, increased inflation, and encouraged external borrowing
| [22] | Boughton, J. M. (2001). Silent revolution: The International Monetary Fund 1979–1989. International Monetary Fund. |
| [23] | Corden, W. M. (1984). Booming sector and Dutch disease economics: Survey and consolidation. Oxford Economic Papers, 36(3), 359–380.
https://doi.org/10.1093/oxfordjournals.oep.a041643 |
[22, 23]
.
The period also coincided with the international debt crisis of the 1980s. Rising global interest rates following US monetary tightening, declining commodity prices, and weaker export revenues increased debt-service burdens and reduced repayment capacity. Consequently, Egypt relied more heavily on external borrowing to finance fiscal imbalances and support economic activity
| [24] | Sachs, J. D. (1989). The debt overhang of developing countries. In G. A. Calvo et al. (Eds.), Debt, stabilization and development (pp. 80–102). Basil Blackwell. |
| [25] | World Bank. (1988). World development report 1988. Oxford University Press. |
[24, 25]
.
(1990–2010), Public debt generally declined from levels exceeding 120% in the early 1990s to approximately 69%–70% in the early 2000s. This improvement was associated with the Economic Reform and Structural Adjustment Program launched in 1991 in cooperation with the IMF and World Bank, and external debt relief following Egypt's participation in the international coalition during the Gulf War. Approximately 50% of external debt was reduced through three phases
:
1) First Phase (1991): The Paris Club canceled approximately 15% of outstanding external debt.
2) Second Phase (1993): An additional 15% was canceled following Egypt's commitment to economic reforms.
3) Third Phase (1996): The remaining 20% was reduced after completing the agreed-upon reforms.
These measures helped lower the debt-to-GDP ratio to approximately 69.5% in 2000, supported by reduced debt-service burdens and budget deficits, improved balance of payments, and stronger growth during the 1990s.
However, during 2003 and 2005, the ratio rose again, approaching 98% in some years. This reflected the Egyptian pound's depreciation following partial exchange rate liberalization in 2003, which increased the domestic value and servicing costs of external debt, alongside greater domestic borrowing to finance the budget deficit
. During (2006–2010), the ratio declined to approximately 69.5% in 2010, supported by stronger growth, fiscal and tax reforms, higher public revenues, improved debt management, and increased domestic and foreign investment. GDP growth exceeding debt growth, alongside foreign exchange revenues from tourism, remittances, and Suez Canal activities, further improved debt sustainability. Although the Global Financial Crisis affected the economy, fiscal and monetary policies helped contain its impact
| [28] | Subramanian, A. (1997). Egypt's economic reform program: From stabilization to growth. International Food Policy Research Institute. |
| [29] | Kheir-El-Din, H. (Ed.). (2008). The Egyptian economy: Current challenges and future prospects. The American University in Cairo Press. |
| [30] | International Labour Organization. (2010). Global employment trends 2010. International Labour Office. |
| [31] | African Development Bank. (2011). African economic outlook 2011: Africa and its emerging partners. OECD Publishing. |
[28-31]
.
(2011–2013), The public debt-to-GDP ratio increased from approximately 72.8% in 2011 to nearly 80% in 2013 amid political and economic instability. Lower growth and declining tax, tourism, and foreign investment revenues coincided with higher spending on subsidies, wages, and social services, widening the budget deficit. Greater reliance on domestic borrowing through Treasury bills and bonds, alongside higher borrowing costs and debt-service obligations, intensified fiscal pressures
| [32] | Cammett, M., Diwan, I., Richards, A., & Waterbury, J. (2015). A political economy of the Middle East (4th ed.). Westview Press. |
| [33] | World Economic Forum. (2013). The financial development report 2013. World Economic Forum. |
[32, 33]
.
As for the period (2014–2024), Public debt fluctuated between approximately 80% and 97%, peaking at nearly 97.8% in 2017, declining relatively afterward, and rising to approximately 95.9% in 2023 and 90.9% in 2024. This development coincided with the 2016 economic reform program implemented in cooperation with the IMF, which included exchange rate liberalization, subsidy restructuring, and fiscal and monetary reforms
. Although these reforms improved some macroeconomic indicators, supported growth, and attracted investment, financing budget deficits and infrastructure projects required substantial domestic and external borrowing. The November 2016 exchange rate liberalization also caused the US dollar to rise from approximately 8.88 EGP before the floatation to nearly 18 EGP by the end of the year. This depreciation of more than 50% increased the domestic value of external debt and its servicing costs
| [36] | Central Bank of Egypt. (2017). Annual report 2016/2017. Central Bank of Egypt. |
[36]
.
Further external shocks included the COVID-19 pandemic, which slowed economic activity and increased government support spending, and post-2022 global inflation and rising interest rates, which raised borrowing costs and debt-service obligations. Consequently, public debt remained high despite improvements in some economic indicators
| [37] | United Nations. (2022). World economic situation and prospects 2022. United Nations. |
| [38] | Bank for International Settlements. (2023). BIS annual economic report 2023. Bank for International Settlements. https://www.bis.org/publ/arpdf/ar2023e.htm |
[37, 38]
.
Overall, Egypt's public debt followed a fluctuating rather than linear trajectory during (1980–2024), reflecting domestic and international crises, economic reforms, and fiscal policy changes. Its economic impact depends not only on debt volume but also on the efficiency of utilizing and managing borrowed resources
.
3.1.2. Evolution of Domestic Public Debt in Egypt During the Period (1980–2024)
Figure 2. Evolution of Domestic Debt as a Percentage of Gross Domestic Product during the Period (1980-2024).
Source: Prepared by the researcher based on Central Bank of Egypt data – Time Series.
The preceding chart illustrates the evolution of domestic debt in Egypt across distinct phases, reflecting changes in economic conditions and fiscal and monetary policies:
First Phase (1980–1990): Domestic debt represented a relatively small share of GDP compared with external debt, ranging between 21.64% and 29.00% during the first half of the 1980s, before declining to 3.82% in 1989 and rising to 10.07% in 1990. This reflected reliance on external borrowing to finance public expenditure, development, and post-October 1973 War reconstruction, alongside limited domestic debt market development and banking capacity to absorb government securities
| [27] | Ikram, K. (2006). The Egyptian economy, 1952–2000: Performance, policies, and issues. Routledge. |
| [39] | Hansen, B. (1991). The political economy of poverty, equity, and growth: Egypt and Turkey. Oxford University Press. |
| [40] | Burger, J. D., & Warnock, F. E. (2006). Local currency bond markets. IMF Staff Papers, 53(Suppl. 1), 133–146.
https://doi.org/10.1057/palgrave.imfsp.9450018 |
[27, 39, 40]
.
Second Phase (1991–2002): The Economic Reform and Structural Adjustment Program (ERSAP) shifted financing toward domestic sources, raising the domestic debt-to-GDP ratio from 35.17% in 1991 to 50.98% in 2002. This reflected reduced external debt burdens through rescheduling and international relief, increased Treasury bill and bond issuance, and financing of budget requirements. Economic growth and improved public revenues helped contain associated risks
| [29] | Kheir-El-Din, H. (Ed.). (2008). The Egyptian economy: Current challenges and future prospects. The American University in Cairo Press. |
| [41] | International Monetary Fund. (1998). Arab Republic of Egypt: Recent economic developments (IMF Staff Country Report No. 98/9). International Monetary Fund. |
[29, 41]
.
Third Phase (2003–2010): Domestic debt rose to 59.15% in 2003 and 64.20% in 2005, partly due to exchange rate liberalization in 2003 and increased domestic borrowing to finance the fiscal deficit. Stronger growth and fiscal and tax reforms reduced the ratio to 45.96% in 2008, before it increased to 52.79% in 2010. GDP growth exceeding debt growth helped improve fiscal sustainability
| [42] | World Bank. (2007). Arab Republic of Egypt: Egypt public expenditure review. World Bank. |
| [43] | Central Bank of Egypt. (2010). Annual report 2009/2010. Central Bank of Egypt. |
[42, 43]
.
Fourth Phase (2011–2024): Domestic debt generally increased amid economic and political shocks, with the ratio rising from 57.88% in 2011 to 70.79% in 2016 due to slower growth, widening deficits, and higher spending on wages, subsidies, and social services. The 2016 reform program further increased domestic borrowing amid high interest rates and monetary tightening. Improved growth and GDP subsequently reduced the ratio to 49.94% in 2018 and 43.98% in 2019. The COVID-19 pandemic raised it to 55.38% in 2021, while the Russia-Ukraine war, high inflation, and elevated global interest rates sustained fiscal pressures. The ratio remained above 50%, reaching 53.42% in 2023 before declining slightly to 50.89% in 2024
| [44] | Central Bank of Egypt. (2024). Annual report 2023/2024. Central Bank of Egypt. |
| [45] | International Monetary Fund. (2024). Arab Republic of Egypt: First and second reviews under the Extended Arrangement under the Extended Fund Facility. International Monetary Fund. |
[44, 45]
.
3.1.3. Evolution of External Debt in Egypt During the Period (1980–2024)
Figure 3. Evolution of External Debt as a Percentage of Gross Domestic Product during the Period (1980-2024).
Source: Prepared by the researcher based on Central Bank of Egypt data – Time Series.
sThe external debt-to-GDP ratio in Egypt during (1980–2024) fluctuated significantly, reflecting changes in economic conditions, financing needs, and debt management policies. Its evolution can be divided into five phases:
First Phase (1980–1990): The ratio ranged between 76.82% and 99.72%, rising from 88.28% in 1980 to 99.72% in 1981, then declining to 76.82% in 1990. High deficits, external borrowing, falling oil prices, weaker remittances and Suez Canal revenues, declining reserves, currency depreciation, and post-war reconstruction expenditures intensified debt pressures
| [22] | Boughton, J. M. (2001). Silent revolution: The International Monetary Fund 1979–1989. International Monetary Fund. |
| [27] | Ikram, K. (2006). The Egyptian economy, 1952–2000: Performance, policies, and issues. Routledge. |
[22, 27]
.
Second Phase (1991–2000): The ratio fell from 87.20% in 1991 to 29.28% in 2000, supported by the Economic Reform and Structural Adjustment Program with the IMF and World Bank, Paris Club debt relief, and financial assistance following Egypt's participation in the Gulf War. Higher foreign exchange reserves, exchange market liberalization, and stronger growth further reduced the debt burden
| [26] | Paris Club. (n. d.). Egypt.
https://clubdeparis.org/en/countries/egypt |
| [41] | International Monetary Fund. (1998). Arab Republic of Egypt: Recent economic developments (IMF Staff Country Report No. 98/9). International Monetary Fund. |
[26, 41]
.
Third Phase (2001–2010): The ratio ranged between 16.81% and 39.97%, rising from 29.31% in 2001 to 39.86% in 2004 due to slower growth and the 2003 exchange rate liberalization, which increased the domestic value of external debt. It then declined to 16.81% in 2010, supported by stronger growth, improved balance of payments conditions, and increased foreign direct investment. Despite the 2008 Global Financial Crisis, external debt remained manageable
| [42] | World Bank. (2007). Arab Republic of Egypt: Egypt public expenditure review. World Bank. |
| [43] | Central Bank of Egypt. (2010). Annual report 2009/2010. Central Bank of Egypt. |
[42, 43]
.
Fourth Phase (2011–2015): Political and economic instability following the January 2011 and June 2013 revolutions weakened growth, investment, tourism, and remittances, while reducing international reserves. Nevertheless, the ratio remained between 13.67% and 16.13%, reaching 14.92% in 2011 and its lowest level of 13.67% in 2014, largely due to Gulf financial grants and assistance. However, this improvement relied on exceptional external support rather than sustainable structural changes
| [46] | African Development Bank. (2015). African economic outlook 2015: Egypt. African Development Bank. |
| [47] | Central Bank of Egypt. (2015). Annual report 2014/2015. Central Bank of Egypt. |
[46, 47]
.
Fifth Phase (2016–2024): The ratio increased from 20.81% in 2016 to 42.48% in 2023, before declining to 40.09% in 2024. This reflected IMF borrowing, subsequent financing programs, and exchange rate liberalization in November 2016 and further adjustments during 2022, 2023, and 2024, which increased the domestic value of external liabilities. The COVID-19 pandemic, Russia-Ukraine war, higher food and energy prices, rising global interest rates, and debt-service costs intensified pressures. Geopolitical tensions during 2023 and 2024 also affected foreign exchange revenues, particularly tourism and Suez Canal receipts. Although the Ras El-Hekma deal in 2024 provided substantial foreign currency inflows and improved dollar liquidity, this phase reflected greater reliance on external financing and increased exposure to external debt risks
| [35] | Ministry of Planning, Economic Development and International Cooperation. (2024). Annual report 2023/2024.
https://mped.gov.eg/ |
| [44] | Central Bank of Egypt. (2024). Annual report 2023/2024. Central Bank of Egypt. |
| [45] | International Monetary Fund. (2024). Arab Republic of Egypt: First and second reviews under the Extended Arrangement under the Extended Fund Facility. International Monetary Fund. |
| [48] | Cabinet of Egypt. (2024). Prime Minister’s Office statements on Ras El-Hekma development project. Cabinet of Egypt. |
[35, 44, 45, 48]
.
3.2. Evolution of Economic Growth Rates in Egypt During the Period (1980–2024)
Figure 4. Gross Domestic Product Growth Rates in Egypt during the Period (1980- 2024).
Economic growth in Egypt during (1980–2024) fluctuated between strong expansion and slowdowns. In the early 1980s, growth exceeded 10% in 1980 and approached 10% in 1982 and 1984, supported by the oil boom, workers' remittances, and increased Suez Canal and tourism revenues. It later declined to 3.8%–5.8% due to the global debt crisis, falling oil prices, and international economic slowdown
| [27] | Ikram, K. (2006). The Egyptian economy, 1952–2000: Performance, policies, and issues. Routledge. |
| [49] | World Bank. (1990). World development report 1990: Poverty. Oxford University Press. |
[27, 49]
.
In the early 1990s, growth fell from 5.67% in 1990 to 1.13% in 1991 due to the Second Gulf War and domestic imbalances, then recovered to 4.47% in 1992. It fluctuated between 2.90% in 1993 and 3.97% in 1994 before gradually increasing under the Economic Reform and Structural Adjustment Program to 4.64% in 1995, 4.99% in 1996, 5.49% in 1997, 5.58% in 1998, and 6.05% in 1999
| [28] | Subramanian, A. (1997). Egypt's economic reform program: From stabilization to growth. International Food Policy Research Institute. |
[28]
.
Growth reached 6.37% in 2000, declined to 2.39% in 2002, then recovered to 4.09% in 2004. During (2005–2008), it increased from 4.47% to 7.16%, supported by foreign investment, tourism, real estate, and improved business conditions. The 2008 Global Financial Crisis reduced it to 4.67% in 2009, followed by a recovery to 5.15% in 2010. However, growth fell to 1.76% in 2011 following the January 25 Revolution and ensuing political and security instability
| [29] | Kheir-El-Din, H. (Ed.). (2008). The Egyptian economy: Current challenges and future prospects. The American University in Cairo Press. |
| [43] | Central Bank of Egypt. (2010). Annual report 2009/2010. Central Bank of Egypt. |
[29, 43]
.
During (2012–2014), growth remained low, ranging between 2.23% and 2.92% amid instability and weak investor confidence. It recovered from 4.37% to 5.55% during (2015–2019), supported by economic reforms, exchange rate liberalization, and infrastructure investment
| [46] | African Development Bank. (2015). African economic outlook 2015: Egypt. African Development Bank. |
| [47] | Central Bank of Egypt. (2015). Annual report 2014/2015. Central Bank of Egypt. |
[46, 47]
. The COVID-19 pandemic reduced growth to 3.55% in 2020 and 3.29% in 2021, particularly affecting tourism and global trade. Growth rebounded to 6.59% in 2022, then declined to 3.76% in 2023 and 2.40% in 2024 amid global pressures and the Russia-Ukraine war, which increased inflation, import costs, and exchange rate pressures
| [14] | World Bank. (2024). World development indicators. World Bank. |
| [45] | International Monetary Fund. (2024). Arab Republic of Egypt: First and second reviews under the Extended Arrangement under the Extended Fund Facility. International Monetary Fund. |
| [50] | World Bank. GDP growth rate. Available from:
https://data.worldbank.org/indicator/NY.GDP.MKTP.KD.ZG?locations=EG (accessed 6 July 2026). |
[14, 45, 50]
.
During (2012–2014), growth remained relatively low at 2.23%–2.92% due to instability and weak economic confidence. It recovered from 4.37% to 5.55% during (2015–2019), supported by reforms, exchange rate liberalization, and infrastructure investment. The COVID-19 pandemic reduced growth to 3.55% in 2020 and 3.29% in 2021, before it rebounded to 6.59% in 2022. Growth subsequently declined to 3.76% in 2023 and 2.40% in 2024 amid global pressures and the Russia-Ukraine war, which raised inflation, import costs, and exchange rate pressures
| [45] | International Monetary Fund. (2024). Arab Republic of Egypt: First and second reviews under the Extended Arrangement under the Extended Fund Facility. International Monetary Fund. |
| [51] | World Bank. GDP (current US$). Available from:
https://data.worldbank.org/indicator/NY.GDP.MKTP.CD?locations=EG (accessed 17 July 2026). |
[45, 51]
.
3.3. Analyzing the Relationship Between Public Indebtedness and Economic Growth Rates in Egypt Through Transmission Channels
Public debt does not affect economic growth solely through a direct path; rather, its impact is transmitted through intermediary channels related to how borrowing resources are allocated within the general budget. Financing the budget deficit through borrowing leads to a redistribution of public spending among investment, social expenditures, and debt service, which ultimately reflects on economic growth rates. Public indebtedness affects economic growth not only directly, but also through its impact on the structure of the general budget and the redistribution of spending between productive and non-productive items.
3.3.1. Positive Impact Channels (Utilizing Debt in Productive Spending)
(i). Public Investment Channel
Analysis of Investment Expenditure Developments in Egypt During the Period (1980–2024):
Figure 5. Investment Expenditures as a Percentage of Total Expenditures during the Period (1980-2024).
Source: Prepared by the researcher based on Ministry of Finance – General State Budget, various issues.
Investment expenditure in Egypt during (1980–2024) evolved in response to economic conditions and government policies. During the 1980s, it increased from 16.1% of total expenditures in 1980 to 31.06% in 1989, reflecting the state's focus on infrastructure, development, and public investment
| [27] | Ikram, K. (2006). The Egyptian economy, 1952–2000: Performance, policies, and issues. Routledge. |
| [39] | Hansen, B. (1991). The political economy of poverty, equity, and growth: Egypt and Turkey. Oxford University Press. |
[27, 39]
.
During (1990–2000), investment expenditure declined from 28.1% in 1990 to 21%–23% in most years, reaching 22.7% in 2000. This coincided with the Economic Reform and Structural Adjustment Program launched in 1991, which emphasized fiscal consolidation, spending rationalization, and a reduced direct state role in investment in favor of the private sector
| [29] | Kheir-El-Din, H. (Ed.). (2008). The Egyptian economy: Current challenges and future prospects. The American University in Cairo Press. |
| [41] | International Monetary Fund. (1998). Arab Republic of Egypt: Recent economic developments (IMF Staff Country Report No. 98/9). International Monetary Fund. |
[29, 41]
.
During (2001–2004), investment expenditure rose temporarily to 28.8% in 2001, then fell to 21.3% in 2004. A sharper decline began in 2005, when it reached 9.2%, remaining between 10% and 13.2% during (2005–2010). This reflected mounting pressures from current spending, debt servicing, and subsidies, which restricted investment resources
| [43] | Central Bank of Egypt. (2010). Annual report 2009/2010. Central Bank of Egypt. |
| [52] | Ministry of Finance. (2010). Financial monthly bulletin. Ministry of Finance. |
[43, 52]
.
During (2011–2015), investment expenditure reached historically low levels, falling to 7.6% in 2011 and 6.7% in 2012, before recovering to 8.5% in 2015. This decline was linked to political and economic instability following the January 2011 revolution, which slowed economic activity, widened the fiscal deficit, and increased current spending obligations
| [46] | African Development Bank. (2015). African economic outlook 2015: Egypt. African Development Bank. |
| [47] | Central Bank of Egypt. (2015). Annual report 2014/2015. Central Bank of Egypt. |
[46, 47]
.
Following the 2016 economic reform program, investment expenditure recovered to 10.6%, then fluctuated between 8.6% and 10.5% during (2017–2019). It peaked at 15.7% and 17.5% in 2020 and 2021, respectively, supported by public investment, infrastructure projects, national initiatives, and measures to mitigate the COVID-19 pandemic. It then declined to 13.2% in 2022 and 9.9% in 2023, before rising to 12.83% in 2024
| [45] | International Monetary Fund. (2024). Arab Republic of Egypt: First and second reviews under the Extended Arrangement under the Extended Fund Facility. International Monetary Fund. |
| [53] | Ministry of Finance. The Financial Statement for the State Budget 2024/2025. Cairo, Egypt: Ministry of Finance; 2024. |
[45, 53]
.
(ii). Human Capital Channel
Analysis of Expenditures on Education and Health in Egypt during the Period (1980–2024):
Figure 6. Evolution of Education and Health Spending Ratios as a% of Gross Domestic Product during the Period (1980-2024).
Source: Prepared by the researcher based on Ministry of Planning – Development Reports, various issues.
The evolution of education and health expenditure as a percentage of Gross Domestic Product in Egypt during (1980–2024) reflects changing fiscal priorities and the impact of social spending on public debt and economic conditions. During the 1980s, education spending ranged between 4.3% and 5.6%, while health spending remained between 1.1% and 1.4%, reflecting the state's focus on human development despite high external debt and debt service burdens
| [27] | Ikram, K. (2006). The Egyptian economy, 1952–2000: Performance, policies, and issues. Routledge. |
| [54] | United Nations Development Programme. (1994). Human development report 1994. Oxford University Press. |
[27, 54]
.
During the 1990s, education spending declined to 3.1% in 1991, then recovered to 4.6%–4.7% in the second half of the decade. Health spending also rose to around 1.7% by 1999. These improvements coincided with the Economic Reform and Structural Adjustment Program, which enhanced financial stability and eased debt-related pressures, allowing greater allocation to social spending
| [29] | Kheir-El-Din, H. (Ed.). (2008). The Egyptian economy: Current challenges and future prospects. The American University in Cairo Press. |
| [41] | International Monetary Fund. (1998). Arab Republic of Egypt: Recent economic developments (IMF Staff Country Report No. 98/9). International Monetary Fund. |
[29, 41]
.
During (2000–2010), social spending fluctuated considerably. Education expenditure reached 7.9% in 2001 and 7.4% in 2003, while health spending rose exceptionally to 4.72% of Gross Domestic Product in 2009, compared with less than 2% in most preceding years. This reflected expanded public and social spending alongside increased domestic borrowing, particularly after the 2008 Global Financial Crisis and the subsequent economic slowdown
| [55] | World Health Organization. World Health Statistics 2010. Geneva, Switzerland: World Health Organization; 2010. |
| [56] | United Nations Educational, Scientific and Cultural Organization. (2011). Education for all global monitoring report 2011. UNESCO. |
[55, 56]
.
After 2011, social spending declined relatively. Education expenditure fell from 4.15% in 2011 to 1.73% in 2024, while health expenditure decreased from 3.69% to 1.27%. This decline was partly linked to rising debt service burdens, limited fiscal space, and changing spending priorities, particularly following the 2016 economic reform program and its fiscal measures. Despite increases in absolute spending, the declining GDP shares indicate that expenditure growth did not keep pace with financial obligations and public debt
| [57] | United Nations Development Programme. (2024). Human development report 2023/2024. United Nations Development Programme. |
| [58] | World Bank. (2024). Egypt economic monitor: Changing tides. World Bank. |
[57, 58]
.
Overall, the relationship between public debt and education and health spending in Egypt was indirect and nonlinear. Borrowing supported social spending in some periods, while rising debt and debt service restricted resources for human development in others, highlighting the importance of efficient debt management in balancing financial stability and social development.
3.3.2. Negative Impact Channels (Unproductive Use of Debt)
(i). Current Expenditures Channel
Analysis of Current Expenditure Developments in Egypt During the Period (1980–2024):
Figure 7. Current Expenditures as a Percentage of Total Expenditures during the Period (1980-2024) Source: Prepared by the researcher based on Ministry of Finance – General State Budget, various issues.
Current expenditures represented the largest share of public spending, with their changes reflecting economic conditions and fiscal priorities and indirectly affecting growth. During the 1980s, they declined from 83.9% in 1980 to 68.94% in 1989, easing budgetary pressures and allowing greater flexibility in resource allocation, alongside relatively high economic growth
| [59] | Tanzi, V., & Schuknecht, L. (2000). Public spending in the 20th century: A global perspective. Cambridge University Press. |
| [60] | Tanzi, V. (1987). Quantitative characteristics of the tax systems of developing countries. In D. Newbery & N. Stern (Eds.), The theory of taxation for developing countries (pp. 205–241). Oxford University Press. |
[59, 60]
.
During the 1990s and early 2000s, current expenditures ranged between 70% and 79% of total spending. Although the Economic Reform and Structural Adjustment Program improved resource management and supported economic activity, the high share of current spending indicated continued allocation of resources to consumption and operational items rather than productive capacity
.
Since 2005, current expenditures exceeded 90% of total spending, driven by higher wages, subsidies, interest payments, and operating costs. This reduced the fiscal space for investment and shifted resources toward current obligations at the expense of sustainable growth
| [62] | Alesina, A. F., & Perotti, R. (1997). Fiscal adjustments in OECD countries: Composition and macroeconomic effects. IMF Staff Papers, 44(2), 210–248. |
| [63] | Pritchett, L. (2000). The tyranny of concepts: CUDIE (Cumulated, depreciated, investment effort) is not capital. Journal of Economic Growth, 5(4), 361–384.
https://doi.org/10.1023/A:1026590806120 |
[62, 63]
.
During the period (2011–2015), current expenditures exceeded 91%, reaching 93.3% in 2012. This coincided with growth rates of 1.76% in 2011, 2.23% in 2012, and 2.19% in 2013. Amid instability, expanding current spending intensified fiscal pressures and deficits, limiting resources for productive activities, growth, and employment
| [64] | Herrera, S., & Pang, G. (2005). Efficiency of public spending in developing countries: An efficiency frontier approach (World Bank Policy Research Working Paper No. 3645). World Bank. |
| [65] | Rajaram, A., Le, T. M., Biletska, N., & Brumby, J. (2014). A diagnostic framework for assessing public investment management. World Bank. |
[64, 65]
.
Despite declining relatively after 2016, current expenditures remained high, ranging between 82.5% and 91.4% of total spending, mainly due to wages, subsidies, and interest payments. Rising debt service further constrained resources for public investment and human capital development, potentially weakening fiscal policy's ability to support sustainable growth and long-term productive capacity
| [66] | Clements, B., Gupta, S., & Nozaki, M. (2013). What happens to social spending in IMF-supported programmes? Applied Economics, 45(28), 4022–4033.
https://doi.org/10.1080/00036846.2012.709593 |
| [67] | Organisation for Economic Co-operation and Development. (2019). Government at a glance 2019. OECD Publishing.
https://doi.org/10.1787/8ccf5c38-en |
| [68] | Escolano, J. (2010). A practical guide to public debt dynamics, fiscal sustainability, and cyclical adjustment of budgetary aggregates. International Monetary Fund. |
| [69] | Abbas, S. M. A., Belhocine, N., ElGanainy, A., & Horton, M. (2011). A historical public debt database. IMF Economic Review, 59(4), 717–742.
https://doi.org/10.1057/imfer.2011.24 |
[66-69]
.
(ii). Debt Service Channel
Analysis of Debt Service Developments in Egypt During the Period (1980–2024):
Figure 8. Total Debt Service as a Percentage of Exports of Goods, Services, and Primary Income during the Period (1980-2024).
Source: Prepared by the researcher based on World Bank. Debt service as a percentage of merchandise exports. Available from: https://data.worldbank.org/indicator/DT.TDS.DECT.EX.ZS?locations=EG (accessed 5 July 2026).
The debt service ratio as a percentage of exports of goods, services, and primary income measures Egypt's ability to meet external obligations through foreign exchange earnings. A higher ratio indicates greater principal and interest payment burdens, while a lower ratio reflects stronger repayment capacity and less pressure on the balance of payments.
During the period (1980–1986), the ratio rose from approximately 18.96% in 1980 to 42.26% in 1986, reflecting the worsening external debt crisis due to increased borrowing, widening fiscal and current account deficits, and declining foreign exchange resources following lower oil prices, worker remittances, and Suez Canal revenues
| [70] | World Bank. (1989). Sub-Saharan Africa: From crisis to sustainable growth. World Bank. |
| [71] | Eaton, J., & Gersovitz, M. (1981). Debt with potential repudiation: Theoretical and empirical analysis. The Review of Economic Studies, 48(2), 289–309.
https://doi.org/10.2307/2296886 |
[70, 71]
.
During the period (1987–2000), the ratio declined from 22.93% in 1987 to 9.83% in 2000, supported by the Economic Reform and Structural Adjustment Program launched in 1991, debt rescheduling and relief, increased international reserves, and higher export and service revenues
| [24] | Sachs, J. D. (1989). The debt overhang of developing countries. In G. A. Calvo et al. (Eds.), Debt, stabilization and development (pp. 80–102). Basil Blackwell. |
| [72] | Williamson, J. (1990). What Washington means by policy reform. In J. Williamson (Ed.), Latin American adjustment: How much has happened? (pp. 7–20). Institute for International Economics. |
[24, 72]
.
During the period (2001–2010), the ratio remained relatively low, ranging between 5.69% and 13.01%, reaching its lowest level of 5.69% in 2008. This reflected improved external sustainability through economic growth, increased tourism revenues, worker remittances and exports, and reduced reliance on external borrowing. Despite the 2008 Global Financial Crisis, strong foreign exchange resources maintained the ratio within relatively safe limits
| [73] | International Monetary Fund. (2003). Assessing sustainability. International Monetary Fund. |
| [74] | Reinhart, C. M., Rogoff, K. S., & Savastano, M. A. (2003). Debt intolerance. Brookings Papers on Economic Activity, 2003(1), 1–74. https://doi.org/10.1353/eca.2003.0010 |
[73, 74]
.
During the period (2011–2015), the ratio increased from 7.91% in 2011 to 12.67% in 2014, before declining to 9.99% in 2015. This was associated with post-January 2011 instability, declining tourism revenues, foreign direct investment, and international reserves, which increased the relative debt service burden
| [75] | African Development Bank. (2013). Egypt country strategy paper 2012–2016. African Development Bank. |
| [76] | United Nations Conference on Trade and Development. (2014). Trade and development report 2014. United Nations. |
[75, 76]
.
During the final phase (2016–2024), the ratio surged from 19.51% in 2016 to 49.23% in 2024, its highest level during the study period. This reflected increased external borrowing under the economic reform program and financing agreements with the International Monetary Fund and international institutions, as well as the Egyptian pound's devaluations in 2016, 2022, and 2024, which raised foreign-currency debt service costs. The COVID-19 pandemic, Russia-Ukraine war, and rising global interest rates further pressured foreign exchange resources, bringing debt service to nearly half of export earnings by 2024 and potentially constraining future import financing and productive investment
| [77] | Institute of International Finance. (2023). Global debt monitor: A growing burden. Institute of International Finance. |
| [78] | World Bank. (2023). International debt report 2023. World Bank. |
[77, 78]
.
(iii). Private Sector Crowding-Out Channel
Developments in Credit Granted to the Private Sector, Public Sector, and Business Sector in Egypt During the Period (1980–2024):
Figure 9. Developments in Credit Ratios Granted to the Private Sector, Government Sector, and Business Sector as a% of Domestic Credit during the Period (1980-2024).
Source: Prepared by the researcher based on Central Bank of Egypt – Time Series data.
Domestic credit distribution in Egypt during the period (1980–2024) reflects structural changes in bank financing, shifting from government dominance in the early 1980s toward a larger private sector share during economic reform, before government credit increased again from the mid-2000s, particularly after 2011. This indicates growing government reliance on domestic banks and a declining share of credit available to the private sector
.
During the period (2000–2010), the private sector retained the largest share of domestic credit, but this gradually declined as government financing needs increased. In recent years, its share fell to around 30%, while the government's exceeded 65%, reflecting the diversion of banking resources toward government financing at the expense of private productive activities
| [80] | Beck, T. (2012). Finance and growth: Lessons from the literature and the recent crisis (World Bank Policy Research Working Paper No. 6333). World Bank. |
[80]
.
This trend represents the Crowding-Out Effect, whereby increased government domestic borrowing absorbs banking resources, reduces private sector credit, and limits investment and productive expansion, particularly in economies dependent on bank financing and characterized by shallow financial markets
| [81] | Baldacci, E., & Kumar, M. S. (2010). Fiscal deficits, public debt, and sovereign bond yields (IMF Working Paper No. WP/10/184). International Monetary Fund. |
[81]
.
This is consistent with Egyptian empirical evidence showing that high public debt can reduce private investment by restricting available financing, thereby weakening long-term growth. International studies similarly indicate that financial institutions may favor government lending because of its lower perceived risk
.
These changes were reinforced by economic shocks, including the 2008 Global Financial Crisis, the events of 2011, the 2016 economic reform program, the COVID-19 pandemic, and global monetary tightening following rising inflation after 2022. These developments, alongside higher domestic interest rates and increased issuance of treasury bills and bonds, encouraged banks to favor government debt instruments for their lower risk and greater liquidity. Consequently, the government's share exceeded 65% during 2023–2024, while the private sector's share continued to decline
| [82] | Bank for International Settlements. (2024). BIS annual economic report 2024. Bank for International Settlements. |
[82]
.
Overall, domestic credit distribution reveals growing government dominance in bank financing, driven by rising financing needs, budget deficits, and reliance on domestic debt. This may restrict private sector investment and productive expansion, weakening productivity and long-term growth. Therefore, balancing government financing requirements with private sector needs and improving credit allocation efficiency are essential for sustainable economic growth
.
3.3.3. The Relationship Between Public Debt-to-GDP Ratio and Economic Growth Rate in Egypt During the Period (1980–2024)
Descriptive data indicates that the relationship between public debt-to-GDP and economic growth in Egypt varied according to economic conditions and the use of borrowed funds. Debt can support growth when directed toward productive investment, but excessive accumulation raises debt service burdens and reduces resources available for development spending
| [84] | Cecchetti, S. G., Mohanty, M. S., & Zampolli, F. (2011). The real effects of debt. In Proceedings of the Federal Reserve Bank of Kansas City Economic Symposium: Achieving Maximum Long-Run Growth (pp. 145–196). Federal Reserve Bank of Kansas City. |
[84]
.
During the 1980s, high public debt-to-GDP ratios coincided with declining economic growth, reflecting external financial imbalances and rising borrowing burdens that increased pressure on the budget and balance of payments
| [85] | Eichengreen, B., & Portes, R. (1989). After the deluge: Default, negotiation, and readjustment during the interwar years. In B. Eichengreen & P. H. Lindert (Eds.), The international debt crisis in historical perspective (pp. 12–47). MIT Press. |
[85]
.
During the 1990s, declining public debt accompanied improved growth, supported by the Economic Reform and Structural Adjustment Program, external debt restructuring, and improved macroeconomic indicators. Lower debt burdens helped expand fiscal space for economic and investment activities
| [72] | Williamson, J. (1990). What Washington means by policy reform. In J. Williamson (Ed.), Latin American adjustment: How much has happened? (pp. 7–20). Institute for International Economics. |
[72]
.
During the period (2001–2010), public debt remained relatively manageable, while growth exceeded 7% in some years. This suggests that debt's impact depended on the efficiency of resource allocation to public investment, business environment improvements, and domestic and foreign investment
| [86] | Calderón, C., & Servén, L. (2004). The effects of infrastructure development on growth and income distribution (World Bank Policy Research Working Paper No. 3400). World Bank. |
[86]
.
Conversely, during the period (2011–2014), public debt-to-GDP increased as growth fell to its lowest levels during the study period. Political and economic instability and the widening budget deficit contributed to this decline, while borrowing increasingly financed current rather than productive expenditures
| [87] | Alesina, A., Favero, C., & Giavazzi, F. (2019). Austerity: When it works and when it doesn’t. Princeton University Press. |
[87]
.
During the period (2016–2024), public debt rose again under the economic reform program. Growth initially improved due to structural reforms and infrastructure and energy investments; however, continued debt accumulation and rising debt service, alongside the COVID-19 pandemic, global monetary tightening, and the Russia-Ukraine war, contributed to slower growth in recent years
| [88] | Kose, M. A., Nagle, P., Ohnsorge, F., & Sugawara, N. (2021). Global waves of debt: Causes and consequences. World Bank. |
[88]
.
Overall, the relationship between public debt-to-GDP and economic growth in Egypt appears nonlinear. Debt supports growth when maintained at manageable levels and directed toward productive investment, but may constrain it through higher debt service, crowding out productive spending, and increased fiscal pressures. These observations support testing for a critical debt threshold in the empirical section to identify when debt's effect shifts from promoting to constraining economic growth.
3.3.4. The Relationship Between Debt Volume and GDP Volume in Egypt During the Period (1980–2024)
Figure 10 illustrates the evolution of public debt and Gross Domestic Product (GDP) in Egypt during (1980–2024). Both variables generally increased, with GDP reaching approximately $476 billion in 2022 before declining in 2023 and 2024 due to exchange rate fluctuations and the lower dollar value of GDP. Public debt rose from about $25 billion at the beginning of the period to over $420 billion in 2022, reflecting increased borrowing to finance budget requirements and investment spending
| [88] | Kose, M. A., Nagle, P., Ohnsorge, F., & Sugawara, N. (2021). Global waves of debt: Causes and consequences. World Bank. |
[88]
.
GDP exceeded public debt in most years, although the gap varied. It remained relatively narrow during the 1980s and 1990s due to high debt levels relative to GDP, then widened during (2004–2016) as GDP grew faster than public debt, reflecting improved economic activity and absorption capacity.
During (2016–2022), both variables grew rapidly, but debt growth exceeded GDP growth in several years, narrowing the gap. This reflected the economic reform program, expanded infrastructure financing, increased government borrowing, and the impact of exchange rate liberalization on their dollar values
.
During (2022–2024), both GDP and public debt denominated in US dollars declined relatively, mainly due to exchange rate fluctuations and dollar revaluation rather than an actual contraction in economic activity or a reduction in government obligations. Therefore, dollar-denominated indicators require cautious interpretation in economies experiencing exchange rate volatility.
Overall, the figure shows a positive correlation between public debt and GDP during most of the period, but this does not establish causation or prove that debt promotes growth. Both variables are affected by common factors, including population growth, inflation, economic expansion, and fiscal and monetary policies. Thus, assessing debt's impact requires relative indicators and econometric methods that account for economic size and the dynamic relationship between the variables, as addressed in the empirical section
.
4. Empirical Study
The empirical study relies on semi-annual data covering the period 1984S2–2024S1, sourced from the World Scorecard and the World Bank and processed using EViews. The semi-annual frequency was adopted to overcome the short annual span (1980–2024, 45 observations), which is insufficient for reliable estimation of the Augmented ARDL model with multiple lags and for stable threshold estimation. Increasing the number of observations through semi-annual data enhances the statistical power of the bounds test and the precision of the lag-length and threshold estimates. Annual series were temporally disaggregated to a semi-annual frequency using the Chow-Lin method. The AARDL estimation yields 80 usable observations after lag adjustment, while the Threshold Regression yields 89 observations due to the 0.15 trimming applied. The study employs the following variables: Y2 denotes Gross Domestic Product in billions of US dollars, and Y1 denotes the GDP growth rate, both sourced from the World Bank; X1 is the public debt-to-GDP ratio, sourced from the World Scorecard; X2 is the external debt-to-GDP ratio, sourced from the World Bank; X3 is the domestic debt-to-GDP ratio, computed as public debt minus external debt and then expressed as a percentage of GDP; X12 is a dummy variable capturing the economic reform program in Egypt; and LN denotes the natural logarithm, applied to the variables as specified in the econometric models.
To ensure conceptual consistency across sources, the study does not rely on the pre-computed debt ratios reported by different databases. Instead, all debt variables are constructed from absolute values in billions of US dollars. Total public debt and external debt are obtained from the World Scorecard and the World Bank, respectively, and domestic debt is computed as the difference between total public debt and external debt. The accounting identity (Total Public Debt = External Debt + Domestic Debt) is verified for every observation before any ratio is computed. Each debt component is then divided by nominal GDP in billions of US dollars to obtain the corresponding debt-to-GDP ratio. This procedure avoids the inconsistencies that may arise from combining pre-computed ratios based on different definitions and coverage across sources, and ensures that the three debt measures (X1, X2, and X3) are internally consistent. Regarding the logarithmic transformation, the GDP growth rate (Y1) is transformed as ln (1+g), where g is the decimal growth rate, which accommodates negative growth rates as long as g>−1. Consequently, the coefficients on the debt ratios are interpreted as semi-elasticities, while the coefficient on ln (1+g) is interpreted with caution as an approximation rather than a pure elasticity. The economic-reform dummy (X12) equals 1 for the years 2016–2024, the period of the IMF-supported reform program, and 0 otherwise.
4.1. Unit Root Tests
Table 1. Augmented Dickey-Fuller (ADF) Test Statistic.
| Stationarity Test at Level I (0) | Stationarity Test at First Difference I (1) | Decision |
Constant, Trend | Constant | NON | Constant, Trend | Constant | NON | Stationary at |
LN_Y1 | 0.0130 | 0.0055 | | | | | Level with Constant |
LN_X1 | 0.0729 | 0.0248 | | | | | Level with Constant |
LN_X2 | 0.7918 | 0.3709 | 0.3018 | 0.0110 | 0.0031 | 0.0002 | First Difference without Constant and Trend |
LN_X3 | 0.0123 | | | | | | Level with Constant and Trend |
The results of the unit root test using the Augmented Dickey-Fuller (ADF) test showed that the GDP growth rate variable (LN_Y1), the public debt-to-GDP ratio variable (LN_X1), and the domestic debt-to-GDP ratio variable (LN_X3) are stationary at level I (0). On the other hand, the external debt-to-GDP ratio variable (LN_X2) was found to be non-stationary at level, but became stationary after taking the first difference; meaning it is integrated of order one I (1). These results indicate that the Augmented Autoregressive Distributed Lag (AUG_ARDL) model is suitable for estimating the relationship between the variables.
4.2. Augmented ARDL Estimation and Diagnostic Tests
4.2.1. Augmented ARDL Model Estimation
Table 2. Augmented ARDL Model Estimation.
Dependent Variable: LN_Y1 | | |
Method: ARDL | | | |
Date: 07/12/26 Time: 12:52 | |
Sample (adjusted): 1984S2 2024S1 | |
Included observations: 80 after adjustments |
Maximum dependent lags: 12 (Automatic selection) |
Model selection method: Akaike info criterion (AIC) |
Dynamic regressors (12 lags, automatic): LN_X2 LN_X3 |
Fixed regressors: X12 | | |
Number of models evalulated: 2028 | |
Selected Model: ARDL (8, 1, 9) | |
Note: final equation sample is larger than selection sample |
Variable | Coefficient | Std. Error | t-Statistic | Prob.* |
LN_Y1(-1) | 1.526878 | 0.119622 | 12.76417 | 0.0000 |
LN_Y1(-2) | -1.578731 | 0.223743 | -7.056002 | 0.0000 |
LN_Y1(-3) | 1.515385 | 0.284605 | 5.324519 | 0.0000 |
LN_Y1(-4) | -1.333865 | 0.319641 | -4.173017 | 0.0001 |
LN_Y1(-5) | 1.030681 | 0.327865 | 3.143611 | 0.0026 |
LN_Y1(-6) | -0.780210 | 0.277506 | -2.811508 | 0.0067 |
LN_Y1(-7) | 0.462055 | 0.206762 | 2.234717 | 0.0292 |
LN_Y1(-8) | -0.264601 | 0.108254 | -2.444262 | 0.0175 |
LN_X2 | -0.412090 | 0.210052 | -1.961848 | 0.0545 |
LN_X2(-1) | 0.510341 | 0.213413 | 2.391333 | 0.0200 |
LN_X3 | -0.226651 | 0.130973 | -1.730516 | 0.0888 |
LN_X3(-1) | 0.318087 | 0.259918 | 1.223800 | 0.2259 |
LN_X3(-2) | -0.249058 | 0.276155 | -0.901878 | 0.3708 |
LN_X3(-3) | 0.276345 | 0.266521 | 1.036860 | 0.3040 |
LN_X3(-4) | -0.538449 | 0.266593 | -2.019739 | 0.0480 |
LN_X3(-5) | 0.644167 | 0.266876 | 2.413730 | 0.0189 |
LN_X3(-6) | 0.140703 | 0.271867 | 0.517545 | 0.6067 |
LN_X3(-7) | -0.589490 | 0.273653 | -2.154151 | 0.0353 |
LN_X3(-8) | 0.106111 | 0.265330 | 0.399921 | 0.6907 |
LN_X3(-9) | 0.182012 | 0.136308 | 1.335296 | 0.1869 |
X12 | 0.027725 | 0.047579 | 0.582714 | 0.5623 |
R-squared | 0.911766 | Mean dependent var | 1.426761 |
Adjusted R-squared | 0.881856 | S. D. dependent var | 0.369078 |
S. E. of regression | 0.126860 | Akaike info criterion | -1.070958 |
Sum squared resid | 0.949511 | Schwarz criterion | -0.445676 |
Log likelihood | 63.83832 | Hannan-Quinn criter. | -0.820265 |
Durbin-Watson stat | 1.982380 | | | |
*Note: p-values and any subsequent tests do not account for model |
selection. | | |
From
Table 2 of the Augmented ARDL model, the overall model is statistically significant, with a coefficient of determination
, meaning that the model explains about 91.2% of the variations in the GDP growth rate. The adjusted coefficient of determination
is also high.
4.2.2. Diagnostic Tests for the Augmented ARDL Model
(i). Heteroskedasticity Test
Table 3. Breusch-Pagan-Godfrey Heteroskedasticity Test.
Heteroskedasticity Test: Breusch-Pagan-Godfrey |
Null hypothesis: Homoskedasticity | |
F-statistic | 0.535259 | Prob. F (21,58) | 0.9427 |
Obs*R-squared | 12.98714 | Prob. Chi-Square (21) | 0.9091 |
Scaled explained SS | 10.03245 | Prob. Chi-Square (21) | 0.9785 |
From the previous table, the null hypothesis of homoskedasticity (constant variance of residuals) is accepted.
(ii). Serial Correlation Test
Table 4. Breusch-Godfrey Serial Correlation LM Test.
Breusch-Godfrey Serial Correlation LM Test: |
Null hypothesis: No serial correlation at up to 2 lags |
F-statistic | 0.037837 | Prob. F (2,57) | 0.9629 |
Obs*R-squared | 0.106068 | Prob. Chi-Square (2) | 0.9483 |
From the previous table, the null hypothesis of no serial correlation in the residual series is accepted.
(iii). Histogram-Normality Test
Figure 11. Histogram-Normality Test Source: EViews 13 outputs based on World Bank data.
From
Figure 11, using the Histogram-Normality Test, we accept the null hypothesis that the residuals follow a normal distribution.
From the above, it is clear that the model passed the diagnostic tests in accordance with statistical theory.
4.3. Optimal Lag Length Test
Figure 12. Optimal Lag Length Test.
Source: EViews 13 outputs based on World Bank data https://data.albankaldawli.org/about/get-started U.S. Energy Information Administration. (2023). Energy Institute - Statistical Review of World Energy (2024); Population based on various sources (2023).
From
Figure 12, the optimal lag length for the variables is ARDL (8, 1, 9).
4.4. Augmented ARDL Bounds Tests (Overall F, t-Bounds, and Exogenous F)
4.4.1. Augmented ARDL Bounds Test
Table 5. Overall F-Bounds Test.
Overall F-Bounds Test | Null Hypothesis: No levels relationship |
Test Statistic | Value | Signif. | I (0) | I (1) |
F-statistic | | | Asymptotic: n=1000 | |
10.65707 | 10% | 2.17 | 3.19 |
k | 2 | 5% | 2.72 | 3.83 |
| 2.5% | 3.22 | 4.5 |
| 1% | 3.88 | 5.3 |
Actual Sample Size | 80 | | Finite Sample: n=80 | |
| 10% | -1 | -1 |
| 5% | -1 | -1 |
| 1% | -1 | -1 |
From
Table 5, since the F-statistic value = 10.65707 is greater than the upper bound of the critical values at the 1% significance level, the null hypothesis is rejected and the alternative hypothesis of cointegration is accepted (i.e., a long-run equilibrium relationship exists).
4.4.2. Determining the Type of Cointegration
Table 6. Augmented t-Bounds Test.
t-Bounds Test | Null Hypothesis: No levels relationship |
Test Statistic | Value | Signif. | I (0) | I (1) |
t-statistic | -5.606175 | 10% | -1.62 | -2.68 |
5% | -1.95 | -3.02 |
2.5% | -2.24 | -3.31 |
1% | -2.58 | -3.66 |
From
Table 6, since the absolute value of the t-statistic = 5.606175 is greater than the absolute upper bound of the critical values at the 5% significance level, the null hypothesis is rejected and the alternative hypothesis of cointegration is accepted, meaning that the cointegrating relationship is degenerate-free (case I).
4.4.3. Exogenous F-Bounds Test
Table 7. Exogenous F-Bounds Test.
Exogenous F-Bounds Test | Null Hypothesis: No exo. levels relationship |
Test Statistic | Value | Signif. | I (0) | I (1) |
F-statistic | | | Asymptotic: n=1000 | |
13.23632 | 10% | 2.32 | 4.09 |
k | 2 | 5% | 3.02 | 5.05 |
| 2.5% | 3.73 | 5.99 |
| 1% | 4.65 | 7.13 |
Actual Sample Size | 80 | | Finite Sample: n=80 | |
| 10% | 2.37 | 4.18 |
| 5% | 3.13 | 5.23 |
| 2.5% | 3.89 | 6.28 |
| 1% | 4.92 | 7.54 |
From
Table 7, the results show that the F-statistic value reached 13.236, which exceeds all upper bound critical values, both for asymptotic critical values and finite sample critical values. At a sample size of (80) observations, the upper bound critical value at the (1%) significance level was 7.54, whereas the calculated F-statistic value reached 13.236, which is distinctly higher than the critical value.
4.5. Parameter Structural Stability Test (CUSUM Test)
This test is used to ensure the absence of any structural change in the data that could lead to an error in the stability and consistency of the short-run model parameters with the long-run model parameters.
Figure 13. Parameter Structural Stability Test (CUSUM Test).
From
Figure 13, we find that the cumulative sum path of recursive residuals for estimating the model parameters lies between the upper and lower boundary lines (the red lines) and does not cross either boundary. Therefore, this indicates that the model parameters are stable, which is a desirable property, confirming the structural stability of the model parameters.
4.6. CUSUM of Squares (CUSUMSQ) Test
Figure 14. Parameter Structural Stability Test (CUSUM of Squares Test) Source: EViews 13 outputs based on World Bank data https://data.albankaldawli.org/about/get-started U.S. Energy Information Administration. (2023). Energy Institute - Statistical Review of World Energy (2024); Population based on various sources. (2023).
From
Figure 14, the plot of the CUSUM of Squares test shows that the cumulative sum path of squared residuals remained within the confidence bounds at a (5%) significance level throughout the study period, without crossing the critical boundaries. This result indicates the absence of influential structural changes in the model parameters, confirming the stability of the Augmented ARDL model parameters during the study period. Consequently, the model estimation results can be relied upon to interpret the relationship between the variables, as the parameters exhibit constancy and stability over time, which enhances the reliability of the econometric analysis results.
4.7. Long-Run Parameter Estimation
Table 8. Long-Run Model.
Levels Equation |
Case 1: No Constant and No Trend |
Variable | Coefficient | Std. Error | t-Statistic | Prob. |
LN_X2 | 0.232599 | 0.033125 | 7.021870 | 0.0000 |
LN_X3 | 0.150985 | 0.036769 | 4.106315 | 0.0001 |
EC = LN_Y1 - (0.2326*LN_X2 + 0.1510*LN_X3) |
The long-run equation estimation results within the Augmented ARDL model framework show a positive and statistically significant relationship between both the external debt-to-GDP ratio () and the domestic debt-to-GDP ratio () on one hand, and the GDP growth rate () on the other hand. The coefficient of the external debt ratio reached (0.2326) with a significance level approaching zero, indicating that a (1%) increase in the external debt ratio leads to an increase in the GDP growth rate by about (0.2326%) in the long run. Similarly, the coefficient of the domestic debt ratio reached (0.1510) and was also significant at the (0.001%) level, meaning that a (1%) increase in the domestic debt ratio leads to an increase in economic growth by about (0.150985%) in the long run, ceteris paribus.
These results indicate that utilizing both external debt and domestic debt (public debt) to finance investment and productive expenditure contributed to supporting long-run economic growth.
4.8. Short-Run Parameter Estimation and Error Correction Coefficient
Table 9. Error Correction Model (ECM) Regression.
ARDL Error Correction Regression | |
Dependent Variable: D (LN_Y1) | |
Selected Model: ARDL (8, 1, 9) | |
Case 1: No Constant and No Trend | |
Date: 07/12/26 Time: 14:51 | |
Sample: 1980S1 2024S2 | | |
Included observations: 80 | | |
ECM Regression |
Case 1: No Constant and No Trend |
Variable | Coefficient | Std. Error | t-Statistic | Prob. |
D (LN_Y1(-1)) | 0.949285 | 0.102394 | 9.270865 | 0.0000 |
D (LN_Y1(-2)) | -0.629446 | 0.151178 | -4.163597 | 0.0001 |
D (LN_Y1(-3)) | 0.885940 | 0.154009 | 5.752515 | 0.0000 |
D (LN_Y1(-4)) | -0.447926 | 0.175887 | -2.546669 | 0.0135 |
D (LN_Y1(-5)) | 0.582756 | 0.161449 | 3.609545 | 0.0006 |
D (LN_Y1(-6)) | -0.197454 | 0.121893 | -1.619902 | 0.1106 |
D (LN_Y1(-7)) | 0.264601 | 0.098667 | 2.681745 | 0.0095 |
D (LN_X2) | -0.412090 | 0.203883 | -2.021207 | 0.0478 |
D (LN_X3) | -0.226651 | 0.125898 | -1.800267 | 0.0769 |
D (LN_X3(-1)) | 0.027659 | 0.156903 | 0.176283 | 0.8607 |
D (LN_X3(-2)) | -0.221399 | 0.152162 | -1.455025 | 0.1510 |
D (LN_X3(-3)) | 0.054946 | 0.146588 | 0.374832 | 0.7091 |
D (LN_X3(-4)) | -0.483503 | 0.149239 | -3.239782 | 0.0020 |
D (LN_X3(-5)) | 0.160664 | 0.149024 | 1.078109 | 0.2854 |
D (LN_X3(-6)) | 0.301367 | 0.151355 | 1.991126 | 0.0511 |
D (LN_X3(-7)) | -0.288123 | 0.155241 | -1.855971 | 0.0685 |
D (LN_X3(-8)) | -0.182012 | 0.133955 | -1.358760 | 0.1794 |
X12 | 0.027725 | 0.019363 | 1.431850 | 0.1575 |
CointEq (-1)* | -0.422407 | 0.073470 | -5.749347 | 0.0000 |
R-squared | 0.789924 | Mean dependent var | -0.017522 |
Adjusted R-squared | 0.727934 | S. D. dependent var | 0.239193 |
S. E. of regression | 0.124763 | Akaike info criterion | -1.120958 |
Sum squared resid | 0.949511 | Schwarz criterion | -0.555227 |
Log likelihood | 63.83832 | Hannan-Quinn criter. | -0.894140 |
Durbin-Watson stat | 1.982380 | | | |
The error correction model table shows that the error correction coefficient () reached (), which is negative and stsatistically significant at the (1%) significance level, with a p-value of (). This result confirms the existence of a long-run equilibrium relationship among the study variables and validates the Augmented Autoregressive Distributed Lag (Augmented ARDL) model. From an economic perspective, the value of the error correction coefficient means that approximately 42.24% of the disequilibria occurring in the GDP growth rate from its equilibrium level are corrected within a single period, reflecting a moderate speed of adjustment in returning economic growth to its equilibrium path following shocks.
Regarding short-run relationships, the results indicated that the change in the external debt-to-GDP ratio negatively affects the GDP growth rate, as its coefficient reached () and was significant at the (5%) level. This suggests that an increase in external debt in the short run leads to a decrease in the economic growth rate.
As for domestic debt, the coefficient of change in the domestic debt-to-GDP ratio reached () and was statistically significant at the (10%) level. Additionally, some lagged periods showed statistically significant positive and negative effects, reflecting that the short-run impact of domestic debt is dynamic and varies across time periods.
The dummy variable for economic reform () did not have a statistically significant effect in the short run, indicating the absence of a direct impact of the economic reform program on the growth rate during the study period according to the estimated model. The model results also show a difference between the short- and long-run horizons:
1) In the short run: External debt shows a negative effect on economic growth.
2) In the long run: External debt and domestic debt show a positive and significant effect on economic growth.
This pattern is not economically contradictory; it can be explained by the fact that borrowing may initially impose financial burdens and debt servicing that negatively affect economic activity, whereas directing these resources toward productive investments and infrastructure yields positive effects on growth over time.
4.9. Assessing the Model's Forecasting Performance
Figure 15. Assessing the Model's Forecasting Performance Source: EViews 13 outputs based on World Bank data.
From
Figure 15, the predictive power of the Augmented ARDL model was evaluated using a set of forecast accuracy metrics. The results showed that the model possesses good forecasting efficiency, with the Root Mean Squared Error (RMSE) reaching 0.219 and the Mean Absolute Error (MAE) standing at 0.173, indicating low discrepancies between actual and estimated values. The Mean Absolute Percentage Error (MAPE) reached 15.91%, while the Symmetric Mean Absolute Percentage Error (sMAPE) was 13.82%. Both figures reflect a good level of predictive accuracy.
Likewise, the Theil Inequality Coefficient recorded a value of 0.0749, which is close to zero, demonstrating high forecasting quality. The Theil U2 coefficient reached approximately 0.277, well below 1, indicating that the model outperforms the naive forecast model.
The breakdown of the Theil coefficient components showed that the Bias Proportion was 0.000073, nearly equal to zero, indicating the absence of systematic bias in the estimates. The Variance Proportion stood at 0.1065, whereas the Covariance Proportion accounted for 89.34% of the total error. This suggests that most forecast errors are attributable to random, unpredictable fluctuations rather than model misspecification or systematic deviation in estimates.
Based on these results, it can be concluded that the Augmented ARDL model possesses a high degree of efficiency and reliability in explaining the relationships among the study variables, alongside solid predictive capabilities. This reinforces confidence in the study's findings and their suitability for economic analysis and forecasting.
4.10. Debt Threshold (Threshold Regression Model)
Table 10. Threshold Regression Model.
Dependent Variable: Y1 | | |
Method: Discrete Threshold Regression | |
Date: 07/12/26 Time: 15:25 | |
Sample (adjusted): 1980S1 2024S1 | |
Included observations: 89 after adjustments |
Selection: Trimming 0.15, Max. thresholds 5, Sig. level 0.05 |
Threshold variable: X1 | | |
Variable | Coefficient | Std. Error | t-Statistic | Prob. |
X1 < 79.799999 -- 20 obs |
X1 | 0.067430 | 0.005391 | 12.50741 | 0.0000 |
79.799999 <= X1 -- 69 obs |
X1 | 0.049244 | 0.002112 | 23.31539 | 0.0000 |
R-squared | 0.101077 | Mean dependent var | 4.855449 |
Adjusted R-squared | 0.090744 | S. D. dependent var | 1.828416 |
S. E. of regression | 1.743484 | Akaike info criterion | 3.971864 |
Sum squared resid | 264.4572 | Schwarz criterion | 4.027788 |
Log likelihood | -174.7479 | Hannan-Quinn criter. | 3.994405 |
Durbin-Watson stat | 0.408132 | | | |
The results of the threshold regression model showed that the estimated threshold value for public debt reached 79.8% of GDP, which is the point at which the impact of public debt splits into two distinct regimes. It was found that when the public debt ratio is below this threshold, its effect on the GDP growth rate is positive and statistically significant, with the regression coefficient reaching 0.0674 at a (1%) significance level. This indicates that an increase in the public debt ratio at this stage contributes to supporting economic growth.
However, when the public debt ratio exceeds 79.8% of GDP, the effect of public debt remains positive and statistically significant, but the regression coefficient drops to 0.0492, reflecting a decline in the positive impact of public debt on economic growth. This result suggests that the continued increase in public debt beyond the threshold does not turn its effect negative, but rather diminishes its efficiency in supporting economic growth.
The 79.8% GDP ratio can be considered a threshold for public debt, as it represents the level beyond which the economic returns of borrowing expansion begin to diminish. This outcome necessitates exercising caution in public debt management and directing borrowing toward high-return investment activities to ensure its continued contribution to economic growth.
Theoretical Interpretation of the Results:
The study results indicate a long-run equilibrium relationship between public debt and economic growth, which aligns with the Savings-Investment Gap theory and the Two-Gap Model. Both theories posit that public borrowing serves as an important source for financing investment when domestic savings are insufficient, particularly in developing countries such as Egypt. Consequently, directing debt toward infrastructure projects and public investments enhances productive capacity and boosts long-run economic growth rates.
Long-run results showed that external debt and domestic debt positively and significantly affect economic growth. This finding can be explained through Keynesian economics, which posits that expanding public expenditure financed by borrowing stimulates aggregate demand, investment, and production. Such positive effects are particularly evident when loans are funneled into high-yielding productive projects, appearing more distinctly in the long run once these projects are completed and yield economic returns.
Conversely, the error correction model results indicated that external debt exerts a negative impact in the short run, consistent with the Debt Overhang Theory. This theory suggests that an increase in external debt can heighten short-term debt servicing burdens, weaken investor confidence, and reduce resources available for investment before the positive impacts of debt-financed investments materialize over the long run.
The Threshold Regression model results demonstrated that the public debt threshold stood at approximately 79.8% of GDP. While the impact of public debt remained positive both below and above this threshold, its magnitude diminished once exceeded. This finding aligns with economic literature establishing that borrowing yields high economic returns in initial stages, but the marginal return of debt diminishes at higher indebtedness levels due to escalating debt service burdens and reduced efficiency in utilizing borrowed resources.
The change in the positive slope from 0.0674 to 0.0492 after exceeding the debt threshold means that crossing the threshold affects its contribution to growth, as the growth rate declines by (−0.0182). This implies a negative effect, even though the slope remains positive.
Overall, the findings indicate that the impact of public debt depends not solely on its volume, but largely on the efficiency of debt management and the allocation of resources toward productive uses. Debt used to finance productive investment and infrastructure can support economic growth, whereas expanding borrowing without securing adequate economic returns reduces debt efficiency and undermines its contribution to sustainable growth. This outcome harmonizes with modern literature emphasizing that public debt management quality is no less critical than its size in shaping economic performance.
5. Results and Recommendations
5.1. Findings
In light of the econometric analysis of the impact of public debt on economic growth in Egypt during the period (1980–2024), the study reached the following findings:
1) Results of the Augmented Bounds Test, including all its components (Overall F-Bounds, t-Bounds, and Exogenous F-Bounds), confirmed the existence of cointegration among the GDP growth rate, the external debt-to-GDP ratio, and the domestic debt-to-GDP ratio, indicating a long-run equilibrium relationship among the variables.
2) Results of the long-run relationship demonstrated a statistically significant positive effect of both the external debt-to-GDP ratio and the domestic debt-to-GDP ratio on the economic growth rate. The external debt coefficient reached (0.2326), while the domestic debt coefficient reached (0.1510), both significant at the (1%) level.
3) Results of the Error Correction Model (ECM) showed that the error correction coefficient reached (-0.422), which was negative and statistically significant at the (1%) level. This indicates that approximately 42.2% of short-run disequilibria are corrected within a single period, confirming the speed with which economic growth returns to its long-run equilibrium path.
4) Short-run results revealed a statistically significant negative effect of external debt on economic growth. In contrast, the effect of domestic debt varied across lag lengths, showing positive impacts in some lags and negative impacts in others, reflecting the dynamic nature of short-run domestic debt effects.
5) Results of the Threshold Regression model indicated that the threshold value for the public debt-to-GDP ratio reached approximately 79.8%. While the impact of public debt remained positive both before and after the threshold, its magnitude diminished once exceeded, pointing to a decline in the efficiency of public debt in supporting economic growth at higher indebtedness levels.
6) Diagnostic tests and stability tests confirmed the validity of the Augmented ARDL model. Results from the CUSUM of Squares test showed that the model parameters were stable and did not experience structural changes during the study period. Forecast evaluation metrics also indicated that the model possesses a high degree of precision and predictive capability.
7) Overall results suggest that public borrowing can contribute to supporting economic growth if directed toward productive uses; however, high public debt levels reduce the efficiency of its contribution to growth, necessitating the implementation of prudent public debt management policies.
5.2. Recommendations
According to the study's findings, the following recommendations can be provided:
1) Maintain the public debt ratio at levels that the economy can absorb, taking into account that the study's results indicated a decline in the positive impact of debt after exceeding a ratio of approximately 79.8% of GDP.
2) Direct public borrowing toward financing investment projects, infrastructure, and productive sectors with high economic returns to ensure maximizing the contribution of debt in supporting economic growth.
3) Raise the efficiency of public debt management by improving the allocation of borrowed resources into activities that yield economic returns exceeding the borrowing costs, thereby enhancing debt servicing capabilities and sustainability.
4) Give special attention to managing external debt due to the emergence of its negative impact in the short run, while working to direct its resources toward projects with long-term developmental impacts.
5) Improve domestic debt management to ensure providing the necessary funding for investment expenditure without limiting the private sector's ability to access financing.
6) Enhance coordination between fiscal and monetary policies to contribute to achieving economic stability, improving the efficiency of public debt management, and supporting sustainable economic growth.
7) Rely on econometric models in the periodic evaluation of public debt sustainability, while updating estimates of safe debt levels in accordance with domestic and global economic developments.
8) Increase the efficiency of public spending and raise the productivity of government investments to reduce the need for continuous expansion in borrowing and support long-term economic growth.
9) Account for the difference between the short-run and long-run effects of public debt when designing economic policies, so that debt management policies aim to strike a balance between financing development and maintaining fiscal sustainability.

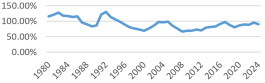
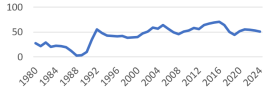
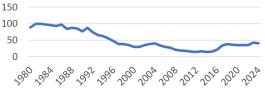
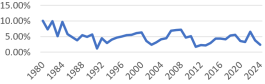
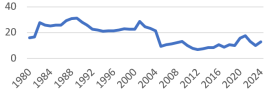
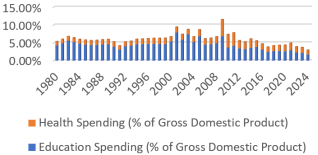
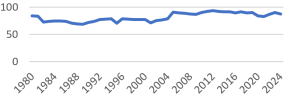
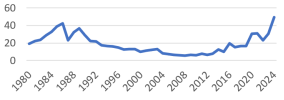
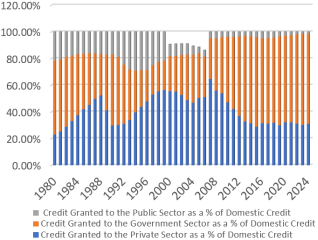
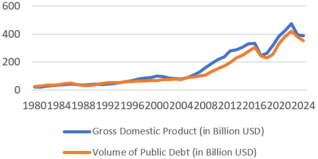
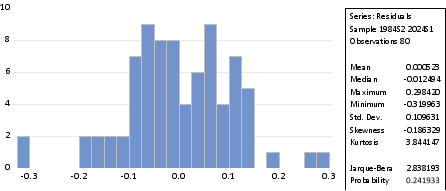
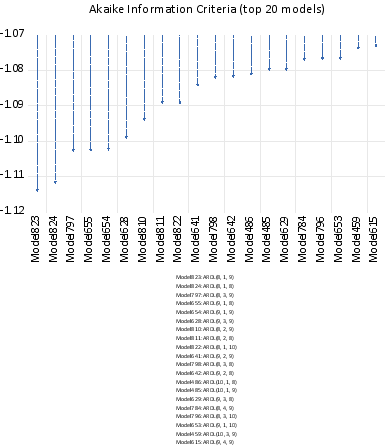
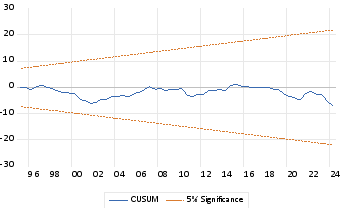
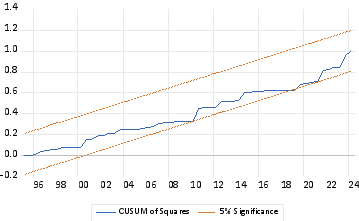
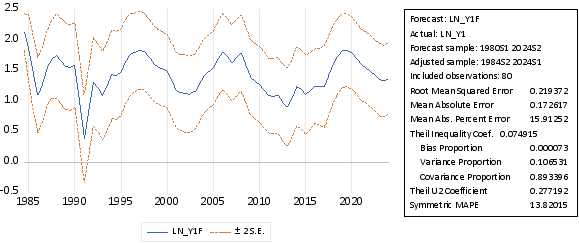



 Share This Article
 Twitter
 Linked In
 Facebook

 Copy
 Download