Abstract
Optimum lower-body anaerobic power is critical for athletic performances, yet there is limited information of the power profile of Indian adolescent athletes across various sports, age and sexes. This study aims to develop a power profile for this demographic and also examine the effects of sex, chronological age and sport type on anaerobic power. The study included 391 Indian adolescent athletes divided into different groups based on sex, age group, and sport type. Participants completed a 30-second Wingate anaerobic power test on a peak bike and the relative peak (PP), average (AP) and minimum power (MP) along with fatigue index (FI) were measured. A three-way MANOVA (sports-age -sex) was used to find power differences between the groups. Male athletes of all developmental stages and sport types showed significantly higher PP, AP, and MP than females. Middle and late adolescents athletes had higher power output than the early adolescents. Athletes involved in power sports achieved the highest PP and AP, whereas endurance athletes had greater MP and lowest FI. MANOVA revealed significant effects of sex (p<0.001, ηp2=0.373), age group (p=0.013, ηp2=0.027) and sport type (p<0.001, ηp2=0.084) on all anaerobic power variables, but none had three-way interaction effect. Two way interaction of sex and sport type was found only for MP (p<0.001, ηp2=0.080). These anaerobic power profiling and regular assessment can help coaches and sport science professionals to identify talents, monitor performance progress, and develop age-, sex-, and sport-specific training strategies accordingly.
Keywords
Anaerobic Power, Peak Power, Endurance Sports, Power Sports, Wingate Test, Fatigue Index
1. Introduction
Success in sports is determined by various factors including an optimal anaerobic peak power and capacity. The ability to generate high mechanical work through ATP-PCr breakdown and anaerobic glycolysis, underpins various actions in sports like sprint acceleration, jumps, change of direction, repeated high-intensity bursts
| [1] | Zupan MF, Arata AW, Dawson LH, et al. Wingate Anaerobic Test Peak Power and Anaerobic Capacity Classifications for Men and Women Intercollegiate Athletes. J Strength Cond Res. 2009, 23: 2598–2604.
https://doi.org/10.1519/jsc.0b013e3181b1b21b |
[1]
. High lower-body anaerobic power is associated with faster sprinting, higher vertical jumps, and on-field accelerations
| [2] | Nikolaidis PT, Matos B, Clemente FM, et al. Normative data of the wingate anaerobic test in 1 year age groups of male soccer players. Front Physiol. 2018, 9: 1619.
https://doi.org/10.3389/fphys.2018.01619 |
| [3] | Kasabalis A, Douda H, Tokmakidis SP. Relationship between Anaerobic Power and Jumping of Selected Male Volleyball Players of Different Ages. Percept Mot Skills. 2005, 100: 607–614. https://doi.org/10.2466/pms.100.3.607-614 |
[2, 3]
, whereas lower anaerobic power is associated with poor high‑intensity output and repeated‑sprint ability
| [4] | Meckel Y, Machnai O, Eliakim A. Relationship Among Repeated Sprint Tests, Aerobic Fitness, and Anaerobic Fitness in Elite Adolescent Soccer Players. J Strength Cond Res. 2009, 23: 163–169.
https://doi.org/10.1519/jsc.0b013e31818b9651 |
[4]
. Risk of muscle damage and injury is also high in athletes who have poor anaerobic power quality.
Demand for anaerobic power is different for different sports. It also differs in males and females due to their unique physical and physiological differences with males generally outperforming females in strength and power after puberty
. Changes in hormonal levels, specifically growth hormone, metabolic hormones, and testosterone level changes as age progresses causing different musculoskeletal development and maturation resulting in different anaerobic power output. Previous studies have found peak power and average power to be higher in sprint athletes, and gradually lower in middle-distance athletes towards marathoners. Endurance athletes require a certain amount of anaerobic power to maintain performance and anaerobic capabilities
| [6] | Legaz-Arrese A, Munguía-Izquierdo D, Carranza-García LE, et al. Validity of the Wingate anaerobic test for the evaluation of elite runners. J Strength Cond Res. 2011, 25: 819–824. https://doi.org/10.1519/jsc.0b013e3181c1fa71 |
[6]
. This anaerobic power together with total muscle mass are decisive even for an event that is 65-75% aerobic like rowing
| [7] | Maciejewski H, Rahmani A, Chorin F, et al. The 1,500-m Rowing Performance is Highly Dependent on Modified Wingate Anaerobic Test Performance in National-Level Adolescent Rowers. Pediatr Exerc Sci. 2016, 28: 572–579.
https://doi.org/10.1123/pes.2015-0283 |
[7]
. Whereas, wrestlers recorded the highest anaerobic power, exceeding both rowers and soccer players in absolute power and athletes performed better than the non-athletes
. Because anaerobic power has such a broad relevance, it is important to understand how this changes at different stages of growth. In this context, adolescence is an important period when anaerobic performance is evaluated although musculoskeletal maturation has not been achieved. Literature suggests that peak power and average power rise across adolescence while fatigue index does not
| [2] | Nikolaidis PT, Matos B, Clemente FM, et al. Normative data of the wingate anaerobic test in 1 year age groups of male soccer players. Front Physiol. 2018, 9: 1619.
https://doi.org/10.3389/fphys.2018.01619 |
| [9] | Leiter JR, Cordingley DM, MacDonald PB. Development of Anaerobic Fitness in Top-Level Competitive Youth Ice Hockey Players. J Strength Cond Res. 2018, 32: 2612–2615. https://doi.org/10.1519/jsc.0000000000002403 |
[2, 9]
. Furthermore, it has been seen that these changes in power are not the same for a male and a female. As puberty progresses, sex differences in physical performance also become more pronounced. While these studies have majorly focused on only males
, only females, sometimes both and among adult athletes in certain sports like soccer
| [2] | Nikolaidis PT, Matos B, Clemente FM, et al. Normative data of the wingate anaerobic test in 1 year age groups of male soccer players. Front Physiol. 2018, 9: 1619.
https://doi.org/10.3389/fphys.2018.01619 |
[2]
, athletics
| [6] | Legaz-Arrese A, Munguía-Izquierdo D, Carranza-García LE, et al. Validity of the Wingate anaerobic test for the evaluation of elite runners. J Strength Cond Res. 2011, 25: 819–824. https://doi.org/10.1519/jsc.0b013e3181c1fa71 |
[6]
, wrestling
| [1] | Zupan MF, Arata AW, Dawson LH, et al. Wingate Anaerobic Test Peak Power and Anaerobic Capacity Classifications for Men and Women Intercollegiate Athletes. J Strength Cond Res. 2009, 23: 2598–2604.
https://doi.org/10.1519/jsc.0b013e3181b1b21b |
| [8] | Jakovljević DK, Eric M, Jovanovic G, et al. Explosive muscle power assessment in elite athletes using wingate anaerobic test. Rev Bras Med Esporte. 2018, 24: 107–111.
https://doi.org/10.1590/1517-869220182402183151 |
[1, 8]
, but there is a significant gap in the literature that has not explored anaerobic power of adolescent athletes of different sports classified based on the metabolic demand.
Besides the importance of considering age, sex and sports while interpreting anaerobic power, having a reliable methodology for power measurement in sports is equally important. Although, there are several tests that can measure an athlete’s anaerobic power and capacity such as the DeBruyn-Prevost test, repeated sprint test, Conconi test, Bosco repeated jumps, etc., the 30-second Wingate Anaerobic Test (WAnT) is popular to date and valuable for coaches, athletes, and research scientists to precisely monitor individual's performance improvement, training adaptations, and also objectively select athletes for a sport. However, there has been limited research simultaneously addressing both sexes, different adolescent stages, and various sports types, particularly within the Indian athlete population. The combined effect of these factors on power performance and normative data on Indian athletes also remains scanty.
Previous studies on Indian population primarily focused on test-method validation such as comparison of running based anaerobic sprint test (RAST) with WAnT in 35 male Indian sprinters
| [10] | Chatterjee S, Chakraborty S, Chatterjee S. Validity and Reliability Study of The Running-Based Anaerobic Sprint Test for Evaluating Anaerobic Power Performance as Compared to Wingate Test in Indian Male Track and Field Sprinters. Eur J Phys Educ Sport Sci. 2022, 8.
http://dx.doi.org/10.46827/ejpe.v8i4.4327 |
[10]
, or correlating the standing broad jump with the WAnT in 95 elite athletes of various sports
| [11] | Krishnan A, Sharma D, Bhatt M, et al. Comparison between Standing Broad Jump test and Wingate test for assessing lower limb anaerobic power in elite sportsmen. Med J Armed Forces India. 2017, 73: 140–145.
https://doi.org/10.1016/j.mjafi.2016.11.003 |
[11]
. Furthermore, few studies have reported anaerobic power measures in some specific sports disciplines, like wrestling
and gymnastics
| [13] | Ghosh R, Sinha S, Adhikari S. Anthropometrical and Physiological characteristics of Indian National Artistic Gymnasts: A Gender-Based Perspective. Int J Kinanthropometry. 2025, 5: 132–139. https://doi.org/10.34256/ijk25113 |
[13]
. Unfortunately, a comprehensive profile of lower-body anaerobic power variables (peak, average, minimum power and fatigue index) with a large sample size in a structured cohort of Indian adolescent athletes spanning both sexes, multiple adolescence stages, and varying sport types remains scarce. Therefore, this study aims: (1) to develop the lower-body anaerobic power and capacity profile in Indian adolescent athletes using the WAnT and (2) to examine the effects of sex, adolescent age, sport type, and their interaction on anaerobic power outputs. By profiling lower-body anaerobic power outputs, this study will provide sex, sport, age-specific reference information that may assist coaches and sport scientist professionals to identify and nurture talents, channelize them, and reduce injury risk by designing individualized training programs.
2. Materials & Methods
2.1. Participants
In this study 401 athletes between 12 to 21 years involved in various games were selected based on the inclusion and exclusion criterion (
Figure 1) from a pool of 410 initially selected athletes in Kalinga Stadium sports complex, Bhubaneswar. Athletes who were engaged in sport-specific strength and conditioning training for a minimum of 2 years, regularly undergoing training for 5 days a week, and free from any injuries were included in this study. Athletes failing to meet the inclusion criteria and refraining from providing written consent were excluded from the study. Following the exclusion of ten individuals who were either absent or did not finish the test, the final data screening included 391 athletes. All participants and their guardians were informed about the test procedure and risks involved, and written informed consent was obtained from everyone before participation. The study was conducted in accordance with the Declaration of Helsinki and received approval from the Institutional Ethical Committee (Certificate no. RKMVERI/IEC/DSSY/2025-06/002) during July to October 2025.
2.2. Study Design
This study followed analytical cross-sectional study design. Demographic details of each participant were collected on the test day and underwent a well-familiarized lower-body Wingate anaerobic power test in a controlled laboratory condition (average room temperature: 26-28°C; relative humidity: 50-70%). The participants were instructed to take adequate rest and to abstain from vigorous training for at least 24 hours prior to assessment. A total of 391 participants who successfully completed the 30s bout of the test were included in the final analysis and categorized based on their chronological age, sex, and sport type. Based on chronological age, participants were categorized into early adolescents (12-14 years), middle adolescents (15-17 years), and late adolescents (18-21 years) (
Table 1)
. Based on the physiological and performance demands of the sports they were involved in, participants were further grouped into power (weightlifting, sprint, judo), endurance (rowing), and mixed (basketball, football, badminton) categories (
Figure 1)
| [15] | Pelliccia A, Sharma S, Gati S, et al. 2020 ESC Guidelines on sports cardiology and exercise in patients with cardiovascular disease. Eur Heart J. 2021, 42: 17–96.
https://doi.org/10.1093/eurheartj/ehaa605 |
[15]
.
Table 1. Demographic details of the participants.
Groups | Power sports | Endurance sports | Mixed sports |
Early adolescent | Middle adolescent | Late adolescent | Early adolescent | Middle adolescent | Late adolescent | Early adolescent | Middle adolescent | Late adolescent |
Age (years) | Male | 13.5 ± 0.7 (13.0-14.0) n=13 | 15.9 ± 0.9 (15.5-16.3) n=24 | 19.5 ± 1.1 (18.8-20.1) n=15 | - | 16.3 ± 0.6 (16.0-16.5) n=28 | 19.2 ± 1.1 (18.8-19.6) n=32 | - | 15.0 ± 0.4 (14.6-15.3) n=9 | - |
Female | 13.4 ± 0.6 (13.1-13.7) n=19 | 15.9 ± 0.9 (15.6-16.2) n=36 | 18.5 ± 1.3 (17.9-19.1) n=22 | 13.7 ± 0.7 (13.1-14.3) n=9 | 16.0 ± 0.8 (15.5-16.4) n=20 | 19.7 ± 1.2 (19.3-20.1) n=42 | 13.6 ± 0.6 (13.4-13.8) n=35 | 15.7 ± 0.8 (15.5-16.0) n=48 | 18.9 ± 1.1 (18.4-19.4) n=24 |
Height (cm) | Male | 163.1 ± 7.6 (158.5-167.7) n=13 | 166.1 ± 5.1 (163.9-168.3) n=24 | 169.0 ± 4.2 (166.6-171.3) n=15 | - | 179.6 ± 5.0 (177.7-181.6) n=28 | 181.2 ± 4.1 (180.1-182.9) n=32 | - | 169.1 ± 10.1 (161.2-176.9) n=9 | - |
Female | 153.9 ± 5.3 (151.3-156.5) n=19 | 156.2 ± 6.4 (154.0-158.3) n=36 | 160.9 ± 5.6 (158.4-163.4) n=22 | 166.4 ± 3.3 (163.8-169.0) n=9 | 167.0 ± 4.7 (164.8-169.2) n=20 | 167.1 ± 4.5 (165.7-168.5) n=42 | 159.6 ± 7.8 (156.9-162.3) n=35 | 161.4 ± 7.9 (159.1-163.7) n=48 | 165.2 ± 8.3 (161.7-168.8) n=24 |
Weight (kg) | Male | 51.2 ± 9.2 (45.6-56.8) n=13 | 58.4 ± 7.5 (55.2-61.6) n=24 | 66.3 ± 14.0 (58.5-74.0) n=15 | - | 68.1 ± 6.6 (65.5-70.7) n=28 | 73.1 ± 5.9 (70.9-75.2) n=32 | - | 56.5 ± 10.2 (48.7-64.4) n=9 | - |
Female | 48.9 ± 7.2 (45.4-52.3) n=19 | 53.2 ± 9.9 (49.8-56.5) n=36 | 56.3 ± 9.9 (51.9-60.7) n=22 | 56.0 ± 5.6 (51.6-60.3) n=9 | 59.1 ± 9.0 (54.9-63.3) n=20 | 63.0 ± 9.4 (60.0-65.9) n=42 | 49.5 ± 5.7 (47.5-51.4) n=35 | 51.8 ± 6.3 (50.0-53.7) n=48 | 54.8 ± 7.5 (51.6-58.0) n=24 |
Data is presented as mean ± SD (95% CI). SD= Standard Deviation; CI= Confidence Interval.
2.3. Lower Body 30s-Wingate Anaerobic Test
All participants were well familiarized with the Wingate anaerobic power test. After adequate warm-up on a bicycle ergometer, a Monark 894E peak bike (Sweden) connected to the Monark Anaerobic Test Software software was used for the 30-second Wingate anaerobic power test. For the test, seat height was adjusted so that the knee remained flexed at approximately 15° in the extended position
and resistance was set at 7.5% of body weight and placed in the weight basket of the ergometer. Upon the tester’s command “Go,” participants accelerated to maximal pedaling speed and once the set threshold of 70 rpm was reached, the resistance was applied automatically. During the test, verbal encouragement was provided continuously to encourage maximal effort and maintain a high pedaling rate. Power output was measured throughout the test by the number of revolutions athletes achieved on the ergometer from which lower-body relative peak power (PP), average power (AP), and minimum power (MP) were calculated. Fatigue index (FI) was also calculated from the percentage difference in peak and minimum power output
| [1] | Zupan MF, Arata AW, Dawson LH, et al. Wingate Anaerobic Test Peak Power and Anaerobic Capacity Classifications for Men and Women Intercollegiate Athletes. J Strength Cond Res. 2009, 23: 2598–2604.
https://doi.org/10.1519/jsc.0b013e3181b1b21b |
[1]
.
2.4. Statistical Analysis
Data analysis was initiated using data from 391 athletes. Fifteen athletes were identified as multivariate outliers based on Mahalanobis distances and were excluded from the analysis. The final sample comprised 376 athletes. Homogeneity of variance-covariance matrices was assessed using Box’s M test. When the assumption of homogeneity was violated, Pillai's Trace was used to interpret the multivariate effects, given its robustness to such violations
. A 2 (sex) × 3 (age group) × 3 (sport type) multivariate analysis of variance (MANOVA) was used to determine whether significant differences in the four dependent variables of the WAnT existed between athletes based on sex, age, and sport type, followed by univariate ANOVAs to examine each dependent variables. Where significant main effects were observed, Bonferroni-adjusted pairwise comparisons of the estimated marginal means were applied to identify specific group differences. All statistical tests were performed using SPSS version 27.0 for Windows (IBM Corp., NY, USA). Statistical significance was set at
p< 0.05, and partial eta squared (
ηp2) values were reported to indicate effect sizes.
3. Results
3.1. Comparison of Anaerobic Power Variables Across the Age Groups
In male athletes, late adolescents in power sports exhibited significantly greater PP (Δ=1.7 W/kg, p=0.004) than early adolescents, though no other sport-specific age differences reached significance (p > 0.05). Among females, late adolescents in mixed sports also showed higher PP (Δ=1.1W/kg, p=0.007) compared to their early adolescent counterparts. Additionally, FI was significantly higher in late adolescent females within power sports (Δ=7.2%, p=0.03) relative to the early adolescent group. No significant differences across age groups were observed for AP or MP in either sex.
3.2. Comparison of Anaerobic Power Variables Across the Sexes
Males of all the sport types showed significantly higher PP, AP, and MP than females across all developmental stages (
Table 3), except MP in the early adolescence stage of the power sports group. Whereas, fatigue index was significantly greater only in the middle adolescent males than females involved in power-sports, with trivial differences between sexes in other sport types.
3.3. Comparison of Anaerobic Power Across Sports
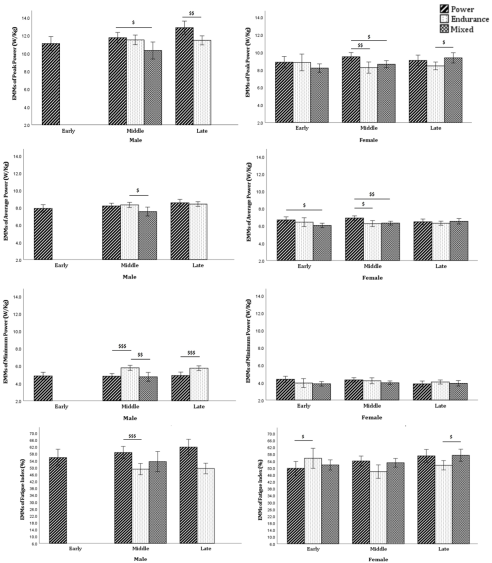
Significant sport-related differences were mainly evident in middle and late adolescents. Among males, power sport athletes demonstrated significantly higher PP outputs than mixed and endurance sport athletes in middle and late adolescent stages respectively (
Figure 2). In a similar pattern in females, power athletes showed higher PP than endurance and mixed sport athletes in middle adolescence, however, in late adolescence, mixed sport athletes exhibited greater PP than endurance sport athletes. Although AP in males was not significantly higher in power sport athletes than in the other sport types, females in middle and early adolescence showed significantly greater output in power athletes than in endurance and mixed sport athletes. In contrast, MP was greater in endurance athletes than in both power and mixed sport athletes among males, whereas no significant differences were seen in females. Surprisingly, power sport athletes showed the higher FI in both sexes, except in early adolescent females, where endurance athletes showed significantly higher FI values.
3.4. Effects of Sex, Age group, and Sport Type on Anaerobic Power Performance
Multivariate tests revealed significant individual effects of sex (Pillai’s Trace= 0.373, F(4,358)=53.14, p<0.001, ηp2=0.373), age group (Pillai’s Trace=0.053, F(8,718)=2.44, p=0.013, ηp2=0.027) and sport type (Pillai’s Trace=0.168, F(8,718)=8.25, p<0.001, ηp2=0.084) on the combined set of four anaerobic power variables. Significant two-way interaction effects were found between sex and age group (Pillai’s Trace=0.047, F(8,718)=2.1, p<0.028, ηp2=0.024), sex and sport type (Pillai’s Trace=0.161, F(8,718)=7.84, p<0.001, ηp2=0.080), and age group and sport type (Pillai’s Trace=0.089, F(16,1444)=2.05, p=0.008, ηp2=0.022). However, the three-way interaction between sex, age group, and sport type was not significant at the multivariate level (p=0.260).
3.5. Effects of Sex, Age group, and Sport Type on Each Anaerobic Power Variable
Univariate tests for between-subject effects were conducted to further examine the individual effects on each anaerobic power variable. Sex, age group and sport type, all of them had significant (
p<0.01) effects on PP (
Table 2). Sport types had significant effects on all four power variables along with the largest effect observed for FI (
ηp2=0.04). Age groups showed significant influence on FI, whereas sex didn’t have any effect. Follow-up univariate tests also showed that sex and sport type interaction was significant for only MP, and no other significant two-way interaction showed univariate significance (
p>0.05).
Table 2. Influence of sex, age group, and sport type on anaerobic power performance.
Variable | Sex | Age groups | Sport type |
Male (n=121) | Female (n=255) | F(1,361) (ηp2) | p- value | Early adolescent (n=76) | Middle adolescent (n=165) | Late adolescent (n=135) | F(2,361) (ηp2) | p- value | Power (n=129) | Endurance (n=131) | Mixed (n=116) | F(2, 361) (ηp2) | p- value |
PP (W/kg) | 11.5 ± 1.4 (11.3-11.8) | 8.7 ± 1.5 (8.5-8.9) | 155.0 (0.300) | <0.001 | 8.9 ± 1.6 (8.5-9.3) | 9.8 ± 1.9** (9.5-10.1) | 9.9 ± 2.1*** (9.5-10.2) | 4.8 (0.026) | 0.009 | 10.3 ± 2.0 (9.9-10.6) | 9.8 ± 1.9$$$ (9.4-10.1) | 8.7 ± 1.6$$$† (8.4-9.0) | 7.1 (0.038) | 0.001 |
AP (W/kg) | 8.2 ± 0.7 (8.1-8.3) | 6.4 ± 0.8 (6.3-6.5) | 211.8 (0.370) | <0.001 | 6.5 ± 0.9 (6.3-6.8) | 7.1 ± 1.1 (6.9-7.2) | 7.1 ± 1.2 (6.9-7.3) | 2.0 (0.011) | 0.133 | 7.3 ± 1.1 (7.1-7.5) | 7.2 ± 1.2$ (7.0-7.4) | 6.3 ± 0.8$$$††† (6.2-6.5) | 5.8 (0.031) | 0.003 |
MP (W/kg) | 5.2 ± 0.8 (5.1-5.4) | 4.0 ± 0.7 (3.9-4.1) | 83.1 (0.187) | <0.001 | 4.1 ± 0.7 (3.9-4.3) | 4.5 ± 0.9 (4.4-4.7) | 4.5 ± 1.0 (4.3-4.6) | 0.5 (0.003) | 0.590 | 4.4 ± 0.9 (4.3-4.6) | 4.8 ± 1.1 (4.6-5.0) | 3.9 ± 0.7$$††† (3.8-4.1) | 6.5 (0.035) | 0.002 |
FI (%) | 53.6 ± 8.6 (52.1-55.2) | 52.9 ± 9.7 (51.7-54.1) | 2.7 (0.008) | 0.096 | 52.3 ± 9.6 (50.1-54.5) | 52.7 ± 9.4 (51.3-54.2) | 54.0 ± 9.2‡ (52.5-55.6) | 3.5 (0.019) | 0.03 | 55.8 ± 9.3 (54.2-57.4) | 50.2 ± 8.2$$$ (48.7-51.6) | 53.5 ± 9.8 (51.7-55.3) | 7.4 (0.040) | 0.001 |
Data is presented as mean ± SD (95% CI). F is the Fisher’s test statistics with the number of degrees of freedom indicated in subscript. ηp2is the partial eta-squared representing the effect size. PP= Peak power; AP= Average power; MP= Minimum power; FI= Fatigue Index; **p<0.01,***p<0.001 compared to early adolescence. ‡ <0.05, compared to middle adolescents. $p<0.05, $$p<0.01, $$$p<0.001 compared to power athletes. † p<0.05, †††<0.001 compared to endurance athletes.
Table 3. Comparison of anaerobic power variables in males and females of different age groups and sport types.
Groups | Power sports | Endurance sports | Mixed sports |
Early adolescent | Middle adolescent | Late adolescent | Early adolescent | Middle adolescent | Late adolescent | Early adolescent | Middle adolescent | Late adolescent |
PP (W/kg) | Male | 11.0 ± 1.2 (10.3-11.8) | 11.7 ± 1.6 (11.0-12.4) | 12.8 ± 1.6** (11.9-13.7) | - | 11.5 ± 1.2 (11.0-11.9) | 11.4 ± 1.2 (10.9-11.9) | - | 10.3 ± 0.8 (9.6-10.9) | - |
Female | 8.8 ± 1.4### (8.1-9.5) | 9.4 ±1.3### (9.0-9.9) | 9.0 ± 1.6### (8.3-9.8) | 8.8 ± 1.3 (7.8-9.8) | 8.2 ±1.4### (7.5-8.9) | 8.4 ± 1.2### (8.0-8.8) | 8.1 ± 1.3 (7.7-8.6) | 8.6 ± 1.6## (8.1-9.1) | 9.3 ± 1.6** (8.6-10.0) |
AP (W/kg) | Male | 7.9 ± 0.3 (7.6-8.1) | 8.2 ± 0.8 (7.8-8.5) | 8.5 ± 0.8 (8.0-9.0) | - | 8.3 ± 0.5 (8.1-8.5) | 8.4 ± 0.5 (8.2-8.6) | - | 7.5 ± 0.2 (7.3-7.7) | - |
Female | 6.6 ± 0.8### (6.2-7.0) | 6.9 ± 0.8### (6.6-7.1) | 6.4 ± 0.9### (6.0-6.8) | 6.4 ± 0.9 (5.6-7.1) | 6.2 ± 0.8### (5.8-6.6) | 6.3 ±0.8### (6.0-6.5) | 6.0 ±0.7 (5.7-6.3) | 6.3 ± 0.8### (6.0-6.5) | 6.5 ± 0.8 (6.1-6.8) |
MP (W/kg) | Male | 4.8 ± 0.6 (4.4-5.2) | 4.8 ± 1.0 (4.3-5.2) | 4.9 ± 0.7 (4.5-5.2) | - | 5.7 ± 0.6 (5.5-6.0) | 5.7 ± 0.6 (5.4-5.9) | - | 4.7 ± 0.5 (4.2-5.2) | - |
Female | 4.3 ± 0.5 (4.0-4.6) | 4.3 ±0.9# (4.0-4.6) | 3.8 ± 0.9### (3.4-4.2) | 3.9 ± 0.9 (3.1-4.7) | 4.2 ± 0.5### (3.9-4.4) | 4.0 ± 0.8### (3.8-4.3) | 3.8 ± 0.7 (3.6-4.1) | 3.9 ± 0.6## (3.7-4.1) | 3.9 ± 0.8 (3.5-4.2) |
FI (%) | Male | 55.7 ± 7.0 (51.5-60.0) | 58.6 ± 8.2 (55.2-62.1) | 61.8 ± 3.8 (59.6-63.9) | - | 49.0 ± 8.2 (45.8-52.2) | 49.4 ± 6.8 (46.9-51.8) | - | 53.4 ± 8.3 (47.0-59.8) | - |
Female | 49.7 ± 8.6 (45.5-53.9) | 54.0 ± 10.1# (50.5-57.4) | 56.9 ± 10.2* (52.4-61.5) | 55.5 ± 8.8 (48.7-62.3) | 47.8 ± 9.2 (43.5-52.2) | 51.5 ± 8.3 (48.9-54.1) | 51.7 ± 10.8 (48.0-55.4) | 52.9 ± 8.8 (50.4-55.5) | 57.3 ± 10.0 (53.0-61.5) |
Data is presented as mean ± SD (95% CI). PP = Peak power; AP= Average power; MP= Minimum power; FI= Fatigue index; – No subject was found. * p<0.05, ** p<0.01, compared to early adolescence. #p<0.05, ##p<0.01,###p<0.001 compared to male athletes.
Figure 2. Peak Power (PP), Average Power (AP), Minimum Power (MP) and Fatigue Index (FI) of male and female athletes of different ages and sport types. EMMs: Estimated marginal means. $<0.05, $$<0.01, $$$<0.001.
4. Discussion
Research on physical fitness was initially centered upon evaluating cardiorespiratory endurance. Gradually, the importance of training induced differences in individual athletes’ neuromuscular adaptations, measured in terms of anaerobic power and anaerobic capacity, gained attention among coaches and athletes.
In this study, we classified lower-body anaerobic peak power and anaerobic capacity of Indian adolescent athletes involved in different sports and of different sex. A significant interactive influence of sex, chronological age, and sport type was also found on key anaerobic capacity parameters like PP, AP, MP and FI.
4.1. Sex Difference on Anaerobic Capacity
The greatest differences in physical performance are typically observed among sexes where tasks and events rely on muscle strength and power. While strength is largely dependent on the muscle cross sectional area, power is the product of force and contractile velocity, both of which are greater in the skeletal muscles of males than females
. Likewise, we found that male athletes generated on an average 32% higher PP, 28% higher AP and 30% higher MP than females, and these differences persisted within every sport category at every adolescent stage. Furthermore, this observed sex difference in Indian adolescents aligns with the existing literature, where males typically produce higher PP and AP than females
. For context, Brazilian prepubescent males and females recorded PP values of 8.0 and 7.2 W/kg, and AP values of 6.4 and 5.6 W/kg, respectively
. While those figures are lower than the values in the current study, NCAA Division I ice-hockey players exhibited considerably better performance; specifically, males reached PP and AP outputs of 15.2 and 12.9 W/kg, whereas females achieved 8.7 and 6.7 W/kg, respectively
. This sex divergence in anaerobic power output can be linked to how peak and average cycling power relate to the size of the type II muscle fiber area and glycolytic enzymatic capacity. Given that anaerobic performance is directly correlated with the distribution of type II fibers alongside PFK and LDH activity in both sexes, the typically larger and more glycolytic thigh musculature in males facilitates significantly higher PP, AP, and MP relative to body mass
| [19] | Esbjörnsson M, Sylvén C, Holm I, et al. Fast Twitch Fibres May Predict Anaerobic Performance in Both Females and Males. Int J Sports Med. 1993, 14: 257–263.
https://doi.org/10.1055/s-2007-1021174 |
[19]
. Even though this investigation incorporated participants of both sexes, future research can be carried out by including transgender athletes to account for their distinct hormonal profiles.
4.2. Anaerobic Capacity at Different Adolescent Stages
Previous discussion focused on the comparative power profiles across both sexes. However, the rate of development of muscle mass, strength and power also varies between the sexes throughout the various stages of adolescence. Similarly, one of the key findings of the present study was that across adolescent stages, both PP and MP were significantly greater in middle and late adolescents relative to the early adolescents, though these variables remained comparable between the two older groups. Besides, PP values observed in this Indian cohort are in line with international norms. For instance, Mekhdieva et al. (2020) reported 11.7, 11.7 and 12.2 W/kg in 14, 15 and 16 year old male athletes respectively, while our middle adolescent power sport males averaged 11.7 W/kg (
Table 3). For females, 14 and 15 years old had PP of 9.6 and 9.8 W/kg, against 8.8 to 9.4 W/kg in our age matched power-sport females which is slightly lower
| [20] | Mekhdieva K, Zakharova A, Vladelshchikova M, et al. Age Dynamics of Wingate Test Parameters in Young Athletes. Hum Sport Med. 2020, 20: 97–103.
https://doi.org/10.14529/hsm200311 |
[20]
. This indicates that, in trained Indian adolescent athletes, the anaerobic power output is comparable with eastern European adolescents. The small but significantly higher FI in late adolescents than middle and early adolescents found in our study may be supported by the findings of Beneke et al. (2005) who documented that peak blood lactate concentration after the test bout was significantly lower in 12 year old boys than 16 year olds and adults, indicating that older adolescents both generate and tolerate more fatigue during the 30s task
| [21] | Beneke R, Hütler M, Jung M, et al. Modeling the blood lactate kinetics at maximal short-term exercise conditions in children, adolescents, and adults. J Appl Physiol. 2005, 99: 499–504. https://doi.org/10.1152/japplphysiol.00062.2005 |
[21]
. Although chronological age has been considered in this study, future studies may incorporate measurements of biological maturity or biomarkers related to maturation of athletes to better understand the age related changes.
4.3. Anaerobic Capacity in Different Sports
While muscular strength and power are significant for activities that are power dominant such as during jerks in weightlifting or block start during a 100m sprint as well as other sports, endurance is also an important performance marker as many sports require the repetition of high-intensity efforts. Consequently, assessing anaerobic power is essential for both maintaining and enhancing performance in diverse athletic contexts. In this study, comparing the results of the power test between different types of sports, highest PP and AP were observed in power sports athletes, while endurance athletes had intermediate PP and AP outputs but had the highest MP with lowest FI. This is due to the well known fact that different types of sports training leads to the development of different patterns of anaerobic capacity. Strength training and power development training causes significant anaerobic energy production followed by increased peak anaerobic power. This is in accordance with another study on male Serbian wrestlers who recorded the highest power output (10.0 W/kg) exceeding both rowers and soccer players
. Likewise, collegiate hurdlers and short-distance sprinters from the United States attained superior PP (range: 9.62–9.78 W/kg) and AP (range: 7.67–7.75 W/kg) values compared to their long-distance endurance counterparts, who recorded lower PP (range: 8.17–8.92 W/kg) and AP (range: 6.74–7.18 W/kg) outputs
| [22] | Johnson MJ, Albrechtsen SJ. Anaerobic Power Profiles In Track And Field: 2335 Board #223, The University of Wisconsin-Whitewater, 11th August 2008. |
[22]
. In comparison with these US collegiate track athletes and elite Serbian wrestlers, the adolescent cohort in the present study demonstrated comparable, and in some instances marginally higher, outcomes for both PP and AP.
A more detailed, group-specific findings provides further clarity regarding these anaerobic power outputs. In our cohort, late-adolescent males specialized in power-sports achieved a PP of 12.8 W/kg, an AP of 8.5 W/kg, and a FI of 61.8%. These outputs align closely with the performance observed in NCAA Division IA male power athletes (12.9 W/kg). However, AP was lower compared to their collegiate counterparts (9.3 W/kg) and also a higher fatigue index than the 49.1% reported in the NCAA group was recorded
| [23] | Coppin E, Heath EM, Bressel E, et al. Wingate Anaerobic Test Reference Values for Male Power Athletes. Int J Sports Physiol Perform. 2012, 7: 232–236.
https://doi.org/10.1123/ijspp.7.3.232 |
[23]
.
4.4. Influence of Sex and Sport Type on Anaerobic Capacity
A notable finding in the present study was the significant interaction among sex and sport types for MP only. This indicates that the effect of different types of sport on the ability to sustain power output differed between males and females. While, male endurance athletes exhibited higher MP than male power and mixed-sport athletes, these sport-specific differences were comparatively lower among female athletes. This finding highlights that power endurance was better among male endurance athletes. Moreover, this aligns with the lower FI observed in this group, indicating that endurance athletes maintained power output more effectively during the 30-second test.
5. Limitations
While the sample size and inclusion of various sports disciplines were significant strengths of the present study, few limitations must be acknowledged. First, this study being a cross-sectional comparative study, causality can not be established. Secondly, biological maturity (Tanner staging or maturity offset) was not accounted for beyond the chronological age, given that maturity contributes to the development of anaerobic performance independent of chronological age. Therefore, future studies should incorporate direct maturity indicators. Third, although the sport-type categories were physiologically motivated, intra-category heterogeneity may mask more nuanced detailed sport specific patterns.
6. Practical Implications
From a practical point of view, the findings of this study may give coaches, sport scientists and talent identification programmes a first set of stratified lower-body anaerobic power benchmarks for Indian adolescent athletes. Second, the high FI in power-sport athletes despite high PP suggests that targeted fatigue tolerance training could meaningfully improve their ability to sustain peak power output.
7. Conclusion
In summary, this study provides one of the first comprehensive profiles of lower-body anaerobic power in Indian adolescent athletes stratified across sexes, age groups and sport types. Sex emerged as the strongest determinant of anaerobic performance, with males dominating females in peak, average and minimum power. Anaerobic power also improved from early to middle adolescence, with relatively smaller changes thereafter, while fatigue index showed only modest age-related differences. Sport-specific differences were evident, with power-sport athletes exhibiting the highest peak and average power, endurance athletes mostly demonstrating superior minimum power and lower fatigue index compared to power and mixed-sport athletes. Significant interactions among sex, age, and sport type further indicate that these factors should be considered collectively when evaluating adolescent athletes. Overall, the findings may assist coaches, sport scientists, and talent identification programs in interpreting anaerobic performance and developing age-, sex-, and sport-specific training strategies.
8. Recommendations
Future research should examine lower-body anaerobic power development using a longitudinal study design to better understand the changes across the adolescence and can establish developmental patterns. Studies incorporating measurements of biological maturity is recommended for adolescent population in order to differentiate the effects of chronological age from maturity status. Further, researches with larger samples and single sport specific analyses can be considered to better understand the differences in anaerobic power.
Abbreviations
PP | Peak Power |
AP | Average Power |
MP | Minimum Power |
FI | Fatigue Index |
WAnT | Wingate Anaerobic Test |
RAST | Running-Based Anaerobic Sprint Test |
MANOVA | Multivariate Analysis of Variance |
SD | Standard Deviation |
CI | Confidence Interval |
EMMs | Estimated Marginal Means |
ηp2 | Partial Eta Squared |
Acknowledgments
We would like to thank Swami Vidyapradananda, Head of the Department of Sports Science and Yoga for his constant support and guidance, the athletes those who have participated, and the support staff from Kalinga Stadium sports complex for helping in the data collection process.
Author Contributions
Rangan Pan: Conceptualization, Formal Analysis, Investigation, Methodology, Visualization, Writing – original draft
Sudeep Satpathy: Investigation, Project administration, Writing – review & editing
Swapan Kumar Dey: Investigation, Methodology, Supervision, Writing – review & editing
Arnab Das: Conceptualization, Methodology, Supervision, Validation, Visualization, Writing – review & editing
Conflicts of Interest
The authors declare no conflicts of interest.
References
| [1] |
Zupan MF, Arata AW, Dawson LH, et al. Wingate Anaerobic Test Peak Power and Anaerobic Capacity Classifications for Men and Women Intercollegiate Athletes. J Strength Cond Res. 2009, 23: 2598–2604.
https://doi.org/10.1519/jsc.0b013e3181b1b21b
|
| [2] |
Nikolaidis PT, Matos B, Clemente FM, et al. Normative data of the wingate anaerobic test in 1 year age groups of male soccer players. Front Physiol. 2018, 9: 1619.
https://doi.org/10.3389/fphys.2018.01619
|
| [3] |
Kasabalis A, Douda H, Tokmakidis SP. Relationship between Anaerobic Power and Jumping of Selected Male Volleyball Players of Different Ages. Percept Mot Skills. 2005, 100: 607–614.
https://doi.org/10.2466/pms.100.3.607-614
|
| [4] |
Meckel Y, Machnai O, Eliakim A. Relationship Among Repeated Sprint Tests, Aerobic Fitness, and Anaerobic Fitness in Elite Adolescent Soccer Players. J Strength Cond Res. 2009, 23: 163–169.
https://doi.org/10.1519/jsc.0b013e31818b9651
|
| [5] |
Campos WD, Da Cruz Brum VP, Machado HS, et al. Anaerobic Power of Prepubescent Boys and Girls During Wingate Test: 1733 Board #86 May 29 9:00 AM - 10:30 AM. Med Sci Sports Exerc. 2008, 40: S287.
https://doi.org/10.1249/01.mss.0000323161.03235.83
|
| [6] |
Legaz-Arrese A, Munguía-Izquierdo D, Carranza-García LE, et al. Validity of the Wingate anaerobic test for the evaluation of elite runners. J Strength Cond Res. 2011, 25: 819–824.
https://doi.org/10.1519/jsc.0b013e3181c1fa71
|
| [7] |
Maciejewski H, Rahmani A, Chorin F, et al. The 1,500-m Rowing Performance is Highly Dependent on Modified Wingate Anaerobic Test Performance in National-Level Adolescent Rowers. Pediatr Exerc Sci. 2016, 28: 572–579.
https://doi.org/10.1123/pes.2015-0283
|
| [8] |
Jakovljević DK, Eric M, Jovanovic G, et al. Explosive muscle power assessment in elite athletes using wingate anaerobic test. Rev Bras Med Esporte. 2018, 24: 107–111.
https://doi.org/10.1590/1517-869220182402183151
|
| [9] |
Leiter JR, Cordingley DM, MacDonald PB. Development of Anaerobic Fitness in Top-Level Competitive Youth Ice Hockey Players. J Strength Cond Res. 2018, 32: 2612–2615.
https://doi.org/10.1519/jsc.0000000000002403
|
| [10] |
Chatterjee S, Chakraborty S, Chatterjee S. Validity and Reliability Study of The Running-Based Anaerobic Sprint Test for Evaluating Anaerobic Power Performance as Compared to Wingate Test in Indian Male Track and Field Sprinters. Eur J Phys Educ Sport Sci. 2022, 8.
http://dx.doi.org/10.46827/ejpe.v8i4.4327
|
| [11] |
Krishnan A, Sharma D, Bhatt M, et al. Comparison between Standing Broad Jump test and Wingate test for assessing lower limb anaerobic power in elite sportsmen. Med J Armed Forces India. 2017, 73: 140–145.
https://doi.org/10.1016/j.mjafi.2016.11.003
|
| [12] |
Singh R, Kumar A, Apte V, et al. Wingate anaerobic test reference value for lower limb of elite Indian men wrestlers. Natl J Physiol Pharm Pharmacol 2020; 1.
https://doi.org/10.5455/njppp.2021.11.09260202009102020
|
| [13] |
Ghosh R, Sinha S, Adhikari S. Anthropometrical and Physiological characteristics of Indian National Artistic Gymnasts: A Gender-Based Perspective. Int J Kinanthropometry. 2025, 5: 132–139.
https://doi.org/10.34256/ijk25113
|
| [14] |
Hardin AP, Hackell JM, COMMITTEE ON PRACTICE AND AMBULATORY MEDICINE, et al. Age Limit of Pediatrics. Pediatrics. 2017, 140: e20172151.
https://doi.org/10.1542/peds.2017-2151
|
| [15] |
Pelliccia A, Sharma S, Gati S, et al. 2020 ESC Guidelines on sports cardiology and exercise in patients with cardiovascular disease. Eur Heart J. 2021, 42: 17–96.
https://doi.org/10.1093/eurheartj/ehaa605
|
| [16] |
Olson CL. Comparative Robustness of Six Tests in Multivariate Analysis of Variance. J Am Stat Assoc. 1974, 69: 894–908.
https://doi.org/10.1080/01621459.1974.10480224
|
| [17] |
Hunter SK, Senefeld JW. Sex differences in human performance. J Physiol. 2024, 602: 4129–4156.
https://doi.org/10.1113/jp284198
|
| [18] |
Mellick PF, Marrier D, Vallario N, et al. Gender Differences in Anaerobic and Aerobic Responses to a Full Season of NCAA Division 1 Ice Hockey. Open Sports Sci J. 2025, 18: e1875399X401142.
http://dx.doi.org/10.2174/011875399X401142251112064317
|
| [19] |
Esbjörnsson M, Sylvén C, Holm I, et al. Fast Twitch Fibres May Predict Anaerobic Performance in Both Females and Males. Int J Sports Med. 1993, 14: 257–263.
https://doi.org/10.1055/s-2007-1021174
|
| [20] |
Mekhdieva K, Zakharova A, Vladelshchikova M, et al. Age Dynamics of Wingate Test Parameters in Young Athletes. Hum Sport Med. 2020, 20: 97–103.
https://doi.org/10.14529/hsm200311
|
| [21] |
Beneke R, Hütler M, Jung M, et al. Modeling the blood lactate kinetics at maximal short-term exercise conditions in children, adolescents, and adults. J Appl Physiol. 2005, 99: 499–504.
https://doi.org/10.1152/japplphysiol.00062.2005
|
| [22] |
Johnson MJ, Albrechtsen SJ. Anaerobic Power Profiles In Track And Field: 2335 Board #223, The University of Wisconsin-Whitewater, 11th August 2008.
|
| [23] |
Coppin E, Heath EM, Bressel E, et al. Wingate Anaerobic Test Reference Values for Male Power Athletes. Int J Sports Physiol Perform. 2012, 7: 232–236.
https://doi.org/10.1123/ijspp.7.3.232
|
Cite This Article
-
APA Style
Pan, R., Satpathy, S., Dey, S. K., Das, A. (2026). Lower-body Wingate Anaerobic Performance of Indian Adolescent Athletes Across Sport Categories:
A Cross-sectional Study. International Journal of Sports Science and Physical Education, 11(3), 45-54. https://doi.org/10.11648/j.ijsspe.20261103.11
 Copy
|
Copy
|
 Download
ACS Style
Pan, R.; Satpathy, S.; Dey, S. K.; Das, A. Lower-body Wingate Anaerobic Performance of Indian Adolescent Athletes Across Sport Categories:
A Cross-sectional Study. Int. J. Sports Sci. Phys. Educ. 2026, 11(3), 45-54. doi: 10.11648/j.ijsspe.20261103.11
Copy
|
Download
AMA Style
Pan R, Satpathy S, Dey SK, Das A. Lower-body Wingate Anaerobic Performance of Indian Adolescent Athletes Across Sport Categories:
A Cross-sectional Study. Int J Sports Sci Phys Educ. 2026;11(3):45-54. doi: 10.11648/j.ijsspe.20261103.11
Copy
|
Download
-
@article{10.11648/j.ijsspe.20261103.11,
  author = {Rangan Pan and Sudeep Satpathy and Swapan Kumar Dey and Arnab Das},
  title = {Lower-body Wingate Anaerobic Performance of Indian Adolescent Athletes Across Sport Categories:
A Cross-sectional Study},
  journal = {International Journal of Sports Science and Physical Education},
  volume = {11},
  number = {3},
  pages = {45-54},
  doi = {10.11648/j.ijsspe.20261103.11},
  url = {https://doi.org/10.11648/j.ijsspe.20261103.11},
  eprint = {https://article.sciencepublishinggroup.com/pdf/10.11648.j.ijsspe.20261103.11},
  abstract = {Optimum lower-body anaerobic power is critical for athletic performances, yet there is limited information of the power profile of Indian adolescent athletes across various sports, age and sexes. This study aims to develop a power profile for this demographic and also examine the effects of sex, chronological age and sport type on anaerobic power. The study included 391 Indian adolescent athletes divided into different groups based on sex, age group, and sport type. Participants completed a 30-second Wingate anaerobic power test on a peak bike and the relative peak (PP), average (AP) and minimum power (MP) along with fatigue index (FI) were measured. A three-way MANOVA (sports-age -sex) was used to find power differences between the groups. Male athletes of all developmental stages and sport types showed significantly higher PP, AP, and MP than females. Middle and late adolescents athletes had higher power output than the early adolescents. Athletes involved in power sports achieved the highest PP and AP, whereas endurance athletes had greater MP and lowest FI. MANOVA revealed significant effects of sex (pηp2=0.373), age group (p=0.013, ηp2=0.027) and sport type (pηp2=0.084) on all anaerobic power variables, but none had three-way interaction effect. Two way interaction of sex and sport type was found only for MP (pηp2=0.080). These anaerobic power profiling and regular assessment can help coaches and sport science professionals to identify talents, monitor performance progress, and develop age-, sex-, and sport-specific training strategies accordingly.},
 year = {2026}
}
Copy
|
Download
-
TY  - JOUR
T1  - Lower-body Wingate Anaerobic Performance of Indian Adolescent Athletes Across Sport Categories:
A Cross-sectional Study
AU  - Rangan Pan
AU  - Sudeep Satpathy
AU  - Swapan Kumar Dey
AU  - Arnab Das
Y1  - 2026/09/09
PY  - 2026
N1  - https://doi.org/10.11648/j.ijsspe.20261103.11
DO  - 10.11648/j.ijsspe.20261103.11
T2  - International Journal of Sports Science and Physical Education
JF  - International Journal of Sports Science and Physical Education
JO  - International Journal of Sports Science and Physical Education
SP  - 45
EP  - 54
PB  - Science Publishing Group
SN  - 2575-1611
UR  - https://doi.org/10.11648/j.ijsspe.20261103.11
AB  - Optimum lower-body anaerobic power is critical for athletic performances, yet there is limited information of the power profile of Indian adolescent athletes across various sports, age and sexes. This study aims to develop a power profile for this demographic and also examine the effects of sex, chronological age and sport type on anaerobic power. The study included 391 Indian adolescent athletes divided into different groups based on sex, age group, and sport type. Participants completed a 30-second Wingate anaerobic power test on a peak bike and the relative peak (PP), average (AP) and minimum power (MP) along with fatigue index (FI) were measured. A three-way MANOVA (sports-age -sex) was used to find power differences between the groups. Male athletes of all developmental stages and sport types showed significantly higher PP, AP, and MP than females. Middle and late adolescents athletes had higher power output than the early adolescents. Athletes involved in power sports achieved the highest PP and AP, whereas endurance athletes had greater MP and lowest FI. MANOVA revealed significant effects of sex (pηp2=0.373), age group (p=0.013, ηp2=0.027) and sport type (pηp2=0.084) on all anaerobic power variables, but none had three-way interaction effect. Two way interaction of sex and sport type was found only for MP (pηp2=0.080). These anaerobic power profiling and regular assessment can help coaches and sport science professionals to identify talents, monitor performance progress, and develop age-, sex-, and sport-specific training strategies accordingly.
VL  - 11
IS  - 3
ER  -
Copy
|
Download





 Share This Article
 Twitter
 Linked In
 Facebook