Research Article | | Peer-Reviewed

A Unified Low-Cost Embedded IoT Framework for Concurrent Physiological and Ambient Air-Quality Monitoring in Patient-Centred Care

Received: 8 July 2026     Accepted: 23 July 2026     Published: 10 August 2026
Views:       Downloads:
Abstract

Continuous tracking of a patient's vital signs is now routine, but the air the patient actually breathes is seldom measured by the same inexpensive device, even though air quality is a modifiable factor that affects cardiorespiratory health. Because embedded health monitors and air-quality monitors are usually built as separate products, a caregiver must install, power, and reconcile two devices, and the vital-sign readings arrive without any picture of the environment that produced them. To close this gap, we describe a single low-cost embedded platform that combines a physiological subsystem (a pulse sensor and an LM35 temperature sensor) with an environmental subsystem based on an MQ-135 gas sensor. Both share one Arduino Uno (ATmega328P) edge node, and an ESP32 Wi-Fi gateway relays the readings to the ThingSpeak cloud. A 10-bit ADC digitises every channel; the firmware converts the counts into clinical and air-quality indices, checks them against calibrated thresholds, and reports the outcome through a 16×2 I2C LCD, a graduated LED and PWM-buzzer alert stage, and a USART log. Each subsystem was built in hardware and checked against a Proteus simulation. In testing, the physiological subsystem separated normal, tachycardic, and febrile states cleanly (pulse 72-120 bpm; temperature 98.2-101.2°F), and the environmental subsystem classified all four severity levels correctly across five controlled gas trials, with an 8-12 s response time and full simulation-hardware agreement. The assembled prototype costs roughly BDT 1,347 (≈ USD 12.3). Three contributions follow: a single-node architecture serving both domains, a shared threshold-classification and multi-modal alerting scheme that works across them, and a cost model grounded in the actual build. Placing patient vitals and ambient air quality on one affordable node lets the device raise context-aware alerts—such as calling for ventilation when pollutant levels climb near a vulnerable patient—which makes it a practical fit for homes, clinics, and resource-limited settings.

Published in Internet of Things and Cloud Computing (Volume 14, Issue 2)
DOI 10.11648/j.iotcc.20261402.11
Page(s) 26-37
Creative Commons

This is an Open Access article, distributed under the terms of the Creative Commons Attribution 4.0 International License (http://creativecommons.org/licenses/by/4.0/), which permits unrestricted use, distribution and reproduction in any medium or format, provided the original work is properly cited.

Copyright

Copyright © The Author(s), 2026. Published by Science Publishing Group

Keywords

Internet of Things, Patient Health Monitoring, Air-Quality Monitoring, Arduino Uno, Embedded Systems, Edge Computing

1. Introduction
For a long time, watching a person's health closely meant relying on large, costly equipment tied to a hospital. That picture has changed with the Internet of Things (IoT): small, low-priced devices now capture physiological signals wherever the patient happens to be and forward them to caregivers at a distance . In parallel, cheap metal-oxide sensors have made it practical to flag ambient hazards such as combustion gases and airborne particulates . The two lines of work, however, have grown up mostly apart.
That separation is more than an inconvenience. Air quality is not simply an environmental issue; it acts directly on the same vital signs a health monitor tries to record, and it can be changed. Reviews that pool many studies tie particulate matter, nitrogen dioxide, and carbon monoxide to higher cardiovascular and respiratory morbidity , and the effect is sharpest in older adults and in people with COPD or cardiac disease —exactly the people most likely to be monitored at home. A monitor that follows pulse and temperature but knows nothing about the pollutants in the same room is therefore seeing only one side of a linked system.
Take an older or recovering patient being cared for at home. An ordinary health node might show a raised pulse, but it cannot say whether the body is deteriorating or whether something in the room—cooking smoke, a build-up of carbon dioxide, or solvent fumes—has briefly pushed the reading up. An air-quality monitor on its own has the opposite blind spot: it alarms without knowing whether anyone vulnerable is nearby or how that person is reacting. Running the two as separate boxes roughly doubles the cost, the power draw, the calibration effort, and the caregiver's workload, and still leaves the two data streams uncorrelated. Here we fold both jobs into one inexpensive edge node, so the physiological and environmental states are read, classified, and alerted on side by side.
Across a representative set of low-cost systems, the same gap keeps appearing. Health monitors built on Arduino and ESP-class boards deal only with vital signs and cloud upload , whereas air-quality builds using MQ-series sensors deal only with gas classification and alerting . Surveys of IoT healthcare say much the same: bringing environmental context into patient monitoring is still rarely attempted . We could not find a widely reported single-microcontroller design that reads vitals, reads ambient gas concentration, runs threshold classification for both on the device itself, and then issues alerts both locally and to the cloud. That is the gap this paper sets out to fill.
The goals of this study are to build one embedded architecture on a single Arduino Uno edge node that carries both a physiological and an environmental sensing subsystem, to work out the signal-conversion and classification logic each domain needs, to test both subsystems in hardware and against simulation, and to quantify the cost and performance of the combined design. Its main contributions are:
1) A single-node, dual-domain architecture that carries physiological monitoring (pulse rate and body temperature) alongside environmental monitoring (multi-gas air quality) on one ATmega328P edge node backed by an ESP32 cloud gateway.
2) A shared classification-and-alerting methodology that turns each domain into a readable index, tests it against calibrated thresholds, and reports it through one shared output stage—an I2C LCD, an LED, and a graduated PWM buzzer—with USART logging and ThingSpeak telemetry.
3) A context-aware alerting concept in which a rising pollutant level near a monitored patient can trigger environmental remediation such as ventilation, joining the two subsystems by function rather than simply co-locating them.
4) An experimentally grounded evaluation and cost model reporting 100% accuracy across the four air-quality levels, an 8-12 s response time, complete simulation-hardware agreement, and a total prototype cost near BDT 1,347 (≈ USD 12.3).
2. Related Work
Three bodies of work bear on this study: low-cost IoT systems for patient monitoring, embedded systems for air-quality monitoring, and the epidemiological evidence that ties air quality to cardiorespiratory health. We look at each and then position our design.
2.1. Low-Cost IoT Patient Monitoring
The first Arduino-based health monitors set the pattern later designs still follow: read the sensors, show the values on a local LCD, and push them to the cloud. Lohar et al. read physiological parameters on an Arduino Uno and sent them to a cloud service, and Mihat et al. extended this with continuous monitoring and real-time alerts. Malathi and Preethi and Birajadar et al. added more sensors and better dashboards, and comparable low-cost Arduino/Android health nodes have reported reliable multi-parameter monitoring of temperature, heart rate, and SpO2 . Useful as they are, these designs share two shortcomings: they treat the patient as an isolated source of signals, and they fire alerts only on physiological thresholds. Newer work leans toward edge intelligence and security: Pathinarupothi et al. built a risk-stratified smart edge that sends severity-graded alerts to clinicians, and recent resource-efficient IoT frameworks report strong monitoring accuracy while cutting bandwidth and energy use . Broad surveys of the Internet of Medical Things (IoMT) stress real-time monitoring, energy efficiency, and, increasingly, the security and privacy of the device-edge-cloud chain . Related assistive IoMT designs even fold navigation aids and vital-sign tracking into one wearable node . What none of them do is treat the surrounding air as a variable worth monitoring.
2.2. Embedded Air-Quality Monitoring
For indoor air quality, the MQ-135 metal-oxide sensor has become the standard low-cost pick. Manna et al. assembled an IoT multi-sensor node using MQ-series sensors and a NodeMCU gateway, classifying air quality directly from ADC thresholds—an approach that feeds straight into the present design. Rahman and Islam showed that an I2C-driven 16×2 LCD gives workable feedback even when GPIO is scarce, and Singh et al. proposed a graduated, multi-level alarm that pairs a buzzer with GSM alerting. Hasan et al. measured MQ-series sensors against calibrated references and found that, although the MQ-135 response curve is non-linear, fixed thresholds still give dependable qualitative classification. Karim and Ahmed ran hazardous-gas detection on the ATmega328P with USART logging and PWM tone output—essentially the firmware structure we adopt. Broader low-cost efforts add automatic ventilation actuation on gas detection and multi-parameter environmental dashboards spanning gas, dust, sound, and temperature . Throughout this literature the patient never appears: the systems spot hazards but have no sense of how a person is responding.
2.3. Air Quality as a Determinant of Cardiorespiratory Health
There is solid clinical ground for bringing the two domains together. A mapping review of systematic reviews traces low birth weight, acute lower-respiratory infections, COPD, and cardiovascular disease to indoor and outdoor air pollution . A 2024 systematic review of older adults connects carbon monoxide, particulate matter, and nitrogen dioxide to worse cardiovascular outcomes by way of inflammation, oxidative stress, and autonomic imbalance , while an umbrella review names cardiac patients and the elderly as the most vulnerable groups . Two findings matter especially for a monitoring device: indoor particulate exposure lowers heart-rate variability in COPD patients , and randomised air-filtration trials in elderly homes improved microvascular function . In other words, acting on air quality produces a measurable physiological gain. Watching air quality next to vitals is therefore not a side feature but something the mechanism itself justifies.
2.4. Positioning of the Proposed Work
Table 1 lines up representative studies against the capabilities a unified patient-and-environment monitor would need. Earlier systems fall into either the physiological or the environmental column; the proposed design fills both, without giving up the low cost and low power that make embedded solutions worth using.
Table 1. Critical comparison of representative low-cost monitoring systems.

Ref.

Study / focus

Platform

Vitals

Air qual.

Alerting / cloud

IoT patient monitoring

Arduino / ESP

Yes

No

LCD + cloud

Edge-intelligent health

Edge / AI

Yes

No

Severity alerts

Multi-sensor air node

NodeMCU / Arduino

No

Yes

Cloud dashboard

Graduated gas alarm

Arduino + GSM

No

Yes

Buzzer + GSM

Hazardous-gas detector

ATmega328P

No

Yes

Buzzer + USART

This work

Unified dual-domain node

Arduino + ESP32

Yes

Yes

LCD + buzzer + cloud

Of all the entries, only the proposed framework covers the physiological and environmental columns at once on a single low-cost edge node.
3. Unified System Methodology and Design
3.1. System Architecture
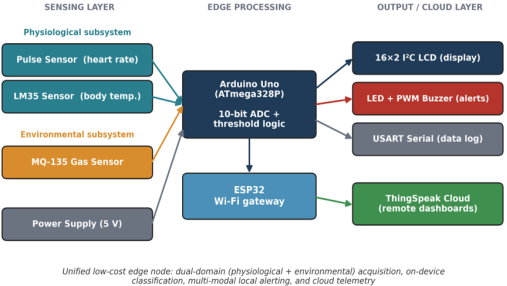
As Figure 1 shows, the framework is arranged in three layers. The sensing layer holds the two subsystems—a physiological one (pulse sensor and LM35) and an environmental one (MQ-135)—along with a regulated 5 V supply. The edge-processing layer is an Arduino Uno based on the ATmega328P microcontroller . Within a 500 ms polling loop it samples every sensor through its 10-bit analog-to-digital converter (ADC), turns the raw counts into domain indices, and checks each index against its thresholds. An ESP32 module serves as the Wi-Fi gateway. The output/cloud layer handles the results: a 16×2 I2C LCD for local display, an LED and PWM buzzer for graduated alerts, a USART link for diagnostic logging, and the ThingSpeak cloud for remote dashboards.
Figure 1. Layered architecture of the unified monitoring framework. Both subsystems share a single ATmega328P edge node, a common multi-modal output stage, and an ESP32 cloud gateway.
3.2. Operational Workflow
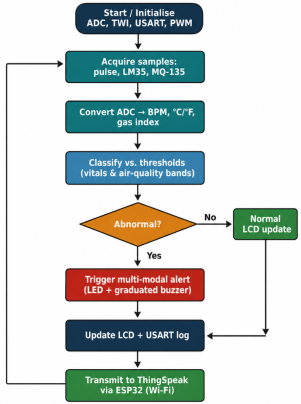
The firmware runs the cyclic routine of Figure 2. Every 500 ms cycle, the node reads all three sensor channels, converts each raw ADC value into its physical index, and classifies the outcome. If any index is out of range, it fires the multi-modal alert stage, then updates the LCD, writes a USART log entry, and sends the data to the cloud through the ESP32. Keeping both domains inside one deterministic loop means the physiological and environmental samples always line up in time—the timing alignment that the context-aware alerting of Section 3.7 depends on.
Figure 2. Firmware operational flowchart for the 500 ms sensing, classification, alert, and data transmission cycle.
3.3. Signal Acquisition and Conversion
The ATmega328P's 10-bit ADC digitises every analog channel against a reference voltage Vᵣₑᶠ = 5 V, yielding an integer N between 0 and 1023. The corresponding input voltage is recovered from.
V_in = (N / 1023) × V_ref(1)
Because the LM35 is linear, with a scale factor of 10 mV/°C , the body temperature in degrees Celsius comes straight from that recovered voltage:
T_C = (V_in × 1000) / 10 = (N × V_ref × 100) / 1023(2)
For clinical readability the value is then reported in Fahrenheit:
T_F = (9/5) T_C + 32(3)
Heart rate comes from the pulse sensor, which times the inter-beat interval (IBI), the gap in milliseconds between successive systolic peaks that rise above an adaptive amplitude threshold:
BPM = 60000 / IBI(4)
3.4. Air-Quality Index and Sensor Model
Inside the MQ-135 is a tin-dioxide (SnO2) sensing element whose resistance drops as reducing gases such as NH3, CO2, benzene, or smoke grow more concentrated, pushing the analog output voltage up . Its resistance Rₛ is found from the load resistor Rₗ and the supply voltage Vᴄ:
R_s = (V_c / V_out − 1) × R_L(5)
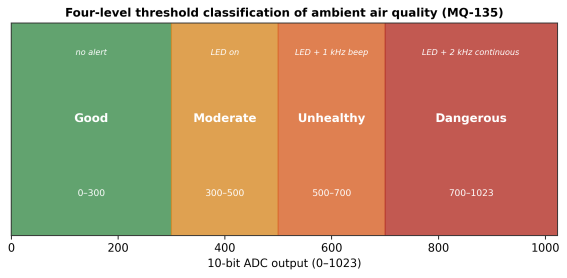
Since the MQ-135 responds non-linearly and the aim here is qualitative classification rather than an exact parts-per-million figure, the design uses the raw ADC count N directly as a relative air-quality index and sorts it into four severity levels with the piecewise rule.
Q(N): Good <300; Mod. 300-499; Unhealthy 500-699; Danger ≥700(6)
We set these boundaries from clean-air baseline readings together with controlled gas exposures, along the lines of the fixed-threshold method that Hasan et al. and Manna et al. validated. Figure 3 shows the mapping.
Figure 3. Four-level threshold classification of the MQ-135 air-quality index over the full 10-bit ADC range, with the associated multi-modal alert action for each band.
3.5. Alert Generation
The output stage is multi-modal on purpose, so an alert can be noticed without anyone looking at a screen. The LED is driven as a plain digital output, and a series resistor holds its forward current below the ATmega328P's 40 mA per-pin limit :
I_LED = (V_s − V_f)/R = (5− 2)/180 ≈ 16.7 mA(7)
A timer-generated PWM square wave drives the active buzzer, and its fundamental frequency carries the severity: 1 kHz pulsed at the Unhealthy level, 2 kHz continuous at the Dangerous level. With the timer in fast-PWM mode using prescaler M and comparing value C, the output frequency is
f_out = f_clk / [M (1+ C)](8)
This graduated, frequency-coded scheme mirrors the multi-level alarm hierarchy that Singh et al. found effective at signalling urgency, and echoes the paired vibration-and-buzzer feedback used in assistive alerting devices .
3.6. Communication Protocols
The node combines three on-board protocols with one wireless link. Its 16×2 LCD runs on the hardware TWI/I2C bus (SDA = A4, SCL = A5) via a PCF8574 expander at address 0x27, which cuts the display wiring from six GPIO lines to two and frees pins for the alert stage . The USART starts up at 9600 baud, 8N1, and sends each cycle's raw values to a host PC for logging with no extra hardware . The PWM peripheral drives the buzzer, as above. Last, the ESP32 gives the Wi-Fi uplink to ThingSpeak and places the physiological and environmental fields on one cloud dashboard for remote caregivers. Bringing four communication mechanisms onto a single node, across two sensing domains, sets the design apart; the prior systems we surveyed use only some of them.
3.7. Context-Aware Coupling of the Two Domains
What makes the framework new in function is that it couples the two domains instead of just putting them in the same box. Since both indices are computed in the same loop, the firmware can raise a combined condition: if the air-quality index reaches the Unhealthy or Dangerous band while a patient is being monitored, the node steps up the alert and can also drive a remediation output—for instance switching on a ventilation fan or an air purifier, as in automatic-ventilation designs . That turns the clinical finding that cleaner indoor air helps vulnerable patients into an action, changing a passive monitor into a device that can act on the patient's behalf.
3.8. Hardware Implementation
We built the whole circuit on an 830-tie breadboard, powered over USB at 5 V. Table 2 gives the pin assignment for the combined node, where the physiological and environmental channels share the one Arduino Uno.
Table 2. Pin assignment for the integrated edge node.

Component / signal

Arduino pin

Function

Pulse sensor (analog)

A1

ADC - heart-rate signal

LM35 output

A2

ADC - body temperature

MQ-135 AOUT

A0

ADC - gas concentration

I2C SDA / SCL

A4 / A5

TWI bus to LCD

LED anode

D8

Digital alert output

Buzzer (+)

D9

PWM alert output

ESP32 link (TX/RX)

D2 / D3

Serial bridge to Wi-Fi gateway

Sensors / LCD VCC

5 V

Power

The three sensors share the ATmega328P ADC channels A0-A2, leaving the TWI, PWM, and serial peripherals free for the output and networking tasks.
4. Results and Discussion
We tested each subsystem twice—once in Proteus simulation and once on the physical board. Below we give the physiological results, the environmental results, the simulation-hardware agreement, and a joint cost analysis, noting in each case what happened, why, and how it lines up with earlier work.
4.1. Physiological Subsystem
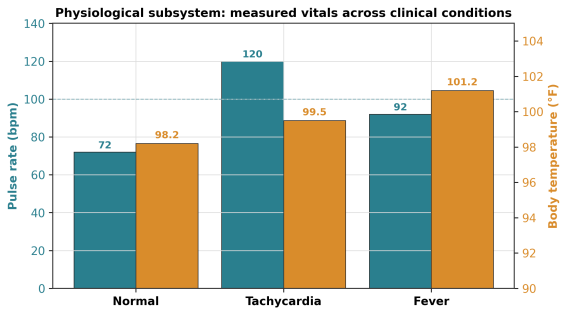
Table 3 and Figure 4 collect the vital-sign readings for three representative clinical states. The system told a normal state (72 bpm, 98.2°F) apart from tachycardia (120 bpm, 99.5°F) and from fever (92 bpm, 101.2°F), writing the matching status label to the LCD each time. The separation is clean because both the LM35 reading and the pulse-derived BPM move well beyond the measurement-noise band between these states, so fixed thresholds are enough. The figures agree with earlier Arduino and ESP health monitors and show that sharing the ADC front end with the environmental channel costs nothing in physiological accuracy.
Table 3. Physiological subsystem: measured response across clinical conditions.

Condition

Pulse (bpm)

Temp. (°F)

Status

Normal

72

98.2

Normal

Tachycardia

120

99.5

High pulse (HP)

Fever

92

101.2

High temp. (HT)

Figure 4. Measured pulse rate and body temperature across the three clinical conditions; the dual axes show the clear separation exploited by the classifier.
4.2. Environmental Subsystem
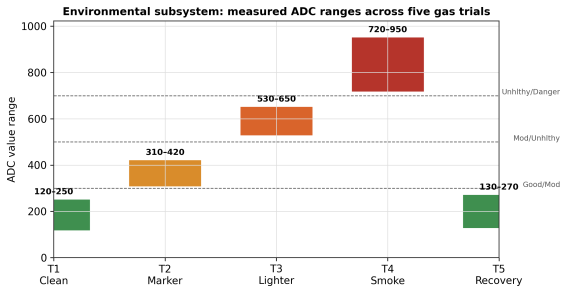
We ran five controlled trials in a semi-enclosed 2 m × 2 m room, bringing gas sources of rising strength up to the sensor. Table 4 and Figure 5 give the results. The classifier placed every trial in the correct severity band, so accuracy was 100% with no false positives during the clean-air baseline, and in the last trial the sensor returned to the good band. Over the first 90 s we saw a warm-up drift of 15-25 ADC units above baseline, matching the known behaviour of MQ-series sensors . The 8-12 s response time comes from the physical diffusion and heating of the SnO2 element, not from firmware delay, and is fine for indoor use, where hazards build up over minutes rather than seconds.
Table 4. Environmental subsystem: five-trial experimental summary.

#

Gas source

ADC range

LCD message

LED

Buzzer

1

Clean air

120-250

Air Quality: Good

Off

Off

2

Marker fumes

310-420

Status: Moderate

On

Off

3

Lighter gas

530-650

Alert: Unhealthy!

On

Slow beep

4

Heavy smoke

720-950

DANGER! Bad Air!

On

Continuous

5

Clean air (rec.)

130-270

Air Quality: Good

Off

Off

Figure 5. Measured ADC ranges for the five gas trials against the three classification boundaries; each bar falls unambiguously within its target band.
4.3. Simulation-Hardware Agreement
Table 5 sets the Proteus predictions beside the hardware measurements for all four air-quality levels. The LCD message, the LED state, and the buzzer frequency matched on every channel. The one difference showed up in absolute ADC sensitivity close to the band edges: the simulation stepped an ideal linear potentiometer, while the real MQ-135 is slightly non-linear. Since classification looks at which band a reading falls in, not at the exact count, this made no difference to accuracy over the tested range. The close match confirms both the firmware logic and the threshold calibration.
Table 5. Simulation versus hardware output (environmental subsystem).

Level

Simulated LCD

Hardware LCD

Buzzer (sim / hw)

Good

Air Quality: Good

Air Quality: Good

Silent / Silent

Moderate

Status: Moderate

Status: Moderate

Silent / Silent

Unhealthy

Alert: Unhealthy!

Alert: Unhealthy!

1 kHz / 1 kHz

Dangerous

DANGER! Bad Air!

DANGER! Bad Air!

2 kHz / 2 kHz

Full agreement across all channels confirms the fidelity of both the simulation model and the deployed firmware.
4.4. Cost Analysis
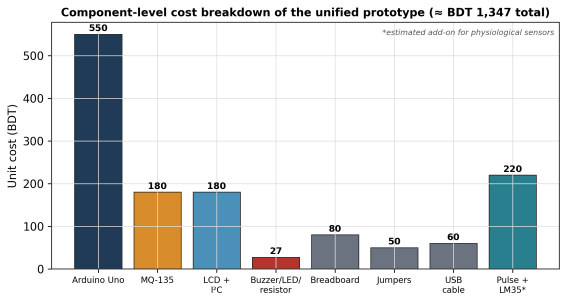
Table 6 and Figure 6 break the prototype cost down by component. The environmental subsystem alone comes to BDT 1,127 (≈ USD 10.25), 70-97% below the commercial indoor air-quality monitors sold in Bangladesh (roughly BDT 3,000-25,000). Adding physiological sensors brings the total to about BDT 1,347 (≈ USD 12.3). The key point is that both domains share a single microcontroller, display, power supply, and enclosure, so the unified node costs far less than two separate monitors would—the economic case for combining them.
Table 6. Cost breakdown of the unified prototype (local rates, BDT).

#

Component

Qty

Unit

Total

1

Arduino Uno Rev3 (ATmega328P)

1

550

550

2

MQ-135 gas sensor

1

180

180

3

16×2 LCD + I2C module

1

180

180

4

Pulse sensor + LM35

1

220

220

5

Buzzer, LED, resistor

1

27

27

6

Breadboard, jumpers, USB

1

190

190

Total prototype cost

≈ 1,347

Figure 6. Component-level cost of the unified prototype; the ESP32 gateway is optional for standalone deployments and can be omitted where connectivity is unavailable.
4.5. Discussion
Put together, the results say that two monitoring jobs that used to need separate devices can run on one cheap node with no loss of accuracy on either side: the physiological states were classified correctly, the air-quality trials hit 100% band accuracy, and simulation tracked hardware throughout. Against health-only systems , the design adds an environmental dimension that matters clinically ; against air-only systems , it adds patient context and the ability to act for the patient. It fits the direction the IoMT literature is taking—toward consolidated, edge-processed, cloud-connected devices —yet stays roughly ten times cheaper than clinical equipment, and where the network is unreliable it falls back cleanly to local alerting.
5. Limitations and Future Work
Several limitations deserve stating plainly. The present results should be read as a laboratory proof-of-concept: they establish technical feasibility under controlled conditions but do not yet demonstrate clinical performance, which limits their immediate practical significance. First, each subsystem was built and tested as a module; putting all sensors on one deployed board and running joint field trials with real patients still has to be done, and that is the immediate next step. Second, the MQ-135 needs a 1-3 min warm-up and reports a relative index rather than calibrated parts-per-million, so converting to WHO air-quality units would require sensor-specific calibration against reference gases. Moreover, the MQ-135 baseline drifts with ambient temperature and humidity and over the sensor’s operating life, so sustained quantitative accuracy would demand periodic recalibration, environmental compensation, and long-term stability testing beyond the scope of this study; combined with its cross-sensitivity across gas species, this confines the device to qualitative, relative air-quality assessment rather than species-specific or absolute measurement. Third, one MQ-135 cannot tell individual gas species apart. Fourth, the pulse and LM35 sensors are accurate enough for screening but not for diagnosis, and were not benchmarked against certified clinical instruments. Fifth, the present prototype has none of the data-security measures—encryption, authentication, and secure firmware update—that the IoMT literature treats as essential before deployment .
The next stages will therefore address: (i) co-integrating everything on one enclosed board, with joint patient trials under IRB oversight; (ii) calibrating the sensors for quantitative ppm reporting and using a sensor array to distinguish gas species; (iii) adding SpO2 and ECG channels to widen physiological coverage; (iv) building closed-loop remediation control, with automatic ventilation or purification, and an ablation study to measure its physiological benefit; (v) moving lightweight, on-device (TinyML) classification and anomaly detection onto the node to lean less on the cloud ; and (vi) adding an end-to-end security layer along the device-edge-cloud path . We also plan a sensitivity analysis of the classification thresholds and a statistical comparison against certified monitors, to firm up external validity. Finally, we plan to assess scalability to multi-node, multi-room deployments, to harden the end-to-end security layer with device authentication and encrypted transport along the device-edge-cloud path, and to pursue staged clinical validation against certified reference instruments, so that the framework can progress from laboratory proof-of-concept toward real-world patient use.
6. Conclusion
Patient health monitors and air-quality monitors are both mature classes of low-cost devices, but they have stayed separate. This paper brings them together by running a physiological subsystem (pulse and LM35) and an environmental subsystem (MQ-135) on one Arduino Uno edge node, with an ESP32 gateway to the ThingSpeak cloud and a common approach to signal conversion, threshold classification, and multi-modal alerting. In the experiments the physiological subsystem separated normal, tachycardic, and febrile states cleanly; the environmental subsystem reached 100% accuracy over its four levels with an 8-12 s latency; and simulation matched hardware on every output channel at a combined cost near BDT 1,347 (≈ USD 12.3). Beyond the device itself, the framework offers a dual-domain monitoring model and a context-aware alerting idea that puts the documented air-quality-to-cardiorespiratory link into practice—a concrete step toward patient-centered monitoring for homes, clinics, and resource-limited settings.
Abbreviations

ADC

Analog-to-Digital Converter

BPM

Beats Per Minute

COPD

Chronic Obstructive Pulmonary Disease

ECG

Electrocardiogram

IBI

Inter-Beat Interval

IoMT

Internet of Medical Things

IoT

Internet of Things

IRB

Institutional Review Board

LED

Light-Emitting Diode

ppm

Parts Per Million

PWM

Pulse-Width Modulation

SnO2

Tin Dioxide

SpO2

Peripheral Capillary Oxygen Saturation

TinyML

Tiny Machine Learning

TWI

Two-Wire Interface

USART

Universal Synchronous/Asynchronous Receiver-Transmitter

WHO

World Health Organization

Acknowledgments
The authors thank the Department of Electrical and Electronic Engineering (EEE), Faculty of Engineering, American International University–Bangladesh (AIUB) for providing access to the Electronics Laboratory and its testing facilities.
Author Contributions
Md. Shaoran Sayem: Conceptualization, Methodology, Software, Writing – original draft
Md. Mohiminul Hasan: Data curation, Investigation, Software, Validation
Bishal Kumar Paul: Data curation, Investigation, Visualization
Md. Tamzid Rahman: Formal Analysis, Visualization, Writing – review & editing
Dhrubo Roy: Data curation, Investigation, Visualization, Software
Protik Parvez Sheikh: Resources, Validation, Writing – review & editing
Sadman Shahriar Alam: Conceptualization, Supervision, Project administration, Writing – review & editing
Conflicts of Interest
The authors declare no conflicts of interest.
References
[1] S. Abdulmalek, A. Nasir, W. A. Jabbar, M. A. M. Almuhaya, A. K. Bairagi, M. Al-Masrur Khan, and S.-H. Kee, "IoT-based healthcare-monitoring system towards improving quality of life: A review," Healthcare, vol. 10, no. 10, Art. no. 1993, Oct. 2022,
[2] S. Rashid and A. Nemati, "Human-centered IoT-based health monitoring in the Healthcare 5.0 era," Discover Internet of Things, vol. 4, no. 1, Art. no. 26, 2024,
[3] World Health Organization, "Ambient (outdoor) air pollution," WHO Fact Sheet, 2024. [Online]. Available:
[4] F. H. Dominski, J. H. L. Branco, G. Buonanno, L. Stabile, M. Gameiro da Silva, and A. Andrade, "Effects of air pollution on health: A mapping review of systematic reviews and meta-analyses," Environmental Research, vol. 201, Art. no. 111487, Oct. 2021,
[5] J. de Bont, S. Jaganathan, M. Dahlquist, Å. Persson, M. Stafoggia, and P. Ljungman, "Ambient air pollution and cardiovascular diseases: An umbrella review of systematic reviews and meta-analyses," Journal of Internal Medicine, vol. 291, no. 6, pp. 779-800, 2022,
[6] N. Ndlovu and B. N. Nkeh-Chungag, "Impact of indoor air pollutants on the cardiovascular health outcomes of older adults: A systematic review," Clinical Interventions in Aging, vol. 19, pp. 1629-1639, 2024,
[7] S. Raju, H. Woo, K. Koehler, A. Fawzy, C. Liu, N. Putcha, et al., "Indoor air pollution and impaired cardiac autonomic function in chronic obstructive pulmonary disease," American Journal of Respiratory and Critical Care Medicine, vol. 207, no. 6, pp. 721-730, Mar. 2023,
[8] S. Lohar, D. Rangari, D. Shah, and R. Morande, "IoT-based health monitoring system using Arduino UNO," in Proc. Int. Conf. Emerging Technologies, vol. 1, no. 1, pp. 15-20, 2018.
[9] A. Mihat, N. M. Saad, E. F. Shair, and R. A. Rahim, "Smart health monitoring system using Arduino and IoT," in Proc. IEEE Int. Symp. Health Informatics, vol. 2, no. 2, pp. 31-37, 2019.
[10] M. M. Malathi and D. Preethi, "IoT-based patient health monitoring system," Int. J. Eng. Res. Technol. (IJERT), vol. 7, no. 1, pp. 10-15, 2019.
[11] M. S. Birajadar, N. H. Aiwale, S. H. Chavan, D. M. Patil, and D. S. Patil, "IoT-based health monitoring system," Int. J. Novel Res. Dev. (IJNRD), vol. 9, no. 5, 2024.
[12] S. Manna, S. S. Bhunia, and N. Mukherjee, "IoT-based air quality monitoring system using MQ sensors and NodeMCU," J. Phys.: Conf. Ser., vol. 2325, no. 1, Art. no. 012007, 2022,
[13] M. M. Rahman and S. Islam, "Arduino-based indoor gas detection system with I2C LCD feedback," Int. J. Eng. Res. Technol. (IJERT), vol. 10, no. 6, pp. 45-50, 2021.
[14] R. Singh, A. Kumar, and P. Sharma, "Smart air pollution detector with GSM alert and multi-level alarm," IEEE Sensors Journal, vol. 23, no. 4, 2023.
[15] M. Hasan, T. Ahmed, and K. Rahman, "Performance evaluation of MQ-series gas sensors for low-cost embedded environmental monitoring," Sensors and Actuators B: Chemical, vol. 312, 2020.
[16] A. Karim and M. Ahmed, "Real-time hazardous gas detection using ATmega328P with USART logging and PWM tone generation," Microelectronics Journal, vol. 145, 2024.
[17] M. Safaei Yaraziz, N. Sohrabi Safa, and M. A. Azad, "Edge computing in IoT for smart healthcare," Journal of Ambient Intelligence and Smart Environments, 2024,
[18] A. Philip, S. Islam, and R. Kumar, "A survey on IoT smart healthcare: Emerging technologies, applications, challenges, and future trends," arXiv:2109.02042, 2021.
[19] P. P. Sheikh, T. Riyad, B. D. Tushar, S. S. Alam, I. M. Ruddra, and A. Shufian, "Analysis of patient health using Arduino and monitoring system," Journal of Engineering Research and Reports, vol. 26, no. 3, pp. 25-33, 2024,
[20] A. J. Islam, M. M. Farhad, S. S. Alam, S. Chakraborty, M. M. Hasan, and M. S. B. Nesar, "Design, development and performance analysis of a low-cost health-care monitoring system using an Android application," in Proc. 2018 2nd Int. Conf. Innovations in Science, Engineering and Technology (ICISET), Chittagong, Bangladesh, 2018, pp. 401-406,
[21] R. K. Pathinarupothi, P. Durga, and E. S. Rangan, "IoT-based smart edge for global health: Remote monitoring with severity detection and alerts transmission," IEEE Internet of Things Journal, vol. 6, no. 2, pp. 2449-2462, 2019,
[22] S. Nayab, S. R. Chohan, A. Jameel, S. R. Shah, S. A. M. Zaidi, A. N. Jha, and K. Siddique, "Advancing remote and continuous cardiovascular patient monitoring through a novel and resource-efficient IoT-driven framework," arXiv:2505.03409, 2025.
[23] S. Ashraf, W. A. Jhan, M. Al-Kuwari, and A. K. Bandyopadhyay, "IoT and artificial intelligence implementations for remote healthcare monitoring systems: A survey," Journal of King Saud University - Computer and Information Sciences, vol. 34, no. 5, pp. 4687-4701, 2022.
[24] A. Das, R. M. Rohan, S. S. Niloy, S. S. Alam, P. P. Sheikh, and A. Sufian, "GoSafe: A dual-purpose modular IoMT device for individuals with visual impairments," Journal of Electrical and Electronic Engineering, vol. 13, no. 6, pp. 255-266, 2025,
[25] P. P. Sheikh, M. T. Hossan, S. S. Alam, and A. Shufian, "Indoor air quality monitoring and automatic ventilation system," International Journal of Research Publication and Reviews, vol. 5, no. 3, pp. 1814-1823, Mar. 2024,
[26] S. S. Alam, A. J. Islam, M. M. Hasan, M. N. M. Rafid, N. Chakma, and M. N. Imtiaz, "Design and development of a low-cost IoT based environmental pollution monitoring system," in Proc. 2018 4th Int. Conf. Electrical Engineering and Information & Communication Technology (iCEEiCT), Dhaka, Bangladesh, 2018, pp. 652-656,
[27] D. G. Karottki, M. Spilak, M. Frederiksen, L. Gunnarsen, E. V. Brauner, B. Kolarik, et al., "An indoor air filtration study in homes of the elderly: Cardiovascular and respiratory effects of exposure to particulate matter," Environmental Health, vol. 12, Art. no. 116, 2013,
[28] Microchip Technology Inc., "ATmega328P 8-bit AVR microcontroller with 32K bytes in-system programmable flash," Datasheet, 2020.
[29] Texas Instruments, "LM35 precision centigrade temperature sensors," Datasheet SNIS159, 2017.
[30] A. A. Bari, M. F. F. Antar, S. Islam, S. S. Alam, N. R. Esam, and S. M. T. H. Shovon, "A low-cost smart shoe solution for real-time obstacle detection and location monitoring in deafblind users," American Journal of Science, Engineering and Technology, vol. 10, no. 4, pp. 203-213, 2025,
Cite This Article
  • APA Style

    Sayem, M. S., Hasan, M. M., Paul, B. K., Rahman, M. T., Roy, D., et al. (2026). A Unified Low-Cost Embedded IoT Framework for Concurrent Physiological and Ambient Air-Quality Monitoring in Patient-Centred Care. Internet of Things and Cloud Computing, 14(2), 26-37. https://doi.org/10.11648/j.iotcc.20261402.11

    Copy | Download

    ACS Style

    Sayem, M. S.; Hasan, M. M.; Paul, B. K.; Rahman, M. T.; Roy, D., et al. A Unified Low-Cost Embedded IoT Framework for Concurrent Physiological and Ambient Air-Quality Monitoring in Patient-Centred Care. Internet Things Cloud Comput. 2026, 14(2), 26-37. doi: 10.11648/j.iotcc.20261402.11

    Copy | Download

    AMA Style

    Sayem MS, Hasan MM, Paul BK, Rahman MT, Roy D, et al. A Unified Low-Cost Embedded IoT Framework for Concurrent Physiological and Ambient Air-Quality Monitoring in Patient-Centred Care. Internet Things Cloud Comput. 2026;14(2):26-37. doi: 10.11648/j.iotcc.20261402.11

    Copy | Download

  • @article{10.11648/j.iotcc.20261402.11,
      author = {Md. Shaoran Sayem and Md. Mohiminul Hasan and Bishal Kumar Paul and Md. Tamzid Rahman and Dhrubo Roy and Protik Parvez Sheikh and Sadman Shahriar Alam},
      title = {A Unified Low-Cost Embedded IoT Framework for Concurrent Physiological and Ambient Air-Quality Monitoring in Patient-Centred Care},
      journal = {Internet of Things and Cloud Computing},
      volume = {14},
      number = {2},
      pages = {26-37},
      doi = {10.11648/j.iotcc.20261402.11},
      url = {https://doi.org/10.11648/j.iotcc.20261402.11},
      eprint = {https://article.sciencepublishinggroup.com/pdf/10.11648.j.iotcc.20261402.11},
      abstract = {Continuous tracking of a patient's vital signs is now routine, but the air the patient actually breathes is seldom measured by the same inexpensive device, even though air quality is a modifiable factor that affects cardiorespiratory health. Because embedded health monitors and air-quality monitors are usually built as separate products, a caregiver must install, power, and reconcile two devices, and the vital-sign readings arrive without any picture of the environment that produced them. To close this gap, we describe a single low-cost embedded platform that combines a physiological subsystem (a pulse sensor and an LM35 temperature sensor) with an environmental subsystem based on an MQ-135 gas sensor. Both share one Arduino Uno (ATmega328P) edge node, and an ESP32 Wi-Fi gateway relays the readings to the ThingSpeak cloud. A 10-bit ADC digitises every channel; the firmware converts the counts into clinical and air-quality indices, checks them against calibrated thresholds, and reports the outcome through a 16×2 I2C LCD, a graduated LED and PWM-buzzer alert stage, and a USART log. Each subsystem was built in hardware and checked against a Proteus simulation. In testing, the physiological subsystem separated normal, tachycardic, and febrile states cleanly (pulse 72-120 bpm; temperature 98.2-101.2°F), and the environmental subsystem classified all four severity levels correctly across five controlled gas trials, with an 8-12 s response time and full simulation-hardware agreement. The assembled prototype costs roughly BDT 1,347 (≈ USD 12.3). Three contributions follow: a single-node architecture serving both domains, a shared threshold-classification and multi-modal alerting scheme that works across them, and a cost model grounded in the actual build. Placing patient vitals and ambient air quality on one affordable node lets the device raise context-aware alerts—such as calling for ventilation when pollutant levels climb near a vulnerable patient—which makes it a practical fit for homes, clinics, and resource-limited settings.},
     year = {2026}
    }
    

    Copy | Download

  • TY  - JOUR
    T1  - A Unified Low-Cost Embedded IoT Framework for Concurrent Physiological and Ambient Air-Quality Monitoring in Patient-Centred Care
    AU  - Md. Shaoran Sayem
    AU  - Md. Mohiminul Hasan
    AU  - Bishal Kumar Paul
    AU  - Md. Tamzid Rahman
    AU  - Dhrubo Roy
    AU  - Protik Parvez Sheikh
    AU  - Sadman Shahriar Alam
    Y1  - 2026/08/10
    PY  - 2026
    N1  - https://doi.org/10.11648/j.iotcc.20261402.11
    DO  - 10.11648/j.iotcc.20261402.11
    T2  - Internet of Things and Cloud Computing
    JF  - Internet of Things and Cloud Computing
    JO  - Internet of Things and Cloud Computing
    SP  - 26
    EP  - 37
    PB  - Science Publishing Group
    SN  - 2376-7731
    UR  - https://doi.org/10.11648/j.iotcc.20261402.11
    AB  - Continuous tracking of a patient's vital signs is now routine, but the air the patient actually breathes is seldom measured by the same inexpensive device, even though air quality is a modifiable factor that affects cardiorespiratory health. Because embedded health monitors and air-quality monitors are usually built as separate products, a caregiver must install, power, and reconcile two devices, and the vital-sign readings arrive without any picture of the environment that produced them. To close this gap, we describe a single low-cost embedded platform that combines a physiological subsystem (a pulse sensor and an LM35 temperature sensor) with an environmental subsystem based on an MQ-135 gas sensor. Both share one Arduino Uno (ATmega328P) edge node, and an ESP32 Wi-Fi gateway relays the readings to the ThingSpeak cloud. A 10-bit ADC digitises every channel; the firmware converts the counts into clinical and air-quality indices, checks them against calibrated thresholds, and reports the outcome through a 16×2 I2C LCD, a graduated LED and PWM-buzzer alert stage, and a USART log. Each subsystem was built in hardware and checked against a Proteus simulation. In testing, the physiological subsystem separated normal, tachycardic, and febrile states cleanly (pulse 72-120 bpm; temperature 98.2-101.2°F), and the environmental subsystem classified all four severity levels correctly across five controlled gas trials, with an 8-12 s response time and full simulation-hardware agreement. The assembled prototype costs roughly BDT 1,347 (≈ USD 12.3). Three contributions follow: a single-node architecture serving both domains, a shared threshold-classification and multi-modal alerting scheme that works across them, and a cost model grounded in the actual build. Placing patient vitals and ambient air quality on one affordable node lets the device raise context-aware alerts—such as calling for ventilation when pollutant levels climb near a vulnerable patient—which makes it a practical fit for homes, clinics, and resource-limited settings.
    VL  - 14
    IS  - 2
    ER  - 

    Copy | Download

Author Information
  • Department of Electrical & Electronic Engineering, American International University-Bangladesh, Dhaka, Bangladesh
  • Department of Electrical & Electronic Engineering, American International University-Bangladesh, Dhaka, Bangladesh

  • Department of Electrical & Electronic Engineering, American International University-Bangladesh, Dhaka, Bangladesh

  • Department of Electrical & Electronic Engineering, American International University-Bangladesh, Dhaka, Bangladesh

  • Department of Electrical & Electronic Engineering, American International University-Bangladesh, Dhaka, Bangladesh

  • Department of Electrical & Electronic Engineering, American International University-Bangladesh, Dhaka, Bangladesh

  • Department of Electrical & Electronic Engineering, American International University-Bangladesh, Dhaka, Bangladesh

  • Abstract
  • Keywords
  • Document Sections

    1. 1. Introduction
    2. 2. Related Work
    3. 3. Unified System Methodology and Design
    4. 4. Results and Discussion
    5. 5. Limitations and Future Work
    6. 6. Conclusion
    Show Full Outline
  • Abbreviations
  • Acknowledgments
  • Author Contributions
  • Conflicts of Interest
  • References
  • Cite This Article
  • Author Information