Abstract
Previous studies of natural gas from the Ustyurt region have focused mainly on geological characteristics or individual quality parameters, whereas integrated assessments linking hydrocarbon composition, energy performance, impurity concentrations, and flow-rate-based treatment loads at individual gas gathering stations (GGSs) remain limited. This study addressed this gap by comparing 15 sets of production and analytical data from GGSs at fields in the Ustyurt region. Seven gas streams were examined in detail using direct comparison, range analysis, and calculations of daily mercury and volumetric hydrogen sulfide loads. The principal contribution of the study is the combined assessment of gas composition, energy properties, and impurity loads under field operating conditions. Increasing C2+ hydrocarbon content was associated with higher gas density, molar mass, higher heating value, and Wobbe index. For the seven selected sites, linear relationships were obtained between C2+ content and both higher heating value (R2 = 0.9938) and Wobbe index (R2 = 0.9893). The gas with the highest methane content did not exhibit the highest energy value because of its low CS2+ content and comparatively high carbon dioxide concentration. The stream with the highest mercury concentration was not the stream with the greatest daily mercury load, demonstrating that impurity concentration must be evaluated together with gas flow rate. The results provide a basis for GGS-specific decisions on mercury and hydrogen sulfide removal, hydrocarbon dew-point control, stream blending, and feed preparation before transportation and downstream gas processing.
Keywords
Natural Gas, Hydrocarbon Composition, Ustyurt Gas-bearing Region, Gas Gathering Station, Heating Value, Wobbe Index, Mercury, Gas Treatment
1. Introduction
Natural gas is a complex multicomponent hydrocarbon feedstock composed predominantly of methane, while its technologically and energetically significant fraction includes ethane, propane, isomeric butanes, pentanes, and heavier hydrocarbons. It may also contain nitrogen, carbon dioxide, hydrogen sulfide, mercury compounds, water vapor, and other impurities. Consequently, the technological properties and commercial value of natural gas are determined not only by its methane content but also by the proportions of heavier hydrocarbons and non-hydrocarbon components.
The Ustyurt gas-bearing region is one of the major hydrocarbon resource areas in the Republic of Uzbekistan. Its gas potential is associated with productive Upper, Middle, and Lower Jurassic formations and with numerous discovered gas and gas-condensate fields
| [1] | Abdullaev G. S., Bogdanov A. N., Eydel’nant N. K. Sovremennoe sostoyanie i perspektivy razvitiya geologorazvedochnykh rabot na neft’ i gaz v Ustyurtskom regione Respubliki Uzbekistan [Current state and development prospects of exploration activity for oil and gas in the Ustyurt region (Uzbekistan)]. Neftegazovaya Geologiya. Teoriya i Praktika. 2019; 14(1). https://doi.org/10.17353/2070-5379/10_2019 (In Russian). |
[1]
. According to consolidated state reserve balance data for 1963–2021, the Ustyurt region accounted for approximately 11.0% of the initial hydrocarbon reserves in commercial categories and 4.1% of the cumulative hydrocarbon production in Uzbekistan
| [2] | Bogdanov A. N., Khmyrov P. V., Abduraimov M. Kh., Tukhtaev R. R. Dinamika zapasov i dobychi uglevodorodnogo syr’ya Ustyurtskogo regiona [Dynamics of reserves and production of hydrocarbons in the Ustyurt region]. Neftegazovaya Geologiya. Teoriya i Praktika. 2023; 18(2). https://doi.org/10.17353/2070-5379/13_2023 (In Russian). |
[2]
. The Surgil, Sharki Berdak, Berdak–Shimoliy Berdak, and Arslan fields, together with several other production sites, make a substantial contribution to the region’s reserves and production
| [2] | Bogdanov A. N., Khmyrov P. V., Abduraimov M. Kh., Tukhtaev R. R. Dinamika zapasov i dobychi uglevodorodnogo syr’ya Ustyurtskogo regiona [Dynamics of reserves and production of hydrocarbons in the Ustyurt region]. Neftegazovaya Geologiya. Teoriya i Praktika. 2023; 18(2). https://doi.org/10.17353/2070-5379/13_2023 (In Russian). |
[2]
. However, published regional studies have mainly addressed geological structure, exploration prospects, reserve dynamics, and production history, whereas comparative assessments of the composition and technological properties of gas supplied to individual gas gathering stations (GGSs) remain limited.
The component composition of natural gas depends on the geological characteristics of the field, reservoir conditions, and changes occurring during production and field separation. The contents of ethane, propane, butanes, pentanes, and heavier hydrocarbons influence the molar mass, density, phase behavior, and energy characteristics of the feedstock. Accurate determination of gas composition is therefore essential for evaluating gas quality and selecting appropriate treatment and transportation conditions. Studies aimed at rapid natural gas quality control have often been based on model mixtures that do not fully represent variations in nitrogen, carbon dioxide, individual hydrocarbon isomers, and components heavier than butane encountered in actual field gas
| [3] | Ferreiro B., Andrade J. M., López-Mahía P., Muniategui-Lorenzo S., Vázquez C., Pérez A., Rey M., Vales C. Fast quality control of natural gas for commercial supply and transport utilities. Fuel. 2021; 305: 121500.
https://doi.org/10.1016/j.fuel.2021.121500 |
[3]
.
The heating value of natural gas is calculated from its component composition by summing the contributions of the individual combustible components according to their molar fractions and specific heating values
. An increase in the proportion of C
2+ hydrocarbons generally increases the volumetric heating value while simultaneously increasing molar mass and relative density. In contrast, nitrogen and carbon dioxide do not contribute directly to the heating value and reduce the proportion of combustible components in the gas
| [5] | Sandfort V., Trabold B. M., Abdolvand A., Bolwien C., Russell P. St. J., Wöllenstein J., Palzer S. Monitoring the Wobbe index of natural gas using fiber-enhanced Raman spectroscopy. Sensors. 2017; 17(12): 2714. https://doi.org/10.3390/s17122714 |
[5]
. The Wobbe index relates the volumetric heating value to relative density and is widely used to evaluate the energy equivalence and interchangeability of gaseous fuels. Variations in methane, heavier hydrocarbons, carbon dioxide, and nitrogen may therefore significantly affect both the heating value and Wobbe index
| [5] | Sandfort V., Trabold B. M., Abdolvand A., Bolwien C., Russell P. St. J., Wöllenstein J., Palzer S. Monitoring the Wobbe index of natural gas using fiber-enhanced Raman spectroscopy. Sensors. 2017; 17(12): 2714. https://doi.org/10.3390/s17122714 |
| [6] | Kuczyński S., Łaciak M., Szurlej A., Włodek T. Impact of liquefied natural gas composition changes on methane number as a fuel quality requirement. Energies. 2020; 13(19): 5060.
https://doi.org/10.3390/en13195060 |
[5, 6]
.
Non-hydrocarbon impurities must also be considered when selecting field gas treatment conditions. Carbon dioxide and hydrogen sulfide reduce commercial gas quality and may cause corrosion, operational restrictions, and additional loads on absorption and purification systems. Their removal commonly involves chemical or hybrid solvents, including alkanolamine-based systems
| [7] | Farooqi A. S., Ramli R. M., Lock S. S. M., Farooqi A. S., Shahid M. Z., Hasnain S. M. W. U., Hira N. E., Abdullah B. Removal of carbon dioxide and hydrogen sulfide from natural gas using a hybrid solvent of monoethanolamine and N-methyl-2-pyrrolidone. ACS Omega. 2024; 9(24): 25704–25714.
https://doi.org/10.1021/acsomega.3c09100 |
[7]
. The selection and operating efficiency of such processes depend on the impurity concentration, gas composition, treatment conditions, and amount of gas supplied to the facility.
Mercury is another technologically significant impurity because it may damage aluminum heat exchangers, contaminate process equipment, poison catalysts, and migrate between gas, condensate, and aqueous phases during separation and treatment. Evaluation of mercury solely on the basis of its measured concentration may not adequately reflect the actual load on a gas treatment facility. Ezzeldin et al. demonstrated that gas flow-rate data for individual process sections can be used to calculate the daily mass of transported mercury and identify its redistribution within a natural gas processing plant
| [8] | Ezzeldin M. F., Gajdosechova Z., Masod M. B., Zaki T., Feldmann J., Krupp E. M. Mercury speciation and distribution in an Egyptian natural gas processing plant. Energy & Fuels. 2016; 30(12): 10236–10243.
https://doi.org/10.1021/acs.energyfuels.6b02035 |
[8]
. Therefore, streams with the highest impurity concentrations do not necessarily impose the greatest daily load on purification equipment.
Recent international research has emphasized the importance of reliable quantitative determination of natural gas composition and the use of reproducible quality-control criteria when composition data are applied to calculate physicochemical properties
| [9] | Ortiz Restrepo S. A., Swiatek A., Ohligschläger A., Mohnke O., Thern H., Widerøe H. C., Dupuy P. M., Leknes Ø., Adams A. Quantitative composition analysis of natural gas by high-pressure proton low-field NMR spectroscopy: Development of an improved experimental methodology. Gas Science and Engineering. 2024; 128: 205377.
https://doi.org/10.1016/j.jgsce.2024.205377 |
[9]
. Studies of mercury removal from natural gas have also shown that sorbent performance may be affected by water vapor, hydrogen sulfide, carbon dioxide, and other components present in the gas matrix
| [10] | Zhang Y., Wang Y., Wang H., Wang B., Chen H., Wu S., Bao W., Chang L., Wang S., Wang J. Cu incorporating into OMS-2 lattice creates an efficient Hg⁰ removal sorbent in natural gas with ambient-temperature H2S/H₂O tolerance. Chemical Engineering Journal. 2023; 478: 147452.
https://doi.org/10.1016/j.cej.2023.147452 |
| [11] | Hong Q., Xu H., Ling C., Liu Z., Huang W., Yang S., Qu Z., Zhang L., Yan N. Low-coordinated polysulfide species on metal sulfide enabled superior gaseous mercury removal from natural gas. Environmental Science & Technology. 2025; 59(8) 4178–4187. https://doi.org/10.1021/acs.est.4c10944 |
[10, 11]
. Current research on hydrogen sulfide treatment has examined both the intensification of absorption using methyl diethanolamine solutions and alternative approaches involving the conversion of captured H
2S into value-added products
| [12] | Ma L., Zhang Y., Liu A., Zhao Z., Wang L., Chang Y., Duan X., Gao P. The high removal efficiency of H2S by MDEA solution in high-jets oscillating purifier. ACS Omega. 2025; 10(37): 42815–42825. https://doi.org/10.1021/acsomega.5c05157 |
| [13] | Zhang C., Li A.-Z., Yuan B.-J., Liu X., Liu Y., Kong K., Shi Q., Zhang Y., Luo Y., Li S., Zhou H., Duan H. Electrochemical valorization of H2S in natural gas to sulfate under mild conditions. Nature Communications. 2025; 16: 7175.
https://doi.org/10.1038/s41467-025-62445-y |
[12, 13]
. These findings confirm that impurity concentrations should be interpreted together with gas composition, flow rate, and the operating requirements of the selected purification technology.
Despite these advances, hydrocarbon composition, energy characteristics, and non-hydrocarbon impurities are still frequently evaluated as separate groups of indicators. For the Ustyurt region, an integrated comparison based on actual data from multiple GGSs and combining C1–C6+ composition, density, molar mass, heating value, Wobbe index, mercury and hydrogen sulfide concentrations, and flow-rate-based impurity loads has not been sufficiently documented. This limits the possibility of identifying whether the stream with the highest impurity concentration also creates the greatest treatment load and whether methane content alone provides an adequate indication of gas energy performance.
The objective of this study was to evaluate the variability of the component composition of gas supplied to GGSs at fields in the Ustyurt region, establish the relationships between C2+ hydrocarbon content, molar mass, density, heating value, and Wobbe index, and assess the technological significance of carbon dioxide, hydrogen sulfide, and mercury with consideration of the gas flow rates at the corresponding GGSs. The principal contribution of the study is the integrated comparison of hydrocarbon composition, energy properties, impurity concentrations, and calculated treatment loads to support differentiated decisions on gas conditioning and purification.
2. Materials and Methods
2.1. Data Source and Selection of the Analytical Dataset
The initial analytical data were obtained during routine production studies conducted at gas gathering stations (GGSs) at the Surgil, Kuyi Surgil, Arslan, Shagyrlyk, Inam, Sharki Berdak, Kuyi Sharki Berdak, and Shimoliy Berdak fields. Gas sampling and chromatographic analysis were performed by the authors, and the resulting component concentrations were documented in the corresponding production and analytical reports. The operating parameters of the GGSs were obtained from the same production records. These analytical and operational data formed the initial dataset for the present comparative assessment.
The initial dataset comprised 15 records characterizing gas supplied to the investigated GGSs. Each GGS receives a combined gas stream from approximately 10–20 wells at the corresponding field. Consequently, each record represents the composition and properties of a combined GGS inlet stream and should not be interpreted as the composition of gas from an individual well.
All 15 records contained data on the component composition of the gas, including nitrogen, carbon dioxide, methane, ethane, propane, n-butane, isobutane, n-pentane, isopentane, neopentane, and C6+ hydrocarbons. These records were used to determine the overall ranges of variation in methane, C2+, C6+, nitrogen, and carbon dioxide contents.
A complete-case criterion was applied to select the records for the integrated technological assessment. A record was included only when it contained all of the following variables: all of the following variables: component composition, relative density, density at 20°C, molar mass, higher and lower heating values, higher Wobbe index, mercury concentration, hydrogen sulfide concentration, and GGS gas flow rate. Seven records representing seven gas streams from six GGSs met this criterion: West Kuyi Surgil GGS; GGS-2 at the Kuyi Surgil field; Arslan GGS; GGS-1 at the Sharki Berdak field; the medium- and high-pressure gas streams from Kuyi Sharki Berdak GGS; and GGS-2 at the Shimoliy Berdak field. Thus, the selection of these records was determined by data completeness rather than by subjective choice. Missing values were not reconstructed by calculation or interpolation.
The component totals in the production records were checked before comparative analysis. The reported component fractions summed to 100%, confirming the internal consistency of the normalized compositions.
The available production and analytical reports did not contain quantitative estimates of measurement uncertainty. Therefore, formal propagation of analytical uncertainty could not be performed. The original numerical precision of the reported results was retained. This limitation was taken into account when interpreting the data, which were used primarily for the comparative technological assessment of the investigated gas streams.
2.2. Data Processing and Calculation Procedures
The component composition was expressed in mol.%. The total C
2+ hydrocarbon content was calculated as the sum of ethane and all heavier hydrocarbons, including the C
6+ fraction. GOST 31371.1-2020 and GOST 31371.5-2022 were used as the methodological references for processing and normalizing the chromatographic composition data
| [14] | GOST 31371.1-2020 (ISO 6974-1: 2012). Natural gas—Determination of composition and associated uncertainty by gas chromatography—Part 1: General guidelines and calculation of composition. |
| [15] | GOST 31371.5-2022 (ISO 6974-5: 2014). Natural gas—Determination of composition and associated uncertainty by gas chromatography—Part 5: Isothermal method for nitrogen, carbon dioxide, C₁ to C₅ hydrocarbons and C6+ hydrocarbons. |
[14, 15]
. After normalization, the total component content was taken as 100%.
Relative density, density, molar mass, higher and lower heating values, and the higher Wobbe index were taken from the production records and checked for consistency with the normalized component composition using the calculation principles specified in GOST 31369-2021
| [16] | GOST 31369-2021 (ISO 6976: 2016). Natural gas—Calculation of calorific values, density, relative density and Wobbe indices from composition. |
[16]
. Density, heating values, and Wobbe indices were compared under identical reference conditions of 20°C and 101.325 kPa.
The analysis was performed in two stages. First, all 15 composition records were used to establish the minimum and maximum contents of methane, C2+ and C6+ hydrocarbons, nitrogen, and carbon dioxide. Second, the seven complete records were used for the integrated comparison of composition, physical and energy properties, impurity concentrations, and flow-rate-based impurity loads.
The relationships between the total C2+ hydrocarbon content and the higher heating value and higher Wobbe index were evaluated by ordinary least-squares linear regression. The total C2+ content was treated as the independent variable, while the higher heating value or higher Wobbe index was treated as the dependent variable. Regression equations and coefficients of determination (R2) were calculated for the seven complete records. Because the dataset was small and was not obtained through random sampling, the regression results were interpreted as descriptive relationships within the investigated dataset.
The daily mercury load entering each GGS was calculated as follows:
where LHg is the mercury load in g/day, CHg is the mercury concentration in ng/m³, and Q is the numerical gas flow rate expressed in 103 m3/day.
The volumetric hydrogen sulfide load was calculated as follows:
where LH2S is the volumetric hydrogen sulfide load in m3/day, CH2S is the hydrogen sulfide concentration in ppm by volume, and Q is the numerical gas flow rate expressed in 103 m3/day.
The gas flow-rate unit was verified by recalculating the mercury and hydrogen sulfide loads reported for all seven records and was confirmed as 103 m3/day. The calculated values represent the inlet impurity loads and do not account for temporal fluctuations, mercury speciation, or the removal efficiency of subsequent purification processes.
The results were evaluated using direct comparison, range analysis, and descriptive regression analysis. Energy characteristics are reported in MJ/m3, mercury concentrations in ng/m3, hydrogen sulfide concentrations in ppm, mercury loads in g/day, and volumetric hydrogen sulfide loads in m3/day.
3. Results and Discussion
3.1. Comparative Assessment of the Component Composition of Gas Supplied to the GGSs
The gas chromatographic analysis revealed considerable heterogeneity in the component composition of the investigated gaseous feedstock. The principal differences were observed in the contents of methane, total C
2+ hydrocarbons, the C
6+ fraction, nitrogen, and carbon dioxide.
Table 1 presents the key parameters for all 15 analytical data records included in the initial comparative assessment.
The methane content in gas supplied to the investigated GGSs ranged from 81.307 to 94.907 mol.%. The maximum value was recorded for the high-pressure gas from the Kuyi Sharki Berdak GGS, whereas the minimum value was observed for the collector-line gas from the Sharki Berdak GGS. The difference between the extreme values was 13.600 percentage points, indicating substantial heterogeneity in the hydrocarbon composition of the gaseous feedstock.
The total C2+ hydrocarbon content ranged from 1.278 to 13.211 mol.%. The lowest value was recorded for the high-pressure gas from the Kuyi Sharki Berdak GGS. The maximum C2+ content was observed in the collector-line gas from the Sharki Berdak GGS, in which the ethane and propane contents were 6.043 and 3.487 mol.%, respectively, while the total C4 hydrocarbon content reached 1.866 mol.%. Therefore, the gas from this GGS was characterized by the highest enrichment in heavier hydrocarbon components.
The C6+ fraction ranged from 0.024 to 1.086 mol.%. In the collector-line gas from the Sharki Berdak GGS, the C6+ concentration was more than 45 times higher than the minimum value recorded for the high-pressure gas from the Kuyi Sharki Berdak GGS. This difference is technologically significant because a higher proportion of heavy hydrocarbons may increase the tendency of gaseous feedstock to form a liquid hydrocarbon phase when pressure and temperature change during treatment and transportation.
Table 1. Key component composition parameters of gas supplied to the investigated GGSs, mol.%.
№ | Field, GGS designation, and gas category | CH4 | ΣC2+ | C6+ | N2 | CO2 |
1 | West Kuyi Surgil GGS | 94.735 | 1.844 | 0.053 | 0.348 | 3.073 |
2 | GGS-2, Kuyi Surgil field | 92.967 | 3.556 | 0.134 | 0.566 | 2.911 |
3 | GGS-3, Kuyi Surgil field | 94.805 | 1.572 | 0.025 | 0.601 | 3.022 |
4 | GGS-1, Kuyi Surgil field | 92.813 | 3.748 | 0.129 | 0.610 | 2.829 |
5 | Shagyrlyk GGS | 90.645 | 7.986 | 0.253 | 0.578 | 0.791 |
6 | Arslan GGS | 92.129 | 5.492 | 0.230 | 0.774 | 1.605 |
7 | Inam GGS | 89.435 | 8.178 | 0.391 | 0.993 | 1.394 |
8 | Sharki Berdak GGS—collector-line gas | 81.307 | 13.211 | 1.086 | 1.949 | 3.534 |
9 | Kuyi Sharki Berdak GGS—medium-pressure gas | 94.108 | 2.586 | 0.075 | 0.349 | 2.957 |
10 | Kuyi Sharki Berdak GGS—high-pressure gas | 94.907 | 1.278 | 0.024 | 0.355 | 3.460 |
11 | GGS-1, Sharki Berdak field | 89.574 | 8.282 | 0.467 | 1.420 | 0.725 |
12 | GGS-3, Sharki Berdak field | 93.998 | 2.617 | 0.084 | 0.453 | 2.932 |
13 | GGS-2, Shimoliy Berdak field | 89.056 | 8.739 | 0.627 | 1.982 | 0.223 |
14 | GGS-3, Shimoliy Berdak field | 90.386 | 7.423 | 0.309 | 1.746 | 0.445 |
15 | GGS-5, Shimoliy Berdak field | 89.459 | 7.764 | 0.340 | 1.836 | 0.941 |
Overall, the investigated dataset showed a tendency for the methane fraction to decrease as the C2+ hydrocarbon content increased. Elevated contents of heavier components were observed in the collector-line gas from the Sharki Berdak GGS, the gas from GGS-2 at the Shimoliy Berdak field, the gas from GGS-1 at the Sharki Berdak field, and the gas from the Inam and Shagyrlyk GGSs. In contrast, the high-pressure gas from the Kuyi Sharki Berdak GGS and the gas from GGS-3 at the Kuyi Surgil field were predominantly methane-rich and contained minimum concentrations of heavier hydrocarbons.
The nitrogen content ranged from 0.348 to 1.982 mol.%, while the carbon dioxide content ranged from 0.223 to 3.534 mol.%. A high methane content was not always accompanied by a low concentration of non-hydrocarbon components. For example, the high-pressure gas from the Kuyi Sharki Berdak GGS contained the maximum methane fraction, while its CO2 content reached 3.460 mol.%. Therefore, the technological and energy value of the investigated gas should be assessed not only from its methane concentration but also with consideration of the C2+ hydrocarbon content, non-hydrocarbon components, and corresponding energy characteristics.
3.2. Physical and Energy Characteristics of the Gaseous Feedstock
To establish the relationship between hydrocarbon composition and the energy properties of the gas, data for the seven selected sites were compared. The principal parameters considered were relative density, gas density, molar mass, higher and lower heating values, and the higher Wobbe index. The results are presented in
Table 2.
The relative density of the gas from the selected sites ranged from 0.5973 to 0.6470, the gas density from 0.7195 to 0.7793 kg/m3, and the molar mass from 17.27 to 18.70 g/mol. The minimum values of these parameters were recorded for the high-pressure gas from the Kuyi Sharki Berdak GGS, whereas the maximum values were observed for the gas from GGS-2 at the Shimoliy Berdak field.
Increases in density and molar mass were generally accompanied by an increase in the C2+ hydrocarbon content. The high-pressure gas from the Kuyi Sharki Berdak GGS had the lowest total C2+ fraction, at 1.278 mol.%, and the lowest molar mass, at 17.27 g/mol. In the gas from GGS-2 at the Shimoliy Berdak field, the C2+ content reached 8.739 mol.%, while the molar mass increased to 18.70 g/mol. A similar relationship was observed for the gas from GGS-1 at the Sharki Berdak field, which was characterized by elevated C2+ content, density, and molar mass.
The higher heating value of the gas from the selected sites ranged from 36.14 to 40.97 MJ/m3, while the lower heating value ranged from 32.56 to 37.06 MJ/m3. The highest values of both parameters were recorded for the gas from GGS-2 at the Shimoliy Berdak field. The gas from this GGS combined an elevated C2+ hydrocarbon content with the lowest carbon dioxide concentration in the selected group, at 0.223 mol.%.
Table 2. Physical and energy characteristics of gas from the selected sites.
№ | Field, GGS designation, and gas category | Relative density | Density, kg/m3 | Molar mass, g/mol | Higher heating value, MJ/m3 | Lower heating value, MJ/m3 | Higher Wobbe index, MJ/m3 |
1 | West Kuyi Surgil GGS | 0.5976 | 0.7197 | 17.28 | 36.51 | 32.91 | 47.23 |
2 | GGS-2, Kuyi Surgil field | 0.6095 | 0.7341 | 17.62 | 37.21 | 33.56 | 47.67 |
3 | Arslan GGS | 0.6158 | 0.7417 | 17.80 | 38.65 | 34.89 | 49.25 |
4 | GGS-1, Sharki Berdak field | 0.6398 | 0.7707 | 18.49 | 40.44 | 36.56 | 50.56 |
5 | Kuyi Sharki Berdak GGS—medium-pressure gas | 0.6020 | 0.7250 | 17.40 | 36.87 | 33.24 | 47.52 |
6 | Kuyi Sharki Berdak GGS—high-pressure gas | 0.5973 | 0.7195 | 17.27 | 36.14 | 32.56 | 46.76 |
7 | GGS-2, Shimoliy Berdak field | 0.6470 | 0.7793 | 18.70 | 40.97 | 37.06 | 50.93 |
The gas from GGS-1 at the Sharki Berdak field was also characterized by a high energy value: its higher heating value was 40.44 MJ/m3, and its lower heating value was 36.56 MJ/m3. The C2+ hydrocarbon content of this gas reached 8.282 mol.%, while the combined fraction of nitrogen and carbon dioxide remained lower than in the gas from several predominantly methane-rich sites.
The minimum heating values were recorded for the high-pressure gas from the Kuyi Sharki Berdak GGS despite its maximum methane content of 94.907 mol.%. This was attributable to its low C2+ hydrocarbon content and comparatively high carbon dioxide concentration of 3.460 mol.%. Therefore, a high methane content alone does not ensure the maximum energy value of the gas.
The higher Wobbe index ranged from 46.76 to 50.93 MJ/m3. The maximum value corresponded to the gas from GGS-2 at the Shimoliy Berdak field, whereas the minimum value was recorded for the high-pressure gas from the Kuyi Sharki Berdak GGS. The difference between the extreme values was 4.17 MJ/m3. This difference should be considered when gas from different GGSs is commingled, when gas treatment conditions are selected, and when stable characteristics for subsequent combustion are maintained.
The results demonstrate that the energy properties of the gaseous feedstock are determined by the combined effects of methane, C2+ hydrocarbons, and non-hydrocarbon components. Gas with elevated contents of ethane, propane, and heavier hydrocarbons has a higher heating value but also requires more stringent control of its phase behavior during treatment and transportation. Therefore, an assessment of the gas composition should provide a basis both for determining its energy value and for selecting the appropriate processing route.
3.3. Relationship Between Hydrocarbon Composition and the Energy Characteristics of the Gas
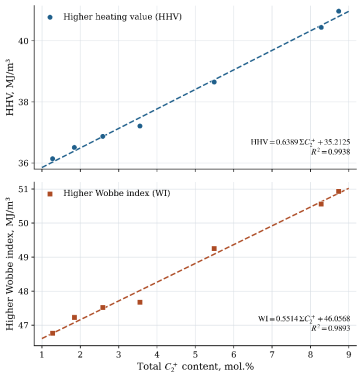
Comparison of the component analysis results with the physical and energy parameters revealed a systematic variation in the properties of the investigated gas depending on its C2+ hydrocarbon content. In the gas from the seven selected sites, the total C2+ hydrocarbon concentration ranged from 1.278 to 8.739 mol.%. An increase in the fraction of ethane and heavier hydrocarbons was accompanied by increases in gas density, molar mass, and heating value.
The lowest energy parameters were recorded for the high-pressure gas from the Kuyi Sharki Berdak GGS. At a C
2+ content of 1.278 mol.%, the higher heating value was 36.14 MJ/m
3, the lower heating value was 32.56 MJ/m³, and the higher Wobbe index was 46.76 MJ/m³. Despite its maximum methane content of 94.907 mol.%, this gas did not exhibit the highest energy value. Ethane and heavier hydrocarbons make a greater contribution to the volumetric heating value than methane; therefore, the low C
2+ content reduced the combined heating value of this gas. In addition, carbon dioxide is non-combustible, and its concentration of 3.460 mol.% further diluted the combustible fraction. Since the Wobbe index depends on both heating value and relative density, the combined effect of low C
2+ content and elevated CO
2 content also resulted in the minimum higher Wobbe index
| [4] | Ulbig P., Hoburg D. Determination of the calorific value of natural gas by different methods. Thermochimica Acta. 2002; 382(1–2): 27–35.
https://doi.org/10.1016/S0040-6031(01)0732-8 |
| [5] | Sandfort V., Trabold B. M., Abdolvand A., Bolwien C., Russell P. St. J., Wöllenstein J., Palzer S. Monitoring the Wobbe index of natural gas using fiber-enhanced Raman spectroscopy. Sensors. 2017; 17(12): 2714. https://doi.org/10.3390/s17122714 |
[4, 5]
.
The opposite trend was observed for the gas from GGS-2 at the Shimoliy Berdak field. Its methane content was 89.056 mol.%, while the total C2+ hydrocarbon concentration reached 8.739 mol.%. The gas from this GGS had the maximum higher and lower heating values of 40.97 and 37.06 MJ/m3, respectively, as well as the maximum higher Wobbe index of 50.93 MJ/m3. Similar values were obtained for the gas from GGS-1 at the Sharki Berdak field, which contained 8.282 mol.% C2+ hydrocarbons.
The gas from the Arslan GGS occupied an intermediate position. At a C2+ content of 5.492 mol.%, its higher heating value was 38.65 MJ/m3, while its higher Wobbe index was 49.25 MJ/m3. The gas from the West Kuyi Surgil GGS, GGS-2 at the Kuyi Surgil field, and the medium-pressure gas from the Kuyi Sharki Berdak GGS contained lower amounts of heavier hydrocarbons and consequently exhibited lower energy parameters. As the C2+ content increased, the relative density of the gas from the selected sites increased from 0.5973 to 0.6470, while its molar mass increased from 17.27 to 18.70 g/mol. Therefore, the energy value of the investigated gas cannot be assessed solely on the basis of its methane content. A comprehensive assessment must consider the proportions of methane, C2+ hydrocarbons, carbon dioxide, and nitrogen.
Figure 1. Dependence of the higher heating value and higher Wobbe index on the total C2+ hydrocarbon content in gas from the seven selected sites.
The results allow the investigated sites to be classified as supplying predominantly methane-rich gas or gas enriched in C2+ hydrocarbons. This classification may be used when selecting gaseous feedstock treatment conditions, predicting the potential formation of a liquid hydrocarbon phase, and determining appropriate routes for the recovery of valuable organic components.
3.4. Impurity Content and Calculated Load on Gas Treatment Processes
In addition to hydrocarbon composition and energy characteristics, the mercury and hydrogen sulfide contents and their total loads in the gas are of considerable importance when selecting a gaseous feedstock treatment technology. Concentration-based parameters do not always reflect the actual load on purification equipment because the amount of impurities entering the system also depends on the gas flow rate. The calculation results for the seven selected sites are presented in
Table 3.
The mercury concentration varied from 50 to 1,173,000 ng/m
3, corresponding to a 23,460-fold difference between the minimum and maximum values. The maximum concentration was recorded in the medium-pressure gas from the Kuyi Sharki Berdak GGS, whereas the minimum value occurred in the gas from GGS-2 at the Shimoliy Berdak field. Even within the Kuyi Sharki Berdak GGS, the mercury concentration in the medium-pressure gas was approximately 2.17 times higher than that in the high-pressure gas. This variation may be associated with differences in reservoir composition and with the redistribution of mercury among the gas, condensate, and aqueous phases during gas separation and treatment
| [8] | Ezzeldin M. F., Gajdosechova Z., Masod M. B., Zaki T., Feldmann J., Krupp E. M. Mercury speciation and distribution in an Egyptian natural gas processing plant. Energy & Fuels. 2016; 30(12): 10236–10243.
https://doi.org/10.1021/acs.energyfuels.6b02035 |
[8]
. Because quantitative estimates of measurement uncertainty were unavailable, these possible explanations were considered qualitatively and were not treated as quantitatively established causes of the observed differences.
Table 3. Impurity content in gas and calculated load on treatment processes at the selected GGSs.
№ | Field, GGS designation, and gas category | Hg, ng/m3 | H2S, ppm | Gas flow rate, 103 m3/day | Calculated Hg load, g/day | Volumetric H2S load, m3/day |
1 | West Kuyi Surgil GGS | 232,000 | 12.0 | 985 | 228.520 | 11.820 |
2 | GGS-2, Kuyi Surgil field | 316,000 | 1.1 | 1,114 | 352.024 | 1.225 |
3 | Arslan GGS | 294,000 | 1.0 | 222 | 65.268 | 0.222 |
4 | GGS-1, Sharki Berdak field | 117,000 | 1.0 | 350 | 40.950 | 0.350 |
5 | Kuyi Sharki Berdak GGS—medium-pressure gas | 1,173,000 | 1.0 | 339 | 397.647 | 0.339 |
6 | Kuyi Sharki Berdak GGS—high-pressure gas | 540,000 | 1.0 | 959 | 517.860 | 0.959 |
7 | GGS-2, Shimoliy Berdak field | 50 | 1.0 | 727 | 0.036 | 0.727 |
The stream with the highest mercury concentration did not produce the highest daily mercury load. The calculated load was 397.647 g/day for the medium-pressure gas from the Kuyi Sharki Berdak GGS and 517.860 g/day for the high-pressure gas from the same GGS because of the higher flow rate of the latter stream. Thus, mercury concentration characterizes the severity of contamination at the treatment-unit inlet, whereas daily mass load is the more relevant parameter for estimating the required sorbent capacity and replacement frequency. Accordingly, the high-pressure gas stream from the Kuyi Sharki Berdak GGS should receive priority when sizing mercury-removal capacity, while the high inlet concentration of the medium-pressure stream should also be considered when selecting the treatment configuration.
The hydrogen sulfide content in the gas from most of the selected sites was 1.0-1.1 ppm. The exception was the gas from the West Kuyi Surgil GGS, in which the H2S concentration reached 12 ppm. At a gas flow rate of 985 × 103 m3/day, the calculated volumetric hydrogen sulfide load was 11.820 m3/day, substantially exceeding the values obtained for the gas from the other selected sites.
The results demonstrate that hydrocarbon composition, energy characteristics, and impurity content must be considered jointly. This approach allows the requirements for preliminary gas purification prior to transportation and gas-chemical processing, including processes for producing organic products, to be assessed more reliably.
4. Conclusions
The comparative analysis demonstrated that the technological properties of gas supplied to the investigated GGSs cannot be evaluated solely from methane content. The contribution of C2+ hydrocarbons and the presence of non-combustible components must also be considered. The strong linear relationships between C2+ content and both higher heating value and higher Wobbe index confirm the importance of heavier hydrocarbons in determining gas energy performance.
The results support differentiated treatment strategies for individual GGS streams. Gas enriched in C2S+ hydrocarbons requires closer hydrocarbon-dew-point control and evaluation of the potential recovery of heavier hydrocarbon components. Methane-rich gas containing elevated carbon dioxide should be assessed for carbon dioxide removal or blending according to the required commercial-gas specifications.
Mercury-removal capacity should be selected using both the inlet mercury concentration and the calculated daily mercury load. The high-pressure gas from the Kuyi Sharki Berdak GGS requires particular attention because it produced the highest daily mercury load, whereas the medium-pressure stream from the same GGS had the highest inlet mercury concentration. The West Kuyi Surgil GGS should receive priority in hydrogen sulfide monitoring and removal because it had the highest hydrogen sulfide concentration and volumetric load among the selected sites.
Thus, GGS-specific decisions on hydrocarbon-dew-point control, acid-gas removal, mercury sorption, and stream blending should be based on the combined assessment of gas composition, energy characteristics, impurity concentration, and gas flow rate. Because quantitative estimates of measurement uncertainty were unavailable, the identified priorities are intended for comparative ranking and may be refined through routine repeated measurements at the corresponding GGSs before final process design.
Abbreviations
C1-C6+ | Hydrocarbons Ranging from Methane to Hexane and Heavier Components |
C2+ | Ethane and Heavier Hydrocarbons |
C6+ | Hexane and Heavier Hydrocarbons |
CO2 | Carbon Dioxide |
GGS | Gas Gathering Station |
GOST | Interstate Standard |
H2S | Hydrogen Sulfide |
Hg | Mercury |
N2 | Nitrogen |
ppm | Parts per Million |
Acknowledgments
The authors express their sincere gratitude to the management and specialists of the Institute of Geology and Exploration of Oil and Gas Fields, Tashkent, Uzbekistan, for providing the production and analytical data used in this study, as well as for their organizational and technical support.
Author Contributions
Makhbuba Abdullayevna Mirsagatova: Data curation, Investigation, Methodology, Resources, Validation
Munira Rustambekovna Sodikova: Conceptualization, Formal Analysis, Visualization, Writing – original draft, Writing – review & editing
Data Availability Statement
The data supporting the findings of this study are available from the corresponding author upon reasonable request and subject to permission from the Institute of Geology and Exploration of Oil and Gas Fields. The data are not publicly available because they are derived from internal production and analytical records.
Conflicts of Interest
The authors declare no conflicts of interest.
References
| [1] |
Abdullaev G. S., Bogdanov A. N., Eydel’nant N. K. Sovremennoe sostoyanie i perspektivy razvitiya geologorazvedochnykh rabot na neft’ i gaz v Ustyurtskom regione Respubliki Uzbekistan [Current state and development prospects of exploration activity for oil and gas in the Ustyurt region (Uzbekistan)]. Neftegazovaya Geologiya. Teoriya i Praktika. 2019; 14(1).
https://doi.org/10.17353/2070-5379/10_2019
(In Russian).
|
| [2] |
Bogdanov A. N., Khmyrov P. V., Abduraimov M. Kh., Tukhtaev R. R. Dinamika zapasov i dobychi uglevodorodnogo syr’ya Ustyurtskogo regiona [Dynamics of reserves and production of hydrocarbons in the Ustyurt region]. Neftegazovaya Geologiya. Teoriya i Praktika. 2023; 18(2).
https://doi.org/10.17353/2070-5379/13_2023
(In Russian).
|
| [3] |
Ferreiro B., Andrade J. M., López-Mahía P., Muniategui-Lorenzo S., Vázquez C., Pérez A., Rey M., Vales C. Fast quality control of natural gas for commercial supply and transport utilities. Fuel. 2021; 305: 121500.
https://doi.org/10.1016/j.fuel.2021.121500
|
| [4] |
Ulbig P., Hoburg D. Determination of the calorific value of natural gas by different methods. Thermochimica Acta. 2002; 382(1–2): 27–35.
https://doi.org/10.1016/S0040-6031(01)0732-8
|
| [5] |
Sandfort V., Trabold B. M., Abdolvand A., Bolwien C., Russell P. St. J., Wöllenstein J., Palzer S. Monitoring the Wobbe index of natural gas using fiber-enhanced Raman spectroscopy. Sensors. 2017; 17(12): 2714.
https://doi.org/10.3390/s17122714
|
| [6] |
Kuczyński S., Łaciak M., Szurlej A., Włodek T. Impact of liquefied natural gas composition changes on methane number as a fuel quality requirement. Energies. 2020; 13(19): 5060.
https://doi.org/10.3390/en13195060
|
| [7] |
Farooqi A. S., Ramli R. M., Lock S. S. M., Farooqi A. S., Shahid M. Z., Hasnain S. M. W. U., Hira N. E., Abdullah B. Removal of carbon dioxide and hydrogen sulfide from natural gas using a hybrid solvent of monoethanolamine and N-methyl-2-pyrrolidone. ACS Omega. 2024; 9(24): 25704–25714.
https://doi.org/10.1021/acsomega.3c09100
|
| [8] |
Ezzeldin M. F., Gajdosechova Z., Masod M. B., Zaki T., Feldmann J., Krupp E. M. Mercury speciation and distribution in an Egyptian natural gas processing plant. Energy & Fuels. 2016; 30(12): 10236–10243.
https://doi.org/10.1021/acs.energyfuels.6b02035
|
| [9] |
Ortiz Restrepo S. A., Swiatek A., Ohligschläger A., Mohnke O., Thern H., Widerøe H. C., Dupuy P. M., Leknes Ø., Adams A. Quantitative composition analysis of natural gas by high-pressure proton low-field NMR spectroscopy: Development of an improved experimental methodology. Gas Science and Engineering. 2024; 128: 205377.
https://doi.org/10.1016/j.jgsce.2024.205377
|
| [10] |
Zhang Y., Wang Y., Wang H., Wang B., Chen H., Wu S., Bao W., Chang L., Wang S., Wang J. Cu incorporating into OMS-2 lattice creates an efficient Hg⁰ removal sorbent in natural gas with ambient-temperature H2S/H₂O tolerance. Chemical Engineering Journal. 2023; 478: 147452.
https://doi.org/10.1016/j.cej.2023.147452
|
| [11] |
Hong Q., Xu H., Ling C., Liu Z., Huang W., Yang S., Qu Z., Zhang L., Yan N. Low-coordinated polysulfide species on metal sulfide enabled superior gaseous mercury removal from natural gas. Environmental Science & Technology. 2025; 59(8) 4178–4187.
https://doi.org/10.1021/acs.est.4c10944
|
| [12] |
Ma L., Zhang Y., Liu A., Zhao Z., Wang L., Chang Y., Duan X., Gao P. The high removal efficiency of H2S by MDEA solution in high-jets oscillating purifier. ACS Omega. 2025; 10(37): 42815–42825.
https://doi.org/10.1021/acsomega.5c05157
|
| [13] |
Zhang C., Li A.-Z., Yuan B.-J., Liu X., Liu Y., Kong K., Shi Q., Zhang Y., Luo Y., Li S., Zhou H., Duan H. Electrochemical valorization of H2S in natural gas to sulfate under mild conditions. Nature Communications. 2025; 16: 7175.
https://doi.org/10.1038/s41467-025-62445-y
|
| [14] |
GOST 31371.1-2020 (ISO 6974-1: 2012). Natural gas—Determination of composition and associated uncertainty by gas chromatography—Part 1: General guidelines and calculation of composition.
|
| [15] |
GOST 31371.5-2022 (ISO 6974-5: 2014). Natural gas—Determination of composition and associated uncertainty by gas chromatography—Part 5: Isothermal method for nitrogen, carbon dioxide, C₁ to C₅ hydrocarbons and C6+ hydrocarbons.
|
| [16] |
GOST 31369-2021 (ISO 6976: 2016). Natural gas—Calculation of calorific values, density, relative density and Wobbe indices from composition.
|
Cite This Article
-
APA Style
Mirsagatova, M. A., Sodikova, M. R. (2026). Comparative Analysis of the Hydrocarbon Composition and Technological Characteristics of Gas from Fields in the Ustyurt Region. International Journal of Oil, Gas and Coal Engineering, 14(5), 117-126. https://doi.org/10.11648/j.ogce.20261405.12
 Copy
|
 Download
ACS Style
Mirsagatova, M. A.; Sodikova, M. R. Comparative Analysis of the Hydrocarbon Composition and Technological Characteristics of Gas from Fields in the Ustyurt Region. Int. J. Oil Gas Coal Eng. 2026, 14(5), 117-126. doi: 10.11648/j.ogce.20261405.12
Copy
|
Download
AMA Style
Mirsagatova MA, Sodikova MR. Comparative Analysis of the Hydrocarbon Composition and Technological Characteristics of Gas from Fields in the Ustyurt Region. Int J Oil Gas Coal Eng. 2026;14(5):117-126. doi: 10.11648/j.ogce.20261405.12
Copy
|
Download
-
@article{10.11648/j.ogce.20261405.12,
  author = {Makhbuba Abdullayevna Mirsagatova and Munira Rustambekovna Sodikova},
  title = {Comparative Analysis of the Hydrocarbon Composition and Technological Characteristics of Gas from Fields in the Ustyurt Region},
  journal = {International Journal of Oil, Gas and Coal Engineering},
  volume = {14},
  number = {5},
  pages = {117-126},
  doi = {10.11648/j.ogce.20261405.12},
  url = {https://doi.org/10.11648/j.ogce.20261405.12},
  eprint = {https://article.sciencepublishinggroup.com/pdf/10.11648.j.ogce.20261405.12},
  abstract = {Previous studies of natural gas from the Ustyurt region have focused mainly on geological characteristics or individual quality parameters, whereas integrated assessments linking hydrocarbon composition, energy performance, impurity concentrations, and flow-rate-based treatment loads at individual gas gathering stations (GGSs) remain limited. This study addressed this gap by comparing 15 sets of production and analytical data from GGSs at fields in the Ustyurt region. Seven gas streams were examined in detail using direct comparison, range analysis, and calculations of daily mercury and volumetric hydrogen sulfide loads. The principal contribution of the study is the combined assessment of gas composition, energy properties, and impurity loads under field operating conditions. Increasing C2+ hydrocarbon content was associated with higher gas density, molar mass, higher heating value, and Wobbe index. For the seven selected sites, linear relationships were obtained between C2+ content and both higher heating value (R2 = 0.9938) and Wobbe index (R2 = 0.9893). The gas with the highest methane content did not exhibit the highest energy value because of its low CS2+ content and comparatively high carbon dioxide concentration. The stream with the highest mercury concentration was not the stream with the greatest daily mercury load, demonstrating that impurity concentration must be evaluated together with gas flow rate. The results provide a basis for GGS-specific decisions on mercury and hydrogen sulfide removal, hydrocarbon dew-point control, stream blending, and feed preparation before transportation and downstream gas processing.},
 year = {2026}
}
Copy
|
Download
-
TY  - JOUR
T1  - Comparative Analysis of the Hydrocarbon Composition and Technological Characteristics of Gas from Fields in the Ustyurt Region
AU  - Makhbuba Abdullayevna Mirsagatova
AU  - Munira Rustambekovna Sodikova
Y1  - 2026/10/20
PY  - 2026
N1  - https://doi.org/10.11648/j.ogce.20261405.12
DO  - 10.11648/j.ogce.20261405.12
T2  - International Journal of Oil, Gas and Coal Engineering
JF  - International Journal of Oil, Gas and Coal Engineering
JO  - International Journal of Oil, Gas and Coal Engineering
SP  - 117
EP  - 126
PB  - Science Publishing Group
SN  - 2376-7677
UR  - https://doi.org/10.11648/j.ogce.20261405.12
AB  - Previous studies of natural gas from the Ustyurt region have focused mainly on geological characteristics or individual quality parameters, whereas integrated assessments linking hydrocarbon composition, energy performance, impurity concentrations, and flow-rate-based treatment loads at individual gas gathering stations (GGSs) remain limited. This study addressed this gap by comparing 15 sets of production and analytical data from GGSs at fields in the Ustyurt region. Seven gas streams were examined in detail using direct comparison, range analysis, and calculations of daily mercury and volumetric hydrogen sulfide loads. The principal contribution of the study is the combined assessment of gas composition, energy properties, and impurity loads under field operating conditions. Increasing C2+ hydrocarbon content was associated with higher gas density, molar mass, higher heating value, and Wobbe index. For the seven selected sites, linear relationships were obtained between C2+ content and both higher heating value (R2 = 0.9938) and Wobbe index (R2 = 0.9893). The gas with the highest methane content did not exhibit the highest energy value because of its low CS2+ content and comparatively high carbon dioxide concentration. The stream with the highest mercury concentration was not the stream with the greatest daily mercury load, demonstrating that impurity concentration must be evaluated together with gas flow rate. The results provide a basis for GGS-specific decisions on mercury and hydrogen sulfide removal, hydrocarbon dew-point control, stream blending, and feed preparation before transportation and downstream gas processing.
VL  - 14
IS  - 5
ER  -
Copy
|
Download







 Share This Article
 Twitter
 Linked In
 Facebook