1. Introduction
Petroleum continues to be the world's primary energy source, and as the number of new, easily accessible fields decreases and the world's energy demand rises, it is more crucial than ever to maximize recovery from existing reservoirs
. Only roughly 30-40% of the initial oil in a typical reservoir can be mobilized by conventional recovery methods, which include primary recovery (powered by natural reservoir energy such as solution-gas drive, gas-cap drive, and aquifer drive) and secondary recovery (usually water- or gas-flooding). Due to unfavorable rock wettability, reservoir heterogeneity, and high capillary forces resulting from the interfacial tension (IFT) between the residual oil and the displacing aqueous phase, the remaining 60-70% is trapped within the pore spaces of the reservoir rock
| [2] | Suman, Y. K., Shirif, E., Ibrahim, H., & Ala-Ktiwi, A. (2014). Investigating Improved Oil Recovery in Heavy Oil Reservoirs. World Journal of Engineering and Technology, 02(01), 23-31.
https://doi.org/10.4236/wjet.2014.21003 |
| [3] | Udoh, T., Akanji, L., & Vinogradov, J. (2018). Experimental investigation of potential of combined Controlled Salinity and Bio-Surfactant CSBS in Enhanced oil recovery EOR processes. SPE Nigeria Annual International Conference and Exhibition.
https://doi.org/10.2118/193388-ms |
[2, 3]
.
Tertiary recovery, also known as enhanced oil recovery (EOR), is the term used to describe a variety of methods designed to mobilize this residual oil after primary and secondary methods have reached their economic limit. EOR techniques can be broadly divided into three categories: thermal (such as steam flooding, in-situ combustion), gas miscible/immiscible injection (such as CO
2 flooding, nitrogen injection), and chemical (such as polymer flooding, alkaline flooding, surfactant flooding, and combinations thereof, such as alkaline-surfactant-polymer, ASP, flooding)
.
Surfactant flooding is one of the most widely studied chemical EOR techniques owing to its direct and well-known mechanism of action. Surfactants are amphiphilic molecules with a hydrophilic (water-loving) head group and a hydrophobic (oil-loving) tail, which adsorb at the oil-water interface and significantly reduce the interfacial tension between the two immiscible phases, often by several orders of magnitude
| [5] | Isaac, O. T., Pu, H., Oni, B. A., & Samson, F. A. (2022). Surfactants employed in conventional and unconventional reservoirs for enhanced oil recovery—A review. Energy Reports, 8, 2806-2830. https://doi.org/10.1016/j.egyr.2022.01.187 |
[5]
. The IFT reduction reduces the capillary pressure that traps residual oil in the pore throats and mobilizes oil droplets that would otherwise remain trapped. Surfactants can also change the wettability of reservoir rock from oil-wet or intermediate-wet to more strongly water-wet conditions, thereby improving the efficiency of the displacing fluid
| [6] | An, X., Zou, J., Zhang, J., Wang, R., Dong, J., Tan, X., Yuan, Y., & Yue, X. (2026). Interfacial Tension vs. Emulsification: Key Mechanisms in Surfactant Flooding of Low-Permeability Reservoirs. Energies, 19(5), 1208.
https://doi.org/10.3390/en19051208 |
[6]
.
Alkyl sulfonates, alkylbenzene sulfonates, and ethoxylated alcohols surfactants commonly used in chemical EOR operations are nearly entirely produced from feedstocks derived from petroleum. Despite the effectiveness of these synthetic surfactants, their production is expensive, reliant on a petrochemical feedstock that is both non-renewable and prone to price fluctuations, and frequently linked to poor biodegradability and potential ecotoxicity when produced water containing residual surfactant is released into the environment
| [7] | Cowan-Ellsberry, C., Belanger, S., Dorn, P., Dyer, S., McAvoy, D., Sanderson, H., Versteeg, D., Ferrer, D., & Stanton, K. (2013a). Environmental safety of the use of major surfactant classes in North America. Critical Reviews in Environmental Science and Technology, 44(17), 1893-1993.
https://doi.org/10.1080/10739149.2013.803777 |
[7]
. These issues have spurred increased research interest in bio-based or "green" surfactants made from renewable agricultural feedstocks like vegetable oils, which have the dual benefits of being readily available locally at a low cost and being biodegradable.
In transesterification, a triglyceride reacts with a short-chain alcohol such as methanol in the presence of an acid, base, or enzymatic catalyst to give fatty acid alkyl esters and glycerol. The reaction is industrially mature and best known for biodiesel production. Because of their amphiphilic nature, the fatty acid esters can be used as surface-active agents, either directly or after a functionalization step such as sulfonation that adds an anionic head group
| [7] | Cowan-Ellsberry, C., Belanger, S., Dorn, P., Dyer, S., McAvoy, D., Sanderson, H., Versteeg, D., Ferrer, D., & Stanton, K. (2013a). Environmental safety of the use of major surfactant classes in North America. Critical Reviews in Environmental Science and Technology, 44(17), 1893-1993.
https://doi.org/10.1080/10739149.2013.803777 |
[7]
. The route is relatively straightforward, scalable, uses readily available reagents, and accepts a variety of triglyceride-rich feedstocks
| [8] | Zhang, Q., Cai, B., Xu, W., Gang, H., Liu, J., Yang, S., & Mu, B. (2015). Novel zwitterionic surfactant derived from castor oil and its performance evaluation for oil recovery. Colloids and Surfaces a Physicochemical and Engineering Aspects, 483, 87-95. https://doi.org/10.1016/j.colsurfa.2015.05.060 |
[8]
.
Experimental work increasingly supports the transesterification-sulfonation route for converting plant oils into EOR surfactants. Elraies et al.
| [9] | Elraies, K. A., Tan, I. M., Awang, M., & Saaid, I. (2010). The synthesis and performance of sodium methyl ester sulfonate for enhanced oil recovery. Petroleum Science and Technology, 28(17), 1799-1806.
https://doi.org/10.1080/10916460903226072 |
[9]
synthesized sodium methyl ester sulfonate (SMES) from Jatropha curcas oil by one-step sulfonation, reducing the crude oil-water IFT to the range 18.4-3.92 mN/m with acceptable thermal stability at simulated reservoir temperature. Elraies
| [10] | Elraies, K. A. (2012). An experimental study on ASP process using a new polymeric surfactant. Journal of Petroleum Exploration and Production Technology, 2(4), 223-227.
https://doi.org/10.1007/s13202-012-0039-5 |
[10]
later produced an epoxidized methyl ester sulfonate and lowered IFT to 0.19 mN/m at 1 wt% with sodium carbonate, with core-flooding tests confirming incremental recovery over waterflooding. Temiloluwa et al.
| [11] | Temiloluwa, O., Tomiwa, O., & Babalola, O. (2020). Evaluating rheological properties and recovery performance of polymeric anionic surfactant (PSURFC) synthesized from non-edible seed oil on heavy crude recovery. Journal of Petroleum Exploration and Production Technology, 10(6), 2279-2292.
https://doi.org/10.1007/s13202-020-00916-2 |
[11]
combined a Nigerian non-edible seed-oil surfactant with xanthan gum, obtaining shear-thinning rheology and improved heavy-crude recovery. Wibowo et al.
| [12] | Wibowo, A. D. K., Tiani, P., Aditya, L., Handayani, A. S., & Christwardana, M. (2021). Synthesis and Characterization of Polymeric Surfactant from Palm Oil Methyl Ester and Vinyl Acetate for Chemical Flooding. REAKTOR, 21(2), 65-73.
https://doi.org/10.14710/reaktor.21.2.65-73 |
[12]
grafted palm-oil MES with vinyl acetate and obtained a critical micelle concentration of 0.5%, an IFT of 6.7 × 10⁻
3 mN/m, and a wettability shift of quartz from oil-wet to water-wet; in a follow-up, grafting with ethyl acrylate gave an IFT of 1.95 × 10⁻
3 mN/m and about 16.6% additional oil recovery in core flooding
| [13] | Wibowo, A. D. K., Megawati, R., Setyaningrum, V. K., Putri, E. W., Joelianingsih, Handayani, A. S., Solikhah, M. D., & Chafidz, A. (2023). Investigating potential application of bio-based polymeric surfactant using methyl ester from palm oil for chemical enhanced oil recovery (CEOR). Communications in Science and Technology, 8(2), 235-242.
https://doi.org/10.21924/cst.8.2.2023.1318 |
[13]
. Priyanto et al.
| [14] | Priyanto, S., Sudrajat, R. W., Suherman, S., Pramudono, B., Riyanto, T., Setianingrum, D. D., & Pratama, A. A. (2022). Synthesis and performance evaluation of polymeric surfactant from rice husk and polyethylene glycol for the enhanced oil recovery process. Chimica Techno Acta, 9(4).
https://doi.org/10.15826/chimtech.2022.9.4.06 |
[14]
showed that rice-husk lignosulfonate combined with polyethylene glycol can also serve as a functional polymeric EOR surfactant.
A recent review placed MES within ASP flooding as a green alternative to petroleum sulfonates
| [27] | Habib, S. H., Yunus, R., Zakaria, R., Biak, D. R. A., Jan, B. H. M., & Amir, Z. (2024). Chemical enhanced oil recovery: Synergetic mechanism of alkali, surfactant and polymer with overview of methyl ester sulfonate as a green alternative for EOR surfactant. Fuel, 363, 130957.
https://doi.org/10.1016/j.fuel.2024.130957 |
[27]
. Palm-oil MES has been reported to raise the laboratory-scale recovery factor to 68.8% and reduce residual oil saturation to 26.25%
| [28] | Ridaliani, O., Samsol, Setiati, R., Fathaddin, M. T., Anggela, L., Prima, A., Davy, N., & Yanti, W. (2025). Effects of palm-oil-based methyl ester sulfonate (MES) in laboratory-scale enhanced oil recovery process. Scientific Contributions Oil and Gas, 48(4), 51-59. https://doi.org/10.29017/scog.v48i4.1825 |
[28]
, and MES has been tested by spontaneous imbibition in sandstone under high salinity and temperature, where it remained effective
| [29] | Al Fikri, M. R., Putri, V. D. A., Gunawan, I., Rita, N., & Abdurrahman, M. (2025). Methyl ester sulfonate: An anionic biosurfactant for enhanced oil recovery in harsh condition. Scientific Contributions Oil and Gas, 48(1), 145-158.
https://doi.org/10.29017/scog.v48i1.1673 |
[29]
. Algae-derived MES has also been prepared and evaluated by surface tension measurements and core flooding
| [30] | Ogunyemi, A. T., Eluwa, T. D., Adeyi, A. A., Giwa, A., Igbafe, A. I., & Gbadamosi, A. O. (2024). Enhanced oil recovery using novel bio-based surfactant synthesized from algae. SPE Nigeria Annual International Conference and Exhibition, Lagos, 5-7 August 2024. https://doi.org/10.2118/221609-MS |
[30]
. For plain MES, the lowest surface tension reported in the studies discussed here is 25.09 mN/m, for an optimized used-cooking-oil-derived product
| [22] | Yusuff, A. S., Porwal, J., Bhonsle, A. K., Rawat, N., & Atray, N. (2021). Valorization of used cooking oil as a source of anionic surfactant fatty acid methyl ester sulfonate: process optimization and characterization studies. Biomass Conversion and Biorefinery, 13(10), 8903-8914.
https://doi.org/10.1007/s13399-021-01663-y |
[22]
.
These studies show a clear trade-off. The lowest IFT values (10⁻
3 mN/m) were obtained for palm-oil MES only after grafting with vinyl acetate or ethyl acrylate
| [12] | Wibowo, A. D. K., Tiani, P., Aditya, L., Handayani, A. S., & Christwardana, M. (2021). Synthesis and Characterization of Polymeric Surfactant from Palm Oil Methyl Ester and Vinyl Acetate for Chemical Flooding. REAKTOR, 21(2), 65-73.
https://doi.org/10.14710/reaktor.21.2.65-73 |
| [13] | Wibowo, A. D. K., Megawati, R., Setyaningrum, V. K., Putri, E. W., Joelianingsih, Handayani, A. S., Solikhah, M. D., & Chafidz, A. (2023). Investigating potential application of bio-based polymeric surfactant using methyl ester from palm oil for chemical enhanced oil recovery (CEOR). Communications in Science and Technology, 8(2), 235-242.
https://doi.org/10.21924/cst.8.2.2023.1318 |
[12, 13]
, and the value of 0.19 mN/m for Jatropha MES required epoxidation and sodium carbonate
| [10] | Elraies, K. A. (2012). An experimental study on ASP process using a new polymeric surfactant. Journal of Petroleum Exploration and Production Technology, 2(4), 223-227.
https://doi.org/10.1007/s13202-012-0039-5 |
[10]
, whereas plain Jatropha SMES gave IFT in the range 18.4-3.92 mN/m
| [9] | Elraies, K. A., Tan, I. M., Awang, M., & Saaid, I. (2010). The synthesis and performance of sodium methyl ester sulfonate for enhanced oil recovery. Petroleum Science and Technology, 28(17), 1799-1806.
https://doi.org/10.1080/10916460903226072 |
[9]
. Likewise, mobility control for a Nigerian seed-oil surfactant relied on blending with xanthan gum
| [11] | Temiloluwa, O., Tomiwa, O., & Babalola, O. (2020). Evaluating rheological properties and recovery performance of polymeric anionic surfactant (PSURFC) synthesized from non-edible seed oil on heavy crude recovery. Journal of Petroleum Exploration and Production Technology, 10(6), 2279-2292.
https://doi.org/10.1007/s13202-020-00916-2 |
[11]
, and lignosulfonate-based systems depend on polymer partners such as polyethylene glycol
| [14] | Priyanto, S., Sudrajat, R. W., Suherman, S., Pramudono, B., Riyanto, T., Setianingrum, D. D., & Pratama, A. A. (2022). Synthesis and performance evaluation of polymeric surfactant from rice husk and polyethylene glycol for the enhanced oil recovery process. Chimica Techno Acta, 9(4).
https://doi.org/10.15826/chimtech.2022.9.4.06 |
[14]
. These additions improve performance but add process steps, reagents, and cost relative to a plain MES.
Three limitations emerge from these studies. First, IFT values were measured against different crude oils, brines, and temperatures, so absolute values cannot be ranked across studies. Second, in the studies compared here, ultra-low IFT was mostly obtained after polymer grafting or with added alkali, which adds cost and process complexity relative to plain MES. Third, structure-performance relationships are seldom derived from feedstocks of contrasting composition under identical synthesis and test conditions, and leaf-derived lipids have not been considered as MES feedstocks. This is the gap the present study addresses.
The three feedstocks were chosen for availability and contrasting composition. Palm kernel oil (PKO) is a by-product of palm processing, abundant and cheap in Nigeria and other tropical regions, and is rich in the medium-chain lauric (C12) and myristic (C14) acids that give favorable surface activity and foaming. (PKO is edible, so it is used here as the benchmark rather than as a non-edible feedstock.) Neem is widely grown in Nigeria mainly for pesticidal and medicinal products, and Neem seed oil is dominated by C16-C18 acids, mainly oleic acid with stearic, palmitic, and linoleic acids
| [31] | Garg, R., Kant, R., Kumar, A., Tripathi, Y. C., & Bisht, S. S. (2024). Variability for morphological traits, oil and chemical constituents content in Azadirachta indica A. Juss. (Neem) seeds. Indian Forester, 150(1), 40-45.
https://doi.org/10.36808/if/2024/v150i1/169777 |
[31]
. Aloe vera is cultivated mainly for its gel, so the leaf material is a potential processing residue, and its lipid fraction is poorly documented as a surfactant feedstock. Compared with seed oils such as Jatropha and castor, leaf oils are not expected to match oil yield; their case rests on low-cost local availability, low competing demand, and compositions different from PKO, and this is tested quantitatively through the mass balance in Section 3.13.
This study therefore (i) extracts and characterizes the three oils, (ii) converts them to MES by a common transesterification-sulfonation route, (iii) compares the products by FTIR, surface tension, CMC, and foam stability, and (iv) relates surfactant performance to feedstock composition and quantifies the feedstock and reagent demand per unit of surfactant.
2. Materials and Methods
2.1. Materials
Palm kernel nuts, fresh Aloe vera leaves, and fresh Neem leaves were sourced locally. All feedstock materials were sorted to remove damaged or diseased material, washed thoroughly with distilled water to remove surface debris, and air-dried prior to further processing
| [33] | Adepoju, T., Job, A. I., & Isotuk, U. R. (2016). Optimization of Biohydrogen Production (BHP) from Agro Waste Water (Cassava Waste Water): A Case of Box-Behnken Response Surface Methodology (RSM). International Journal of Energy and Environmental Science, 1(1), 13.
https://doi.org/10.11648/j.ijees.20160101.13 |
[33]
.
The following analytical-grade chemicals and reagents were used: n-hexane (extraction solvent); anhydrous methanol and sodium hydroxide (transesterification catalyst system); concentrated sulfuric acid and sodium metabisulfite (sulfonation reagents); anhydrous sodium sulfate (drying agent); potassium hydroxide-ethanol solution and phenolphthalein indicator (acid value and saponification value titrations); Wijs solution (iodine value determination); sodium thiosulfate and starch indicator; standard brine formulated to a target reservoir salinity; and crude oil obtained from a cooperating source, used for interfacial tension and flooding studies.
The following equipment was used: Soxhlet extraction apparatus, rotary evaporator, analytical weighing balance, three-necked round-bottom flask fitted with a reflux condenser, magnetic stirrer hotplate with thermocouple control, separating funnels, oven, muffle furnace, pH meter, Fourier-transform infrared (FTIR) spectrometer, Du Noüy ring/Wilhelmy plate tensiometer, spinning-drop tensiometer, conductivity meter, goniometer, and a laboratory-scale sand-pack flooding rig comprising a cylindrical core holder, positive-displacement pump, pressure transducers, and a graduated fluid-collection system.
2.2. Extraction of Oils from the Feedstock Materials
Cleaned palm kernel nuts were cracked to recover the kernels, oven-dried at 60°C to constant weight, and milled into a fine paste. The milled kernel was packed into a thimble and Soxhlet-extracted with n-hexane at the solvent's boiling point for 6-8 h. The resulting oil-solvent miscella was concentrated by rotary evaporation under reduced pressure to recover crude palm kernel oil (PKO), which was stored in an amber bottle under refrigeration prior to further use.
Fresh Aloe vera leaves were filleted to separate the mucilaginous gel and inner leaf material from the outer rind. The collected material was oven-dried at a controlled low temperature (40-45°C) to minimize thermal degradation of bioactive constituents, then milled to a fine powder. The dried powder was Soxhlet-extracted with n-hexane under the conditions described above, and the extract concentrated by rotary evaporation to yield crude Aloe vera oil.
Figure 1. Preparation of Aloe vera oil.
Figure 2. Preparation of Neem leaf oil.
Fresh Neem leaves were air-dried under shade to preserve thermolabile constituents, then oven-dried at 40-45°C and milled into a fine powder. The powdered leaves were Soxhlet-extracted with n-hexane, and the resulting miscella concentrated by rotary evaporation to yield crude Neem leaf oil. All three crude oils were subsequently degummed and filtered prior to physicochemical characterization and transesterification.
2.3. Physicochemical Characterization of the Extracted Oils
Each of the three extracted oils (PKO, Aloe vera oil, and Neem oil) was characterized for acid value and free fatty acid content (titration against standardized ethanolic KOH, with phenolphthalein indicator), saponification value (reflux with ethanolic KOH followed by back-titration with standardized HCl), iodine value (Wijs method), density (pycnometry at 25°C), and kinematic viscosity (capillary viscometry at 40°C), following standard AOCS/AOAC titrimetric protocols. These parameters characterize the fatty acid profile and general quality of each oil and inform the stoichiometry of the subsequent transesterification reaction
| [32] | Abel, U., Ekanem, O., Oseribho, O., Isotuk, U., Job, A., & Ibanga, I. (2024). Enhanced Hydrophobicity and Oleo-philicity of Modified Activated Carbons Derived from Agro-Wastes Biomass for the Removal of Crude Oil from Aqueous Medium. American Journal of Chemical Engineering, 12(4), 80-96.
https://doi.org/10.11648/j.ajche.20241204.11 |
| [34] | Isotuk, U. R., Uloma, A. C., & Paul, A. A. (2026). Production, characterization and performance evaluation of mod-ified crab shell chitosan for sustainable coagulation of abattoir wastewater. Chemical Science International Jour-nal, 35(4), 171-195. https://doi.org/10.9734/csji/2026/v35i41050 |
[32, 34]
.
2.4. Synthesis of the Methyl Ester Sulfonate (MES) Surfactants
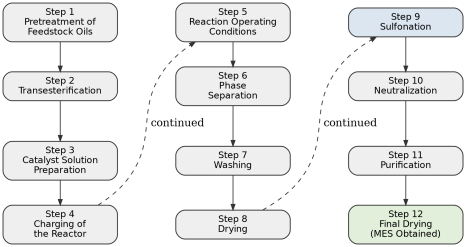
The MES surfactant was synthesized from each of the three feedstock oils (PKO, Aloe vera oil, and Neem oil) via a sequential route comprising pretreatment, base-catalyzed transesterification, phase separation and purification, sulfonation, and neutralization. The overall process flow is summarized in
Figure 3.
Figure 3. Process flow diagram for the synthesis of PKO-, Aloe vera-, and Neem-derived MES surfactants.
2.4.1. Pretreatment of the Feedstock Oils
Each of the three oils was filtered separately to remove suspended particles, heated to 70°C for 30 min, and then cooled to 55°C to remove residual moisture and impurities prior to reaction.
2.4.2. Base-Catalyzed Transesterification
The triglycerides in each pretreated oil were converted to their corresponding methyl esters by reaction with methanol in the presence of a base catalyst, according to Eq. (
1):
Triglyceride + 3CH3OH →(catalyst)→ 3 R-COOCH3(methyl ester) + Glycerol(1)
The catalyst solution was prepared by dissolving 2 g of NaOH in 50 mL of methanol under stirring until fully dissolved, forming sodium methoxide. Separately, 100 mL of each oil (PKO, Neem oil, or Aloe vera oil) was charged to a three-necked reactor flask, and the sodium methoxide solution was added slowly with stirring. The reaction was carried out under reflux at the fixed conditions summarized in
Table 1.
Table 1. Transesterification reaction conditions.
Parameter | Value |
Temperature | 70°C |
Stirring speed | 400-600 rpm |
Reaction time | 1 h |
Condition | Maintained under reflux |
On completion, the reaction mixture was transferred to a separating funnel and allowed to settle for 12 h, yielding an upper methyl ester layer and a lower glycerol layer. The methyl ester layer was washed twice with warm water to remove residual catalyst and soap impurities, then dried at 70°C for 20 min to obtain the PKO, Neem, and Aloe vera methyl esters used in the subsequent sulfonation step.
2.4.3. Sulfonation of the Methyl Esters
Sulfonation, the key step in generating the anionic surfactant head group, was carried out in a three-necked flask fitted with a mechanical stirrer, thermometer, and reflux condenser, following Eq. (
2):
R-COOCH3+ NaHSO3→ R-CH(SO3H)-COOCH3(2)
where R represents the fatty acid chain of the parent triglyceride. For each feedstock, 45 mL of the corresponding methyl ester was charged into the reactor and heated to 70°C, after which 22 g of sodium bisulfite was added slowly, followed by 0.65 g of CaO catalyst, under the conditions summarized in
Table 2. Reaction progress was monitored qualitatively by an increase in solution viscosity and a slight colour change, yielding the acidic methyl ester sulfonate.
Table 2. Sulfonation reaction conditions.
Parameter | Value |
Temperature | 70°C |
Reaction time | 4 h 30 min |
Stirring | Continuous |
2.4.4. Neutralization and Purification
The acidic methyl ester sulfonate was neutralized to its sodium salt form by the slow addition of 2.5 g NaOH solution under continuous stirring for 30 min, maintaining the pH between 7 and 8, to yield the MES surfactant from each of the three feedstocks (PKO-MES, Neem-MES, and Aloe vera-MES). The neutralized product was purified by washing with warm distilled water to remove residual salts, followed by vacuum filtration, and was finally dried at 70°C for 4 h to obtain the finished MES surfactant.
2.5. Characterization of the Synthesized Surfactants
2.5.1. Structural Characterization
The functional groups present in each synthesized surfactant, in particular the sulfonate (-SO3) and ester (-C=O) groups, were confirmed by Fourier-transform infrared (FTIR) spectroscopy over the wavenumber range 4000-400 cm⁻1. The resulting spectra were compared against the corresponding unmodified fatty acid methyl ester (FAME) and crude oil spectra to confirm successful functionalization at each reaction stage.
2.5.2. Critical Micelle Concentration (CMC)
The CMC of each surfactant was determined from a series of aqueous surfactant solutions of increasing concentration by measuring either electrical conductivity or surface tension as a function of concentration. The CMC was taken as the concentration corresponding to the inflection point (break in slope) of the property-versus-concentration curve, beyond which surfactant monomers self-assemble into micelles and the measured property plateaus.
2.5.3. Surface and Interfacial Tension
The surface tension of aqueous surfactant solutions was measured using a Du Noüy ring or Wilhelmy plate tensiometer at 25°C. The interfacial tension between each surfactant solution and crude oil, of direct relevance to EOR performance, was measured using a spinning-drop tensiometer capable of resolving the ultra-low IFT values (of the order of 10⁻2 to 10⁻3 mN/m) typically targeted for effective EOR surfactant formulations.
2.5.4. Hydrophilic-Lipophilic Balance, Cloud Point, and Foam Stability
The hydrophilic-lipophilic balance (HLB) of each surfactant was estimated using standard group-contribution methods based on molecular structure. Cloud point was determined by gradually heating an aqueous surfactant solution and recording the temperature at which the solution first became visibly turbid. Foam stability was assessed by the Ross-Miles or shake-test method, recording the initial foam height and its decay over a fixed time interval. Foam stability is reported as the foam height after 5 min as a percentage of the initial height.
2.6. Mass Balance
Feedstock and reagent demand per gram of MES were calculated directly from the measured masses and yields reported and the reagent quantities. Overall MES yield per gram of feedstock was calculated as the product of oil yield, methyl ester recovery per gram of oil, and MES yield from methyl ester. Energy use, life-cycle impacts, and costs were not measured.
3. Results and Discussion
3.1. Extraction Yield of Feedstock Oils
Table 3 presents the extraction performance of the three selected feedstocks. Palm kernel recorded the highest oil yield (47.30 ± 0.12%), whereas Aloe vera and Neem leaves produced considerably lower yields of 5.74 ± 0.11% and 8.58 ± 0.11%, respectively. The relatively small standard deviations indicate good repeatability among the extraction replicates.
Table 3. Extraction yield of the feedstock oils.
Feedstock | Initial feedstock mass (g) | Extracted oil mass (g) | Oil yield, mean ± SD (%) |
Palm kernel | 500 | 236.5 | 47.30 ± 0.12 |
Aloe vera | 500 | 28.7 | 5.74 ± 0.11 |
Neem leaves | 500 | 42.9 | 8.58 ± 0.11 |
The palm kernel oil (PKO) yield obtained in this study was higher than the 39.53 ± 2.2% reported for Soxhlet-extracted palm kernel oil by Sitepu et al.
| [15] | Sitepu, E., Candra, A., Zaidar, E., Vika, A., Sebayang, F., Dewi, Karo-Karo, J., & Tarigan, J. (2022). GREEN SOLVENT ENHANCED MECHANICAL EXTRACTION OF PALM KERNEL OIL. RASAYAN Journal of Chemistry, 15(02), 1063-1070.
https://doi.org/10.31788/rjc.2022.1526783 |
[15]
, and also exceeded the 45.51 ± 1.10% reported for palm kernel oil intended for soap production
| [16] | Jacob, A. G., Musa, I., & Ogbesejana, A. B. (2024). Extraction, FTIR and GC-MS characterization of palm kernel oil for laundry soap production. Scientia Africana, 23(3), 185-196.
https://doi.org/10.4314/sa.v23i3.18 |
[16]
. The comparatively higher yield obtained here may be attributed to the extended 6-8 h extraction period, the fineness of the milled kernel paste, and thorough oven-drying prior to extraction, all of which favour more complete solvent penetration and lipid recovery.
The Aloe vera oil yield (5.74 ± 0.11%) was markedly lower than the 12.3% reported for Soxhlet-extracted Aloe ferox seed oil. This difference is attributable to feedstock type: the present study extracted oil from the leaf/mucilage-derived material rather than from Aloe seeds, and seed tissue is inherently richer in storage lipids than leaf parenchyma, which is dominated by polysaccharide-rich mucilage rather than triglycerides. The low yield therefore reflects the intrinsically low lipid content of the Aloe vera leaf material used, rather than an inefficiency in the extraction procedure.
The Neem leaf oil yield (8.58 ± 0.11%) was considerably lower than the 23-49% range typically reported for Neem seed oil Awolu
| [17] | Awolu, O. (2013). Optimization of Solvent Extraction of Oil from Neem (Azadirachta indica) and Its Characterizations. Journal of Scientific Research and Reports, 2(1), 304-314.
https://doi.org/10.9734/jsrr/2013/3705 |
[17]
, Hamadou
| [18] | Hamadou, B., Djomdi, Falama, R. Z., Delattre, C., Pierre, G., Dubessay, P., & Michaud, P. (2020). Influence of Physicochemical Characteristics of Neem Seeds (Azadirachta indica A. Juss) on Biodiesel Production. Biomolecules, 10(4), 616.
https://doi.org/10.3390/biom10040616 |
[18]
and also lower than the 37.73% previously reported specifically for Neem leaf oil extracted under more vigorous drying conditions. Since seeds accumulate storage lipids at much higher density than leaves, the use of leaf material as feedstock inherently limits the attainable yield. In addition, the mild 40-45°C drying temperature adopted in this work, intended to preserve thermolabile bioactive constituents, may have limited cell-wall rupture and hence oil release compared with more aggressive drying regimes used in the literature, indicating a yield-quality trade-off in the pretreatment step.
3.2. Physicochemical Properties of the Extracted Oils
Table 4 summarizes the principal physicochemical properties of the extracted oils, including acid value, free fatty acid content, saponification value, iodine value, density, and viscosity. The results indicate differences in the chemical characteristics of the feedstock oils, particularly in their degree of unsaturation and free fatty acid content, which may influence subsequent transesterification and sulfonation.
Table 4. Physicochemical properties of the extracted oils.
Property | Palm kernel oil | Aloe vera oil | Neem oil |
Acid value (mg KOH/g) | 4.82 ± 0.14 | 7.36 ± 0.21 | 6.48 ± 0.18 |
Free fatty acid (%) | 2.41 ± 0.07 | 3.68 ± 0.11 | 3.24 ± 0.09 |
Saponification value (mg KOH/g) | 196.8 ± 2.1 | 184.6 ± 2.4 | 188.9 ± 2.2 |
Iodine value (g I2/100 g) | 18.7 ± 0.6 | 74.3 ± 1.2 | 69.8 ± 1.1 |
Density at 25°C (g/cm3) | 0.918 ± 0.003 | 0.921 ± 0.004 | 0.925 ± 0.003 |
Kinematic viscosity at 40°C (mm2/s) | 28.6 ± 0.7 | 34.2 ± 0.9 | 41.7 ± 1.0 |
The low iodine value of PKO (18.7 ± 0.6 g I
2/100 g) confirms its highly saturated character and is consistent with the 14.72-18.7 g I
2/100 g range reported in the literature for palm kernel oil, which is dominated by lauric acid
| [16] | Jacob, A. G., Musa, I., & Ogbesejana, A. B. (2024). Extraction, FTIR and GC-MS characterization of palm kernel oil for laundry soap production. Scientia Africana, 23(3), 185-196.
https://doi.org/10.4314/sa.v23i3.18 |
[16]
. The acid value (4.82 ± 0.14 mg KOH/g) was moderately higher than the 1.06-3.25 mg KOH/g reported elsewhere, a variation commonly attributed to differences in kernel freshness, storage duration, and moisture exposure prior to extraction.
Aloe vera oil exhibited the highest iodine value (74.3 ± 1.2 g I2/100 g) and the highest acid value (7.36 ± 0.21 mg KOH/g) among the three oils, reflecting a higher degree of unsaturation and free fatty acid content. This trend is directionally consistent with reports of high acid values (51.5 mg KOH/g) in Aloe ferox seed oil, although the present leaf-derived oil showed substantially lower acidity, likely owing to differences in tissue type and reduced oxidative exposure during processing.
The Neem oil acid value (6.48 ± 0.18 mg KOH/g) and iodine value (69.8 ± 1.1 g I
2/100 g) fell closely within the ranges reported by Hundi̇e et al.
| [19] | Hundi̇e, K. B., Abdi̇ssa, D., & Bayu, A. B. (2022). Extraction, optimization, and characterization of neem seed oil via Box-Behnken Design approach. Journal of the Turkish Chemical Society Section a Chemistry, 9(2), 513-526.
https://doi.org/10.18596/jotcsa.1039997 |
[19]
, Neem seed oil from comparable geographic sources (acid value 4.80-6.37 mg KOH/g; iodine value 63.81-93.09 g I
2/100 g), confirming that the extracted Neem oil is compositionally consistent with previously characterized Neem oil samples. The relatively higher free fatty acid contents of the Aloe vera and Neem oils compared with PKO are significant because elevated free fatty acid content is known to promote saponification side reactions during base-catalyzed transesterification, a factor examined further in Section 3.3.
3.3. Methyl Ester Production and Conversion
Table 5 presents the methyl ester yield and conversion obtained from the extracted oils. Palm kernel oil produced the highest methyl ester yield and conversion, while Neem oil exhibited the lowest conversion. The results demonstrate that all three feedstocks can be successfully converted to methyl esters for subsequent MES synthesis.
Table 5. Methyl ester yield and conversion.
Feedstock oil | Oil charged (mL) | Oil charged (g) | Methyl ester recovered (g) | Methyl ester yield (%) | Conversion (%) |
Palm kernel oil | 100 | 91.80 | 82.01 | 89.34 | 92.10 |
Aloe vera oil | 100 | 92.10 | 79.89 | 86.75 | 89.70 |
Neem oil | 100 | 92.50 | 78.53 | 84.90 | 87.60 |
Palm kernel oil produced the highest methyl ester yield (89.34%) and conversion (92.10%), consistent with its lowest free fatty acid content (2.41%) among the three feedstocks. This agrees with the well-established principle in biodiesel literature that free fatty acid levels above approximately 1-2% promote saponification during alkali-catalyzed transesterification, consuming catalyst and reducing ester yield. Hamadou et al.
| [18] | Hamadou, B., Djomdi, Falama, R. Z., Delattre, C., Pierre, G., Dubessay, P., & Michaud, P. (2020). Influence of Physicochemical Characteristics of Neem Seeds (Azadirachta indica A. Juss) on Biodiesel Production. Biomolecules, 10(4), 616.
https://doi.org/10.3390/biom10040616 |
[18]
similarly identified high free fatty acid content in Neem seed oil as a major drawback limiting biodiesel yield to an average of 89.02%, and recommended a deacidification step to improve conversion, a finding that mirrors the comparatively lower yields obtained here for the higher-acid-value Aloe vera oil (86.75% yield, 89.70% conversion) and Neem oil (84.90% yield, 87.60% conversion).
3.3.1. Synthesis Yield of Methyl Ester Sulfonate
Table 6 shows the yield of MES obtained following sulfonation and subsequent processing of the methyl esters. PKO-MES exhibited the highest synthesis yield (86.4%), followed by Aloe-MES (83.7%) and Neem-MES (81.5%). The observed differences may be associated with variations in the fatty-acid composition of the precursor methyl esters.
Table 6. Yield of synthesized methyl ester sulfonate (MES).
MES sample | ME charged (mL) | ME mass charged (g) | MES obtained (g) | MES yield (%) | Appearance |
PKO-MES | 45 | 36.9 | 31.88 | 86.4 | Pale yellow viscous paste |
Aloe-MES | 45 | 37.1 | 31.05 | 83.7 | Light amber viscous liquid |
Neem-MES | 45 | 37.3 | 30.40 | 81.5 | Dark amber viscous liquid |
The PKO-MES yield of 86.4% obtained via NaHSO
3/CaO-catalyzed thermal sulfonation falls within the upper range of yields reported for methyl ester sulfonate synthesis using sodium bisulfite as the sulfonating agent, which have been reported between 79.4% and 88.2% depending on catalyst and reaction conditions
| [20] | Deli, N. A., Hariani, R., & Nasution, R. S. (2025). Synthesis of Methyl Ester Sulfonate from Crude Palm Oil Based on Aluminum Oxide Catalyst. Journal of Engineering Science and Technology Management (JES-TM), 5(1), 75-80.
https://doi.org/10.31004/jestm.v5i1.237 |
[20]
. It is also considerably higher than the 48.06% yield reported by Qadariyah et al.
| [21] | Qadariyah, L., Sahila, S., & Mahfud, M. (2021). The Effect of Reaction Time and Temperature on the Synthesis of Methyl Ester Sulfonate Surfactant from Palm Oil as a Feedstock using Microwave-Assisted Heating. ASEAN Journal of Chemical Engineering, 21(1), 104. https://doi.org/10.22146/ajche.63786 |
[21]
a microwave-assisted palm oil MES synthesis, suggesting that the longer 4.5 h thermal sulfonation period used in the present work allowed more complete conversion of methyl ester to sulfonate than the shorter microwave-assisted protocols reported elsewhere.
The comparatively lower yields obtained for Aloe-MES (83.7%) and Neem-MES (81.5%) mirror the differences already observed in their precursor methyl esters and are consistent with Yusuf et al
| [22] | Yusuff, A. S., Porwal, J., Bhonsle, A. K., Rawat, N., & Atray, N. (2021). Valorization of used cooking oil as a source of anionic surfactant fatty acid methyl ester sulfonate: process optimization and characterization studies. Biomass Conversion and Biorefinery, 13(10), 8903-8914.
https://doi.org/10.1007/s13399-021-01663-y |
[22]
that the fatty acid composition and purity of the methyl ester feedstock directly influence sulfonation efficiency and final MES yield.
3.3.2. Neutralization and pH Characteristics of MES
Table 7 demonstrates the effectiveness of the neutralization step. The acidic products obtained after sulfonation were adjusted to near-neutral conditions, with final pH values of 7-8, indicating adequate removal or neutralization of residual acidic species.
Table 7. PH of synthesized MES before and after neutralization.
Sample | pH after sulfonation | pH after neutralization |
PKO-MES | 3.0 | 7.0 |
Neem-MES | 5.0 | 8.0 |
Aloe-MES | 2.0 | 7.0 |
The strongly acidic pH values recorded immediately after sulfonation (2.0-5.0) are consistent with the expected formation of sulfonic acid groups during the reaction. Following neutralization, all three samples were brought within the pH 7-8 range, matching the pH window commonly targeted in industrial MES formulations; for example, C16 MES/LABSA detergent powder blends have been reported to be maintained at pH 7-8 during pilot-scale production. This agreement confirms that the neutralization step was effective in converting the acidic intermediate into a stable, application-ready sodium salt form.
3.3.3. Physical Characteristics of Synthesized MES
Table 8 summarizes the observable physical characteristics of the synthesized MES samples. All products exhibited viscous characteristics and appreciable water solubility, while differences in colour, foamability, and solubility were observed among the feedstocks.
Table 8. Physical characteristics of the synthesized MES.
Property | PKO-MES | Neem-MES | Aloe-MES |
Appearance | Pale yellow paste | Dark amber viscous liquid | Light amber viscous liquid |
Final pH | 7 | 8 | 7 |
Water solubility | High | Moderate | High |
Foamability | High | Moderate | Moderate |
Biodegradability | Excellent | Excellent | Excellent |
The high water solubility and excellent biodegradability recorded for all three MES samples are consistent with the well-documented profile of methyl ester sulfonates in the literature, which are widely reported to combine good aqueous solubility with high biodegradability and low skin irritation relative to petroleum-derived anionic surfactants. Industrial-scale palm-based MES detergent powders have similarly been reported to biodegrade to the 60% pass level within 13-14 days, well within regulatory biodegradability thresholds. The colour differences observed among the samples, pale yellow for PKO-MES versus dark amber for Neem-MES, are attributable to the natural pigment content (e.g., chlorophyll and carotenoid residues) of the respective parent oils carrying over into the unrefined surfactant product, a characteristic commonly noted for unrefined plant-oil-derived surfactants.
3.4. Physicochemical Properties of Synthesized MES
Table 9 presents the major physicochemical properties of the synthesized MES products. The density, viscosity, acid value, saponification value, and conductivity varied among the samples, reflecting differences in their molecular composition and degree of sulfonation.
Table 9. Physicochemical properties of the synthesized MES.
Parameter | PKO-MES | Neem-MES | Aloe-MES |
Acid value (mg KOH/g) | 3.82 ± 0.12 | 5.64 ± 0.17 | 4.76 ± 0.15 |
Saponification value (mg KOH/g) | 194.6 ± 2.1 | 187.3 ± 2.4 | 190.8 ± 2.2 |
Density at 25°C (g/cm3) | 0.926 ± 0.003 | 0.934 ± 0.004 | 0.929 ± 0.003 |
Kinematic viscosity at 40°C (mm2/s) | 31.6 ± 0.8 | 38.4 ± 0.9 | 34.7 ± 0.8 |
Conductivity (µS/cm) | 428 ± 12 | 396 ± 14 | 415 ± 11 |
A general increase in kinematic viscosity was observed after sulfonation relative to the parent oils (e.g., PKO: 28.6 → 31.6 mm
2/s), consistent with the introduction of the polar sulfonate group increasing intermolecular association within the surfactant, a trend similarly reported during sulfonation-time studies of virgin-coconut-oil-derived MES, where viscosity was observed to rise progressively with sulfonation progress. The measured conductivities (396-428 µS/cm) reflect the ionic character of the sodium sulfonate head group and are consistent with reports that the conductivity of methyl ester sulfonate solutions increases with the concentration of dissociated Na⁺ ions (a castor-oil-derived sodium methyl ester sulfonate study for enhanced oil recovery, (Babu et al,
| [26] | Babu, K., Maurya, N. K., Mandal, A., & Saxena, V. K. (2015). Synthesis and characterization o f sodium methyl ester sulfonate for chemically-enhanced oil recovery. Brazilian Journal of Chemical Engineering, 32(3), 795-803.
https://doi.org/10.1590/0104-6632.20150323s00003642 |
[26]
.
3.4.1. Surface-Tension Behaviour of MES
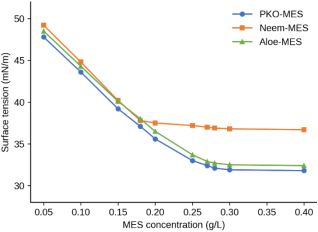
Table 10 shows the variation of surface tension with MES concentration. Surface tension decreased progressively as the concentration increased, indicating increasing adsorption of the surfactant molecules at the air-liquid interface. Beyond the critical micelle concentration, the reduction became relatively small (
Figure 4).
Table 10. Surface tension of MES solutions at different concentrations.
MES concentration (g/L) | PKO-MES (mN/m) | Neem-MES (mN/m) | Aloe-MES (mN/m) |
0.05 | 47.8 | 49.2 | 48.5 |
0.10 | 43.6 | 44.8 | 44.3 |
0.15 | 39.2 | 40.2 | 40.1 |
0.18 | 37.1 | 37.8 | 38.0 |
0.20 | 35.6 | 37.5 | 36.5 |
0.25 | 33.0 | 37.2 | 33.7 |
0.27 | 32.4 | 37.0 | 32.9 |
0.28 | 32.1 | 36.9 | 32.7 |
0.30 | 31.9 | 36.8 | 32.5 |
0.40 | 31.8 | 36.7 | 32.4 |
Figure 4. Surface tension of MES solutions at different concentrations.
The progressive decline in surface tension with increasing MES concentration, followed by a plateau beyond the critical micelle concentration, is the classical adsorption-controlled behaviour widely reported for anionic surfactants at the air-liquid interface, luan et al.
| [23] | Luan, H., Gong, L., Yue, X., Nie, X., Chen, Q., Guan, D., Que, T., Liao, G., Su, X., & Feng, Y. (2019). Micellar aggregation behavior of alkylaryl sulfonate surfactants for enhanced oil recovery. Molecules, 24(23), 4325.
https://doi.org/10.3390/molecules24234325 |
[23]
study on the micellar aggregation behaviour of alkylaryl sulfonate EOR surfactants, the minimum surface tension values achieved in this study, 31.8 mN/m for PKO-MES and 32.4 mN/m for Aloe-MES, compare favourably with several literature benchmarks for methyl ester sulfonate surfactants, including 38.4 mN/m for a castor-oil-derived sodium methyl ester sulfonate and 48.06% mN/m for a microwave-assisted palm oil MES, although they remain higher (less effective) than the 25.09 mN/m reported for an optimized used-cooking-oil-derived MES
| [22] | Yusuff, A. S., Porwal, J., Bhonsle, A. K., Rawat, N., & Atray, N. (2021). Valorization of used cooking oil as a source of anionic surfactant fatty acid methyl ester sulfonate: process optimization and characterization studies. Biomass Conversion and Biorefinery, 13(10), 8903-8914.
https://doi.org/10.1007/s13399-021-01663-y |
[22]
. Neem-MES showed a comparatively weaker minimum surface tension (36.7 mN/m), which may reflect differences in the fatty-acid chain length and unsaturation profile of Neem oil methyl ester limiting molecular packing efficiency at the air-water interface.
3.4.2. Critical Micelle Concentration
Table 11 presents the experimentally determined CMC values of the synthesized MES samples. Neem-MES exhibited the lowest CMC (0.18 g/L), followed by Aloe-MES (0.27 g/L) and PKO-MES (0.28 g/L). A lower CMC indicates that micelle formation occurs at a lower surfactant concentration.
Table 11. Critical micelle concentration of the synthesized MES.
MES sample | CMC (g/L) | Conductivity at CMC (µS/cm) |
PKO-MES | 0.28 | 428 |
Neem-MES | 0.18 | 396 |
Aloe-MES | 0.27 | 415 |
Neem-MES exhibited the lowest critical micelle concentration (0.18 g/L) despite showing the weakest surface tension reduction, illustrating the well-recognized distinction in surfactant science between micellization efficiency (the concentration at which micelles begin to form) and effectiveness (the magnitude of surface or interfacial tension reduction achieved), properties that are not always correlated
| [23] | Luan, H., Gong, L., Yue, X., Nie, X., Chen, Q., Guan, D., Que, T., Liao, G., Su, X., & Feng, Y. (2019). Micellar aggregation behavior of alkylaryl sulfonate surfactants for enhanced oil recovery. Molecules, 24(23), 4325.
https://doi.org/10.3390/molecules24234325 |
[23]
. The CMC values obtained for PKO-MES and Aloe-MES (0.28 and 0.27 g/L, respectively) are notably lower than several literature values reported for other plant-oil-derived EOR surfactants, such as a palm-oil methyl-ester-based polymeric surfactant (CMC ≈ 0.5%) and N-lauroyl-L-lysine (CMC ≈ 0.4%), suggesting that the surfactants synthesized in this study achieve micellization, and therefore useful interfacial activity, at comparatively low and economically favourable concentrations for potential field-scale application.
3.4.3. Foamability and Foam Stability
Table 12 presents the foam-forming ability and stability of the synthesized MES. PKO-MES exhibited the highest initial foam height and foam stability, indicating stronger interfacial film formation compared with the other MES samples.
Table 12. Foamability and foam stability of the synthesized MES.
MES sample | Initial foam height (mm) | Foam height after 5 min (mm) | Foam stability (%) |
PKO-MES | 162 | 136 | 84.0 |
Neem-MES | 148 | 119 | 80.4 |
Aloe-MES | 139 | 111 | 79.9 |
PKO-MES exhibited the highest initial foam height (162 mm) and foam stability (84.0%) of the three samples. This places it broadly within, and toward the upper end of, the moderate-to-high foaming range historically reported for C
12-C
18 methyl ester sulfonates: Kapur et al.
| [24] | Kapur, B. L., Solomon, J. M., & Bluestein, B. R. (1978). Summary of the technology for the manufacture of higher alpha‐sulfo fatty acid esters. Journal of the American Oil Chemists Society, 55(6), 549-557. https://doi.org/10.1007/bf02668068 |
[24]
reported foam heights of approximately 137 mm for C16-C18 α-MES (classed as moderate foamers) and approximately 159 mm for C14 α-MES (classed as high foamers) at 0.1% active surfactant concentration. Since palm kernel oil is dominated by lauric acid (~C12), the relatively strong foaming performance observed for PKO-MES in this study is consistent with the shorter-chain, high-foaming behaviour documented for lauric-range methyl ester sulfonates. The comparatively lower foam height and stability of Neem-MES and Aloe-MES likely reflect their more unsaturated, longer-chain fatty acid profiles, which are generally associated with less cohesive interfacial films and correspondingly weaker foam stability.
3.4.4. FTIR Characterization of Synthesized MES
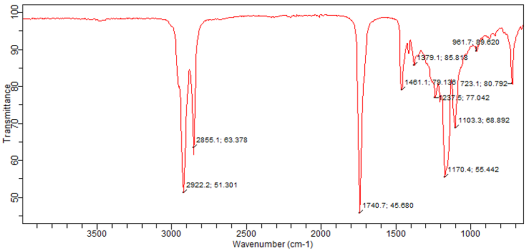
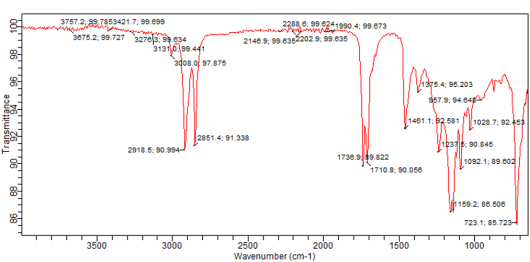
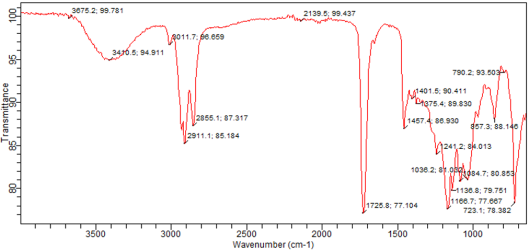
Figures 5-7 present the FTIR spectra of the synthesized PKO-MES, Neem-MES, and Aloe-MES samples, respectively, confirming the presence of the characteristic sulfonate and ester functional groups formed during synthesis.
All three spectra display the paired C-H stretching bands at 2911-2922 cm⁻
1 (asymmetric) and 2851-2855 cm⁻
1 (symmetric), together with a rocking mode near 723 cm⁻
1, confirming that a long, unbranched aliphatic chain was retained through transesterification and sulfonation in each sample. A sharp carbonyl band at 1725-1741 cm⁻
1 is likewise present in all three spectra, consistent with retention of the methyl ester -C=O group and confirming that the sulfonation step did not cleave the ester linkage. In each spectrum a band in the 1237-1241 cm⁻
1 region, accompanied by supporting features between 1085 and 1103 cm⁻
1 and near 960 cm⁻
1, is assigned to the asymmetric and symmetric S=O stretching modes of the newly introduced sulfonate (-SO
3⁻) group; asymmetric S=O stretches in this general range (approximately 1200-1250 cm⁻
1) are widely reported as the diagnostic signature of sulfonation in other sulfonated substrates
| [25] | Calegari, G. C., Queiroz, S. V. A., Barbosa-Dekker, A. M., Busso, C., Dekker, R. F. H., & Da Cunha, M. a. A. (2019). Sulfonated (1→6)-β-d-Glucan (Lasiodiplodan). Food Technology and Biotechnology, 57(4), 490-502.
https://doi.org/10.17113/ftb.57.04.19.6264 |
[25]
. The consistent appearance of this band across PKO-, Neem-, and Aloe-derived samples supports successful conversion of the methyl ester to methyl ester sulfonate for all three feedstocks, in agreement with the yields already reported in
Table 6.
Figure 5. FTIR spectrum of PKO-MES.
Figure 6. FTIR spectrum of Neem-MES.
Figure 7. FTIR spectrum of Aloe-MES.
The three spectra also differ in ways that are consistent with the feedstock-specific composition established earlier in this study. PKO-MES shows no discernible band near 3000-3011 cm⁻
1, whereas Neem-MES shows a weak feature and Aloe-MES a clearly resolved one at this position; since this band is assigned to olefinic =C-H stretching, its absence in PKO-MES and progressively stronger appearance in Neem-MES and Aloe-MES tracks the same order of unsaturation indicated by the iodine values of the parent oils (PKO 18.7, Neem 69.8, Aloe vera 74.3 g I
2/100 g;
Table 4), providing an internally consistent structural cross-check of the compositional data. The carbonyl region also differs among the three samples: PKO-MES shows a single, sharp band at 1740.7 cm⁻
1, Neem-MES shows a split band with a shoulder at 1710.8 cm⁻
1, and Aloe-MES shows a single but distinctly downshifted band at 1725.8 cm⁻
1. The low-frequency shoulder in Neem-MES is consistent with a hydrogen-bonded or free-acid carbonyl environment and corresponds with Neem-MES having the highest acid value among the synthesized surfactants (5.64 ± 0.17 mg KOH/g;
Table 9), while the downshifted single carbonyl band in Aloe-MES may instead reflect hydrogen-bonding interactions with residual hydroxyl-rich mucilage components carried over from the leaf-derived Aloe vera oil. A broad O-H stretch was likewise resolved only for Neem-MES (weakly, 3421.7 cm⁻
1) and Aloe-MES (more prominently, 3410.5 cm⁻
1), and was not resolved for PKO-MES, again consistent with PKO being a more saturated, less hydroxyl-bearing kernel oil relative to the leaf-derived feedstocks.
A cluster of very sharp, near-baseline features above 3100 cm⁻1 and between 1990 and 2290 cm⁻1 in the Neem-MES spectrum coincides with the transmittance range typically associated with uncompensated atmospheric carbon dioxide and water-vapour rotational-vibrational lines in FTIR benches, rather than with sample chemistry; as these features sit within a fraction of a percent of 100% transmittance, they have not been assigned a chemical origin here.
3.5. Relationship Between Feedstock Composition and Surfactant Performance
Fatty acid profiles were not measured in this study, so this discussion combines the measured iodine values, acid values, and FTIR evidence with literature compositions. PKO is dominated by saturated lauric (C12) and myristic (C14) acids, consistent with its low iodine value (18.7). Neem seed oils are reported to contain mainly C18 oleic acid (about 41-51%) with stearic, palmitic, and linoleic acids (roughly 11-22% each)
| [31] | Garg, R., Kant, R., Kumar, A., Tripathi, Y. C., & Bisht, S. S. (2024). Variability for morphological traits, oil and chemical constituents content in Azadirachta indica A. Juss. (Neem) seeds. Indian Forester, 150(1), 40-45.
https://doi.org/10.36808/if/2024/v150i1/169777 |
[31]
, a longer-chain and more unsaturated profile consistent with the iodine values of Neem (69.8) and Aloe vera (74.3) oils, although the leaf oils used here may differ from seed oils.
Micellization. CMC decreases as the hydrophobic chain lengthens, because removing a longer tail from water gives a larger free-energy gain. The lower CMC of Neem-MES (0.18 g/L) than PKO-MES (0.28 g/L) is therefore consistent with a longer average chain. Aloe-MES (0.27 g/L) is close to PKO-MES despite its high unsaturation, so chain length alone does not explain the CMC trend, and the unknown composition of Aloe vera leaf oil and co-extracted non-lipid material may contribute.
Interfacial packing. By the Gibbs adsorption equation, the pre-CMC slope of surface tension against ln C is proportional to the surface excess. The fitted slopes (
Table 11) were −9.55 (PKO-MES), −9.45 (Aloe-MES), and −8.77 mN/m (Neem-MES). The smaller slope and higher γCMC of Neem-MES indicate a lower surface excess and looser packing, consistent with kinked cis-unsaturated C18 chains occupying a larger area per molecule, and with its higher acid value (5.64 mg KOH/g), which indicates more residual free acid or unsulfonated species that dilute the interfacial film. The slope difference is only about 8%, and the Neem fit uses four points, so this interpretation is indicative. Converting the slopes into maximum surface excess and area per molecule requires the average molecular weight of each MES, which needs the fatty acid profile.
Foaming. The highest foam stability of PKO-MES agrees with its saturated, shorter-chain composition, which favors dense, cohesive interfacial films, whereas the unsaturated, longer-chain Neem-MES and Aloe-MES form less cohesive films. Pigments, terpenoids, and other non-triglyceride constituents co-extracted from leaves may also be carried into the unrefined products and influence adsorption and foaming.
Overall, the data link low unsaturation and low free fatty acid content to better conversion, yield, surface tension reduction, and foam stability (PKO-MES), whereas longer, more unsaturated chains lower the CMC but pack less efficiently (Neem-MES). GC-MS of the oils and methyl esters is needed to test these relationships quantitatively.
3.6. Feedstock Demand, Reagent Use, and Sustainability Considerations
Table 13 gives the mass balance calculated from the measured yields. PKO needs about 2.7 g of feedstock per gram of MES, whereas Aloe vera and Neem leaves need about 24.0 g and 16.8 g, respectively, roughly 9 and 6 times more biomass than PKO. (Feedstock masses are those charged to extraction; the moisture basis should be stated.) Together with the weaker surface activity of Neem-MES and the similar performance but much lower oil yield of Aloe-MES, this makes the leaf feedstocks viable only if the leaf material is a free residue with low collection cost, or if higher-yielding fractions can be used.
Table 13. Feedstock and reagent demand per gram of MES, calculated from the measured data.
Parameter | PKO-MES | Aloe-MES | Neem-MES |
Oil yield (g/g feedstock) | 0.473 | 0.057 | 0.086 |
Methyl ester recovered (g/g oil) | 0.893 | 0.867 | 0.849 |
MES yield from methyl ester (g/g) | 0.864 | 0.837 | 0.815 |
Overall MES (g/g feedstock) | 0.365 | 0.042 | 0.059 |
Feedstock required (g/g MES) | 2.7 | 24.0 | 16.8 |
NaHSO3 used (g/g MES) | 0.69 | 0.71 | 0.72 |
NaOH for neutralization (g/g MES) | 0.078 | 0.081 | 0.082 |
Reagent and process burden. Sulfonation used about 0.7 g of sodium bisulfite per gram of MES (22 g per 45 mL of methyl ester), a large excess that ends up as salts in the wash water, and the NaOH and CaO catalysts were used once without recovery. Methanol is used in excess in transesterification, the glycerol layer and wash waters are waste streams, and n-hexane is a flammable, petroleum-derived solvent whose consumption per gram of oil must be reported and, ideally, reduced by solvent recovery. Methanol recovery, catalyst recovery, and hexane recycling were not evaluated here. Energy use was not measured, but after extraction the process involves about 10 h of heating at 70°C, dominated by sulfonation (4.5 h) and product drying (4 h), in addition to 6-8 h of Soxhlet extraction; shortening these steps is the most obvious route to lower energy demand.
Environmental comparison. MES is derived from renewable carbon and is reported in the literature to be readily biodegradable, which is the main environmental argument against petroleum sulfonates; however, this was not verified here, and the methanol and hexane inputs are largely fossil-derived. A life-cycle assessment and a techno-economic analysis, comparing the MES route with petroleum-derived EOR surfactants on a functional-unit basis (for example, per unit of incremental oil recovered), have not been done and are needed before sustainability or cost advantages can be claimed quantitatively.







 Share This Article
 Twitter
 Linked In
 Facebook

 Copy
 Download