Abstract
This paper examines the effect of travel-related stress on the work performance and well-being of civil servants in Ibadan, Nigeria. The study aims to assess the extent to which daily commuting conditions influence workers’ health, productivity, and overall job efficiency. The objectives are to identify the major travel stressors encountered by civil servants; evaluate the relationship between socio-economic characteristics and perceived stress; assess the condition of urban transport infrastructure and its contribution to stress; and determine the effects of travel stress on workers’ well-being and job performance. Primary data were obtained from 139 civil servants across selected ministries. Variables analysed include urban infrastructure condition indicators neighbourhood road quality, public transport condition, streetlight functionality, traffic flow, drainage condition, and bus-stop facilities, and stress impact indicators such as fever, headache, stomach disorder, cold, elevated body temperature, and body pain. Analytical tools employed include descriptive statistics and Likert scaling. Major stress-inducing factors identified include traffic congestion, poor road surfaces, queues at bus stops, and impatience among road users. The study concludes that travel stress remains a critical challenge affecting the physical well-being and job performance of civil servants in Ibadan. Recommendations include improving public transport services, rehabilitating and expanding road infrastructure, enforcing traffic management regulations, strengthening street lighting and drainage systems, and developing worker-oriented mobility policies such as synchronized mass transit services and priority lanes for civil servants. Implementing these measures will enhance accessibility, safety, affordability, and comfort within the intra-urban transport system, ultimately improving workplace productivity and overall quality of life for civil servants.
|
Published in
|
Urban and Regional Planning (Volume 11, Issue 2)
|
|
DOI
|
10.11648/j.urp.20261102.13
|
|
Page(s)
|
122-132 |
|
Creative Commons
|

This is an Open Access article, distributed under the terms of the Creative Commons Attribution 4.0 International License (http://creativecommons.org/licenses/by/4.0/), which permits unrestricted use, distribution and reproduction in any medium or format, provided the original work is properly cited.
|
|
Copyright
|
Copyright © The Author(s), 2026. Published by Science Publishing Group
|
Keywords
Civil Servant, Well-being, Travel Stress, Stress Indicators, Nigeria
1. Introduction
Urban mobility remains one of the most critical determinants of productivity and well-being in rapidly growing cities across the world. Contemporary evidence shows that inefficient transport systems significantly undermine the physical, psychological, and economic stability of urban populations, especially in low- and middle-income countries where infrastructural gaps are more pronounced
| [31] | World Bank. (2022). Urban transport and worker productivity: Global evidence on commuting stress. World Bank Publications. |
[31]
. As cities expand and daily commuting distances increase, workers are increasingly exposed to transportation-related stressors that influence performance, absenteeism, and overall quality of life. This challenge is particularly evident in African and Asian cities, where rapid urbanization has outpaced investments in transport infrastructure
| [29] | United Nations-Habitat. (2021). The state of urban mobility in developing regions. UN-Habitat. |
[29]
.
Globally, stress is defined as a physiological and psychological response to perceived pressures, demands, or threats that exceed an individual’s coping capacity. In the context of mobility, commuting stress refers to the strain experienced during daily travel as a result of congestion, unreliable transport services, long travel times, overcrowding, noise, and safety concerns. Studies have linked commuting stress to fatigue, low job satisfaction, emotional exhaustion, and reduced organizational commitment
| [26] | Sener, I., and Lee, R. (2021). Commuting stress and job performance among urban workers. Transportation Research Part F, 80, 235–247. |
[26]
. Workers who endure stressful commutes often exhibit higher levels of anxiety and reduced capacity for productive engagement upon arrival at the workplace.
In developing countries, where public transport systems are often poorly regulated, commuting stress poses even greater risks. Research from Nairobi, Accra, New Delhi, and Dhaka reveals that traffic congestion, unsafe public transport vehicles, excessive travel times, and overcrowding contribute significantly to workers’ stress levels, lateness, and poor job performance
. In Lagos and Abuja, studies show that commuters spend between 2–4 hours daily in traffic, resulting in fatigue, headaches, hypertension, and productivity loss
| [22] | Olawole, M., and Aloba, O. (2020). Urban commuting and stress among workers in Lagos. Nigerian Journal of Transport and Development Studies, 5(1), 76–89. |
[22]
. These patterns highlight the pervasive impact of urban travel stress across developing regions.
In Nigeria, the situation is particularly concerning as rapid urbanization, inadequate road infrastructure, deteriorating public transport services, and poor traffic management have made commuting increasingly stressful for civil servants
| [3] | Agyemang, E., and Prasad, P. (2022). Traffic congestion and worker stress in developing cities. Transport Policy, 117, 98–108. |
[3]
. Ibadan, one of Nigeria’s largest cities, experiences recurring traffic congestion, bad road conditions, insufficient mass transit services, and long waiting times at bus stops. These conditions expose workers to repeated physical and psychological stress, which may affect workplace efficiency, punctuality, and overall well-being.
Given these realities, this study aims to examine the effect of travel-related stress on the work performance and well-being of civil servants in Ibadan, Nigeria. The study seeks to identify the major commuting stressors experienced by civil servants, assess how socio-economic characteristics influence perceived stress, evaluate the condition of urban transport facilities contributing to stress, and determine the implications of travel stress for workers’ productivity and health outcomes. This study would generate empirical evidence that can guide transport and workplace policy reforms within Ibadan, support the improvement of mobility conditions for civil servants, and contribute to broader urban planning strategies aimed at reducing commuting burdens, enhancing worker productivity, and improving overall quality of life in the city.
2. Review of Literature
Urban transport systems remain one of the most challenging components of contemporary city management, especially in rapidly growing regions of the Global South. Globally, the literature shows a clear consensus that the ability of transport systems to support efficient mobility is directly linked to urban productivity, health, and socio-economic well-being. As cities continue to grow in size, population, economic complexity, and spatial extent, mobility becomes a key determinant of how well people access opportunities, perform their daily tasks, and sustain productive livelihoods. Recent studies emphasize that transport inefficiencies, manifesting in congestion, delays, unreliable public transport, and poor infrastructure are significant sources of stress that affect workers’ psychological and physical health
| [15] | International Transport Forum. (2023). Urban mobility trends and mobility-related stress. OECD Publishing. |
| [27] | Sharifi, A., and Khavarian-Garmsir, A. (2021). Urban transport, environmental stressors, and well-being. Sustainable Cities and Society, 74, 103207. |
[15, 27]
.
In many metropolitan regions around the world, commuting has become increasingly stressful due to rising automobile dependence, insufficient public transit supply, and growing travel times. Research across Europe and North America suggests that long commute durations and unpredictable travel conditions are strong predictors of reduced job satisfaction, poorer mental health outcomes, and lower organizational commitment
| [11] | Eurofound. (2021). Working conditions and sustainable work: An analysis of commuting stress in Europe. Publications Office of the European Union. |
| [28] | Smith, H., Giovani, A., and Patel, R. (2023). Commuting, mental strain, and productivity loss in global cities. International Journal of Urban Sustainable Development, 15(2), 145–162. |
[11, 28]
. Commuting stress has been conceptualized as a multidimensional phenomenon shaped by environmental conditions, perceived loss of control, travel time variability, crowding, noise, and exposure to pollution. These stressors trigger physiological responses such as elevated cortisol levels, fatigue, irritability, and reduced concentration, all of which negatively influence workplace performance
| [30] | Wang, Y., Xu, T., and Li, J. (2022). Commuting stress, emotional exhaustion, and workplace outcomes: Evidence from Asian megacities. Journal of Transport and Health, 26, 101471. |
[30]
. The World Health Organization
| [32] | World Health Organization. (2022). Urban stressors and occupational health: Global evidence and policy pathways. WHO Press. |
[32]
also highlights transport-related stress as an emerging domain of occupational health, noting that the rise of mega-cities and motorization has intensified the health burden associated with daily travel.
While commuting stress is a global issue, its intensity is far more pronounced in developing countries where transport infrastructure is often inadequate, institutional capacity is weak, and mobility demand far exceeds supply. Literature from rapidly urbanizing cities in Africa, Asia, and Latin America consistently reveals that poor road quality, insufficient public transport systems, congestion, and weak traffic management contribute significantly to everyday stress among urban residents
| [5] | Amoako, C., and Cobbinah, P. B. (2021). Urban transport inequalities and commuter stress in African cities. Cities, 108, 102980. https://doi.org/10.1016/j.cities.2020.102980 |
| [10] | Duarte, F., and Gonçalves, A. (2023). Commuting hardships and psychological strain in Latin American cities. Urban Studies, 60(8), 1521–1539.
https://doi.org/10.1177/00420980221144600 |
| [25] | Rahman, M., Chowdhury, S., and Khalid, M. (2022). Traffic congestion and psychological stress among urban commuters in Dhaka. Transportation Research Part D: Transport and Environment, 107, 103286.
https://doi.org/10.1016/j.trd.2022.103286 |
[5, 10, 25]
. In Nairobi, for instance, studies show that traffic congestion delays can reach up to three hours per day for public transport users, resulting in heightened anxiety, lowered job productivity, and increased absenteeism
| [24] | Omondi, P., and Agong, S. (2021). Congestion, commuting stress, and worker productivity in Nairobi. African Transport Journal, 3(1), 54–69. |
[24]
. Similarly, in Accra, commuting has been linked to increased musculoskeletal pain, emotional exhaustion, and reduced workplace engagement due to overcrowded buses, long waiting times, and deteriorating road surfaces
. In South Asian cities such as Dhaka and Mumbai, research associates frequent traffic jams and overcrowded transport systems with elevated levels of stress, hypertension, and reduced work output among office workers
| [9] | Deshmukh, M. (2023). Commuting stress and occupational health among office workers in Mumbai. Asia-Pacific Journal of Public Health, 35(2), 134–147. |
| [25] | Rahman, M., Chowdhury, S., and Khalid, M. (2022). Traffic congestion and psychological stress among urban commuters in Dhaka. Transportation Research Part D: Transport and Environment, 107, 103286.
https://doi.org/10.1016/j.trd.2022.103286 |
[9, 25]
.
Transport-related stress in developing cities is strongly influenced by the socio-economic context in which mobility occurs
| [8] | Chen, Y., He, L., and Chen, S. (2020). Traffic congestion, commuter stress, and employee well-being: Evidence from Chinese megacities. Transportation Research Part F: Traffic Psychology and Behaviour, 72, 35–47.
https://doi.org/10.1016/j.trf.2020.05.009 |
[8]
. Workers with lower incomes, limited access to private vehicles, and heavy reliance on public buses often experience more intense commuting stress than higher-income workers. Gender also plays a crucial role, as women in many developing countries are more exposed to harassment, insecurity, and overcrowding during travel, which compounds their overall stress burden
| [18] | Ndetto, E., and Jimenez, A. (2021). Travel stress, gendered mobility, and safety concerns among women in Dar es Salaam. Journal of Transport Geography, 94, 103104. |
| [21] | Olawande, T., and Olusanya, A. (2023). Gendered experiences of commuting stress in Lagos megacity. Transportation Research Interdisciplinary Perspectives, 19, 100782. |
[18, 21]
. These socio-economic and gendered patterns of commuting stress illustrate the broader inequalities embedded within urban mobility systems.
In West Africa, and Nigeria in particular, commuting stress has gained increasing academic attention over the last decade. Nigeria’s major cities such as Lagos, Ibadan, Port Harcourt, Abuja, Kano, have experienced rapid population growth and severe infrastructural deficits that limit efficient movement. Lagos, for example, records an average peak-hour travel speed of less than 20 km/h, one of the lowest globally for a developing city, resulting in significant productivity losses and emotional strain for workers
| [2] | Adetunji, O., and Adeniran, A. (2020). Traffic congestion and productivity loss in Lagos megacity. African Cities Review, 8(2), 55–72. |
[2]
. Studies from Lagos reveal that prolonged travel times, heavy congestion, and inadequate public transport networks significantly affect psychological well-being, punctuality, concentration, and overall job performance
| [20] | Oduwaye, L. (2022). Psychological outcomes of long commuting times in Lagos megacity. Journal of Urban Management, 11(2), 230–242. |
[20]
. In Abuja, research indicates that recurring traffic delays and overcrowded transport systems contribute to stress-related health symptoms such as headaches, fatigue, and high blood pressure among civil servants
| [6] | Atser, J., and Ezeani, E. (2022). Commuting patterns and occupational stress among government employees in Abuja, Nigeria. Nigerian Journal of Public Administration, 20(3), 112–129. |
[6]
.
Ibadan, Nigeria’s largest city by land area and one of the oldest pre-colonial urban centres, faces persistent mobility challenges arising from inadequate road networks, insufficient street lighting, overloaded transport corridors, and poor drainage systems that exacerbate traffic flow problems, particularly during the rainy season
| [23] | Oluwafemi, A., and Aluko, O. (2023). Transport infrastructure deficits and commuter well-being in Ibadan metropolis. Journal of African Urban Studies, 5(1), 76–95. |
[23]
. Recent studies in the city document that daily travel stress is common among public and private workers, with the most frequently reported stress factors including long waiting times at bus stops, poor road surfaces, traffic congestion, and unpredictability of travel times
| [1] | Adelekan, I. O., and Adebayo, W. O. (2021). Urban mobility challenges and commuting stress among workers in Ibadan, Nigeria. Journal of Transport and Land Use, 14(1), 345–360. |
[1]
. These travel conditions limit the ability of workers to arrive punctually, maintain high energy levels, and sustain consistent productivity at their workplaces. In particular, civil servants whose work schedules are strictly time-bound are especially vulnerable to the consequences of commuting stress.
The literature consistently shows that commuting stress is linked to various aspects of occupational well-being
| [13] | Hennessy, D. (2020). Commuting stress and job satisfaction among urban employees. Journal of Occupational Health Psychology, 25(4), 563–574. |
[13]
. According to the International Labour Organization
| [14] | International Labour Organization. (2022). Global report on occupational safety and worker well-being. ILO Publications. |
[14]
, workers experiencing daily travel stress tend to display lower job satisfaction, reduced organizational loyalty, higher fatigue levels, and diminished mental concentration. These effects can accumulate over time and manifest as absenteeism, burnout, reduced job engagement, and turnover intentions. Furthermore, transport-induced stress spills over into non-work domains, disrupting family interactions, limiting rest periods, and reducing overall quality of life. Such cumulative effects underscore the importance of understanding commuting stress not merely as a transport issue but as a critical socio-economic and public health concern.
Recent behavioural studies also highlight the psychological component of commuting stress. Feelings of helplessness and lack of control, which often arise during extended periods spent in traffic or long queues for public buses, have been found to elevate emotional distress and trigger stress-related responses
| [28] | Smith, H., Giovani, A., and Patel, R. (2023). Commuting, mental strain, and productivity loss in global cities. International Journal of Urban Sustainable Development, 15(2), 145–162. |
[28]
. In African cities, where transport services are often unreliable and unpredictable, these psychological stressors are amplified by infrastructural weaknesses, inadequate regulation, and high commuter demand
| [5] | Amoako, C., and Cobbinah, P. B. (2021). Urban transport inequalities and commuter stress in African cities. Cities, 108, 102980. https://doi.org/10.1016/j.cities.2020.102980 |
| [7] | Carpenter, C., and Ghilarducci, T. (2023). Work–life spillover effects of commuting stress in urban labour markets. Work, Employment and Society, 37(1), 129–147.
https://doi.org/10.1177/09500170221085794 |
[5, 7]
.
Importantly, research also shows that the relationship between transport stress and worker outcomes is influenced by adaptive coping strategies. Workers with long-term exposure to stressful commuting environments may develop coping mechanisms such as adjusting departure times, using alternative routes, or forming travel routines that help reduce perceived stress levels
. However, such coping strategies are typically insufficient when systemic deficiencies in transport infrastructure persist.
Therefore, for civil servants, who form the administrative backbone of government functioning, the effects of travel stress have critical implications for governance efficiency, public service delivery, and national productivity. Within this context, the present study contributes to the growing body of knowledge by examining commuting stress specifically in Ibadan’s civil service environment, thereby filling a notable gap in current empirical research on occupational health and transport dynamics in medium-sized African cities.
3. The Study Area
The city of Ibadan, like many cities in Nigeria, has been growing in recent years in all directions without direction. Lack of physical planning in many parts of Ibadan city has contributed in no small measure. It gives rise to the almost disorganized arrangements of buildings, which in turn negates and continue to prevent the development of better sections of the city. Even in the areas, which appear to be better planned, there is no adequate provision of sidewalks to facilitate pedestrian movements. Where sidewalks exist, they are usually taken over by roadside traders, forcing pedestrians more to walk on road pavements. According to Filani
| [12] | Filani M. O. (1094). Transport. In Filani, M. O, F. O. Akintola and C. O Ikporukpo, (Eds), Ibadan Region, Ibadan; Rex Charles, pp: 179-190. |
[12]
, this, in essence means constant conflicts between pedestrians and motorists. most of the existing roads in the city were constructed in the late 1940s and early 1950s when the city’s economic base and territorial extent were very limited
| [12] | Filani M. O. (1094). Transport. In Filani, M. O, F. O. Akintola and C. O Ikporukpo, (Eds), Ibadan Region, Ibadan; Rex Charles, pp: 179-190. |
[12]
. At that time the major commercial and industrial activities were concentrated in a few pockets area and fewer vehicles were in circulation within the city. Consequently, the roads are narrow, winding and lacking in pedestrian sidewalks and adequate parking facilities. The existing transport systems fall far short of the ever increasing commuter traffic demand and the complexity of intra-urban journey patterns. This has resulted in excess capacity utilization, which has contributed to the deterioration of the roads
| [16] | Khan, S., Rahman, M., and Das, S. (2021). Public transport stress and worker productivity in South Asian cities. Journal of Transport Geography, 92, 103042. |
[16]
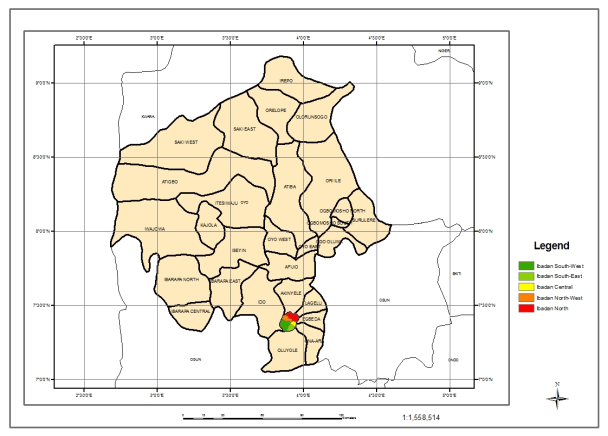
. Vehicles are always double-parked along the verges of the main roads thereby decreasing their lane capacity. As a result, traffic congestion, ‘hold-ups’ and bottlenecks are a common feature, particularly during rush hours which affects the well-being of the people particularly the government workers in the performance of their duty in Ibadan metropolis (See
Figure 1).
Figure 1. Map of Oyo State indicating the Study Area.
4. Material and Methods
Both primary and secondary data were obtained and used for the study. The primary data were collected through well-structured questionnaires administered to the government workers in the study area. Personal observation approach was also used which was carried out in line with the objectives of the study while Secondary data were gathered through the review of past works written on similar studies from different authors, research work, text books, journals, conference proceedings, published papers, newspapers and internet materials.
This study covers the civil servants in Government Secretariat Ibadan, Oyo state. The study utilized primary data obtained through questionnaire administration. Information obtained includes the socio-economic attributes of civil servants in Ibadan; the travel mode of civil servants in the study area; travel stress factors among the civil servants and the effect of travel stress on the civil servants well-being. Administration of questionnaire was the major means of primary data collected. In other to administer questionnaires, five ministries were randomly selected by balloting from the 19 ministries that constitute Oyo State work force. The ministries are: Ministry of Justice, Ministry of Lands and Housing, Ministry of Local Governments and Chieftaincies, Ministry of Health and Ministry of Establishment and Training. In administering the questionnaire due to the busy work of the ministries convenience sampling technique was used to select 30 respondents from each ministry. From this sampling technique, a total number of 150 questionnaires were administered. However, 139 questionnaires were recovered; given a recovery rate of 92.7%.
This study adopted a cross-sectional survey design, drawing on both primary and secondary data to evaluate the effects of travel-related stress on the work performance and well-being of civil servants in Ibadan, Oyo State. Primary data were collected through a structured questionnaire and direct field observations, while secondary data were sourced from scholarly journal articles, government publications, transport policy documents, conference proceedings, and relevant online materials. The combination of these data sources provided a robust empirical foundation for understanding commuting conditions, stressors, and occupational implications.
The study population comprised all civil servants working at the Oyo State Government Secretariat, Agodi, Ibadan. To determine an appropriate sample size, the Yamane (1967) sample size formula for finite populations was applied using a 95% confidence level and a 5% margin of error
| [33] | Yamane, T. (1967). Statistics: An introductory analysis (2nd ed.). Harper and Row. |
[33]
. Given an estimated civil service workforce of 3895 employees within the Secretariat complex, the formula produced a minimum sample requirement of 364 respondents. However, due to time constraints, staff availability, and the high mobility of ministry personnel, a proportional and realistic sample of 150 respondents was selected as a probability proportion to size. This adjusted sample size aligns with recommendations for applied social research where accessibility and administrative constraints may limit probability sampling, yet representativeness must still be maintained.
A multistage sampling process was adopted. First, five ministries were randomly selected through simple balloting from the 19 ministries within the Secretariat: Ministry of Justice, Ministry of Lands and Housing, Ministry of Local Government and Chieftaincy Matters, Ministry of Health, and Ministry of Establishment and Training. In the second stage, convenience sampling was applied within each ministry to select respondents based on availability, willingness, and accessibility during office hours. This approach was necessitated by the demanding schedules of civil servants, which made systematic or stratified selection impractical. Thirty questionnaires were distributed in each selected ministry, giving a total of 150. Of these, 139 were correctly completed and returned, yielding a recovery rate of 92.7 percent.
Data analysis involved both descriptive and inferential statistical techniques. Descriptive statistics such as frequencies, percentages, means, and standard deviations were used to summarize respondents’ socio-economic characteristics and commuting experiences. The perceived influence of each stressor was quantified using a Likert-derived index. All statistical analyses were conducted using SPSS version 25.
5. Results and Discussion
This chapter deals with the data analysis and the interpretation of findings of the travel stress among civil servants in Ibadan. Frequency tables, Likert scale, were used to analyse the data. It is what mentioning that unless otherwise stated; all tables in this section emanated from the author’s field survey 2024.
5.1. Socio-economic Attributes of the Civil Servants
It is important to examine who the respondents were. To this end, information on social, economic and demographic attributes were obtained. The analyses of the information obtained is as presented in
Table 1. The study established that 59.7% of the respondents (civil servants) were male while 40.3% were female. The proportion of male to female respondents in the result ensures that both genders were carefully selected so as to achieve significant contributions of both male and female workers in the study area.
An inquiry into the marital status of the respondents also indicated that 50.4% were married, 46.8% were single while 2.8% were divorced and 0.7% were widowed respectively. The result indicated that all the spheres of marital status were included so as to avoid biasness in the data collection. 71.3% of the respondents were within age 20 – 39 years, 7.2% are within age 40-49 years, 7.9% are 50 years and above while 13.7% declined to declare their age. The result is an indication that majority of the respondents were in their early stage of life and that they are still active in their day to day activities. Since they are agile, there is probability that this set of people would experience traffic stress most. Educationally, the number of years spent in school always determined the qualification one is possibly to posses where some of them failed to tick their qualifications the number of years was used in acquiring education was used to suggest the likely qualification of the respondents.
Information gathered revealed that virtually all the respondents have passed through one institution or the other with a certain qualification. It thus signified that all of them are literate, 58.3% of the respondent possessed Higher National Diploma/Bachelor of Science and above, 29.5% possessed National Diploma/Nigeria Certificate in Education, 10.7% were post primary while only 1.4% was primary school leaver. The implication of this is that nearly all the respondents can understand what stress is and were able to give correct answers to the questions provided in the questionnaires.
For ease of analysis, respondents were classified into three income groups: low, middle and high. In Nigeria, government on salary grade levels 01 – 06 are in low income group. The monthly income of group is between #7500 – #10,000. Similarly, government workers on salary grade levels 07-12 usually with a monthly income of between 10,001 Naira and 30,000 Naira are middle income. Workers earning above 30,000 Naira monthly are in high income group.
From the research findings, respondents income varies from one person to another. Conclusion is also drawn that the largest proportion (28.78%) of the workers were in middle income group. While 25.90% of the respondents were in high income group and 1.4% were in low income group. Though the research discovered that most of the respondents were medium and high income earners yet, majority of them signified that they depend on public transport for their daily trip to work. This implies that due to various responsibilities and non-implementation of the new minimum wage salary scale many of them could not afford to have cars and this tends to make them suffer more due to the fact that they can hardly manouver their journey they will have to depend on public transport for their mobility. This situation makes them to always become vulnerable to traffic stress.
Table 1. Socio-economic Attributes of the Civil Servants.
Socio-economic parameters | No of workers | % | Total |
Gender: Male | 83 | 56.7 | |
Female | 56 | 40.3 | 100 |
Age of respondents: Less than 20 | 8 | 5.8 | |
20-29 | 46 | 33.1 | |
30-39 | 45 | 32.4 | |
40-49 | 10 | 7.2 | |
50yrs and above | 11 | 7.9 | |
No response | 19 | 13.7 | 100 |
Years spent in pursuit of formal education: 6yrs | 2 | 1.4 | |
7-12yrs | 18 | 12.9 | |
Above 12yrs | 95 | 68.4 | |
Not applicable | 24 | 17.3 | 100 |
Marital status: Married | 65 | 46.8 | |
Single | 70 | 50.4 | |
Divorced/separated | 4 | 2.8 | |
Widow/widower | 1 | 0.7 | 100 |
Highest educational qualification: PhD | 1 | 0.7 | |
MSC/PGD | 12 | 8.6 | |
BSC/HND | 68 | 48.9 | |
ND/NCE | 41 | 29.5 | |
SSCE | 15 | 10.79 | |
Primary | 2 | | 100 |
Income per month: 10,000-19,000 | 2 | 1.4 | |
20,000-29,000 | 40 | 28.7 | |
30,000-39,000 | 26 | 18.7 | |
40,000 and above | 10 | 7.3 | |
No response | 61 | 43.9 | 100 |
Source: Author Field Survey, 2024
5.2. Waiting Period of Civil Servant at the Bus Stop
Presented in the
Table 2 is the analysis of passengers waiting period at the bus–stop in the study area. Important characteristic of a public transport service is the time a passenger has to wait before getting on a vehicle. For this work, waiting time for bus is defined as the time a passenger spent at the bus stop between the passenger’s arrival at a bus stop with the intention of catching bus and the time the bus he/she eventually boarded departs from the bus stop. The research established that passengers waiting period at the bus-stop for bus in the study area range from 1-10 minutes (1.4%), 11-20 minutes (12.2%), 21-30 minutes (2.9%) and above 30 minutes (28.1%). From the analysis it is obvious that the level of services of public transport in the study area is very poor due to the fact that waiting time above 30 minutes carries the larger percentage of the analysis. Confirming this report is the average passenger waiting time devised by the World Bank, ranges from 5-10 minutes indicating high quality of bus services and the maximum time passengers are expected to wait for the arrival of buses at bus stops, ranges from 11-20 minutes indicating moderate quality of services. When the passengers waiting time is above 20 minutes, it indicates poor quality of bus services (World Bank, 1987).
Table 2. Waiting Period of Civil Servant at the Bus-Stop.
Waiting period | Frequency | Percent |
1-10mins | 2 | 1.4 |
11 – 20mins | 17 | 12.2 |
21 – 30mins | 4 | 2.9 |
Above 30mins | 39 | 28.1 |
Not applicable | 77 | 55.4 |
Total | 139 | 100.0 |
Source: Author Field Survey, 2024
5.3. Factors Responsible for Stress and Their Impact on Workers’ Daily Trip to Work
Presented in
Table 3, are factors that impacts stress on workers’ daily trip to and from work. In order to ascertain the factors, workers were asked to measure the level of impact of the factors provided as they contribute to daily travel stress they usually passed through. They expressed their views using a five Likert scale of very high, high, just low, low, and very low. Workers’ views were measured through an index called “factors level of impact Index” (FLII). To arrive at FLII, weight value of 5, 4, 3, 2 and 1 were respectively attached to very high (VH), high (H), just low (JL), low (L) and very low (VL). The Index for each aspect was arrived at by dividing the “Summation of Weight Value” (SWV) by the total number of responses. The SWV for each aspect is obtained through the addition of the product of the number of responses to each aspect and the respective weight value attached to each rating.
Table 3. Factors Responsible for Stress and their Impact on Workers’ daily Trip to Work.
S/N | Factors | Rating and Weight Value |
VH 5 | H 4 | JLW 3 | LW 2 | VLW 1 | SWV | FLII | MD |
1 | Queuing | 210 | 160 | 90 | 42 | 13 | 515 | 4.08 | 1.06 |
2 | Impatience | 210 | 96 | 93 | 50 | 22 | 471 | 3.80 | 0.54 |
3 | Traffic accident | 230 | 84 | 90 | 28 | 16 | 448 | 3.53 | 0.27 |
4 | Narrow road | 160 | 92 | 114 | 38 | 15 | 419 | 3.30 | 0.04 |
5 | Poor road surface | 225 | 72 | 42 | 60 | 28 | 427 | 3.16 | -0.10 |
6 | Traffic delay | 95 | 112 | 105 | 60 | 19 | 391 | 2.98 | -0.28 |
7 | Traffic congestion | 120 | 96 | 66 | 54 | 27 | 363 | 2.88 | -0.38 |
8 | Bad vehicle condition | 130 | 68 | 87 | 56 | 27 | 368 | 2.85 | -0.41 |
9 | Attitude of road users | 95 | 68 | 93 | 70 | 24 | 350 | 2.80 | -0.46 |
FLIIa=3.26 (Mean)
Source: Author Field Survey, 2024
The summary of analysis in the
Table 3 above was the FLII for each of the nine factors that contribute to workers’ travel stress in the study area and the perception of impacts of factors responsible for stress arranged in order of their impacts by the workers. From this summary, factors of stress can be grouped into two relative to workers perceived level of impact. These were group with positive deviation and group with negative deviation from the mean index of FLII in the table above. However, the factors for stress that were above were queuing, impatience, traffic accident and narrow road. Their respective FLII were 4.08, 3.80, 3.53, 3.30 and they also had a positive deviation above the mean. The research established Queuing at the bus-stop to be the most significant of all factors that contribute to the stress workers passed through in the study area with mean deviation of 1.06. More so, factors such as, Traffic delay, poor road surface, traffic congestion, bad vehicle condition and attitude of road users with the FLII of 3.16, 2.98, 2.88, 2.85, 2.80 respectively

has their FLII value below the mean level and their respective deviations about the mean were negative. This is an indication that the contribution of those factors is very low to the stress workers usually passed through.
5.4. Rating of the Urban Transport Facilities in the Study Area
Presented in the above
Table 4 is the summary of the analysis of the rating of the transport facilities in the study area. Respondents rate the facilities using a five Likert scale of excellent, very good, good, poor, very poor. Responses were measured through an index called “Urban Transport Facilities Index” (UTFI). To arrive at the WTFI weight value the procedure for arriving at this index is similar to the one used in the above section. The mean index for the UTFI frequentness of the problem was

2.48. This is obtained by summing the index of UTFI and dividing by the number of the identified factors (n=5).
The summary of analysis indicated that road quality and bus-stop with UTPI of 2.70, 2.48 respectively with mean deviation that is positive and equal (0.22 and 0.00) which is an indication that the roads and bus stop in the study area can be rated to be in the state of fairness. However, the research established that traffic light, street light and drainage system are very poor in the study area because their computed mean is below the mean and their mean deviation is negative (-0.09, -0.08, -0.03 respectively).
Table 4. Rating of the Urban Transport Facilities in the Study Area.
S/N | Facilities | Rating | SWV | UTFI | MD |
Excellent | Very Good | Good | Poor | Very Poor |
5 | 4 | 3 | 2 | 1 |
1 | Road quality | 45 | 52 | 171 | 72 | 16 | 356 | 2.70 | 0.22 |
2 | Bus stop | 20 | 36 | 141 | 120 | 13 | 330 | 2.48 | 0.00 |
3 | Traffic light | 20 | 52 | 120 | 102 | 26 | 320 | 2.39 | -0.09 |
4 | Street light | 30 | 32 | 138 | 102 | 23 | 325 | 2.40 | -0.08 |
5 | Drainage system | 25 | 24 | 120 | 132 | 27 | 328 | 2.45 | -0.03 |
UTFIa=2.48 (Mean) Source: Author Field Survey, 2024
5.5. Effect of Travel Stress on Civil Servants’ Well-being
Presented in the above
Table 5 is the analysis of the spread effects of travel stress on workers’ well-being in the study area. In order to answer the question of how frequent the effect is felt, respondents’ expressed their views using a five Likert scale of always, usually, sometimes, rarely and never. Workers’ responses were measured through an index called “Civil Servants’ Well-being Index” (CWI). The procedure for arriving at this index is similar to the one used in the above section. The mean index for the CWI is 3.11.
The analysis indicated that health challenges and sleeping on duty are the major effects of stress on the respondents in the study area with CWI of 0.15 and 0.13 above the mean and their mean deviation about the mean is positive. However, lateness to work, frustration and tiredness are not really attributed to stress in the study area because their mean is below the mean level and their mean deviation is negative.
Table 5. Effect of Travel Stress on Civil Servants’ Well-Being.
S/N | Impact | Strength of Effect | SWV | CWI | MD |
Always 1 | Usually 2 | Sometimes 3 | Rarely 4 | Never 5 |
1 | Health challenges | 170 | 84 | 87 | 56 | 14 | 411 | 3.26 | 0.15 |
2 | Sleeping on duty | 150 | 120 | 75 | 50 | 17 | 412 | 3.24 | 0.13 |
3 | Lateness to work | 175 | 52 | 81 | 48 | 27 | 383 | 3.00 | -0.11 |
4 | Frustration | 120 | 88 | 93 | 64 | 19 | 384 | 3.00 | -0.11 |
5 | Tiredness | 90 | 112 | 93 | 64 | 15 | 378 | 3.05 | -0.06 |
CWIa=3.11 (Mean) Source: Author Field Survey, 2024
5.6. Approaches to Reduction of Travel Stress on Civil Servant
Table 6. Approaches to Reduction of Travel Stress.
S/N | Approach / Strategy | Rating | SWV | ARTI | MD |
VH 5 | H 4 | JLW 3 | LW 2 | VLW 1 |
1 | Extension of the existing roads | 170 | 80 | 81 | 34 | 37 | 402 | 3.00 | 0.10 |
2 | Regulation of public transport services | 100 | 118 | 93 | 52 | 27 | 390 | 2.95 | 0.05 |
3 | Introduction of public mass transit | 105 | 112 | 102 | 48 | 25 | 392 | 2.95 | 0.05 |
4 | Improved road safety /Traffic management | 150 | 104 | 57 | 44 | 37 | 392 | 2.93 | 0.03 |
5 | Provision of transport facilities | 130 | 120 | 51 | 50 | 36 | 387 | 2.89 | -0.01 |
6 | Construction of new roads | 140 | 44 | 81 | 54 | 40 | 359 | 2.70 | -0.20 |
ARTIa=2.90 (Mean)
Source: Author Field Survey, 2024
The summary of the analysis presented in
Table 6 is the rating of the approach/strategy to be used in reducing the traffic stress in the study area. Respondents rate approach/strategy using a five Likert scale of very high, high, average, low and very low. Responses were measured through an index called “Approach to Reduction of Travel Index” (ARTI). To arrive at the ARTI weight value the procedure for arriving at this index is similar to the one used in the above section. Four of the approaches that can be applied to reduce traffic problem in the study area namely extension of existing roads, regulation of public transport, introduction of public mass transit and road safety / traffic management had a
ARTI greater than the

Their
ARTIS are 3.00, 2.95, 2.95, 2.93, 2.89 and 2.70 respectively and had a positive deviation about the mean. Provision of transport facilities and construction of the new roads had
ARTIs lower to the

and their respective deviations about the mean were negative. The result further revealed that respondents in the study area did not know the importance of provision of facilities which is very crucial to the reduction of traffic stress in the study area.
6. Conclusion and Recommendations
6.1. Conclusion
Stress is the sum total of all non-specific biological phenomena elicited by adverse external influences. Interestingly, it is a process through which environmental and institutional forces threatens people's well-being and existence; thus evoking from them various responses, as well as coping strategies or behavior directed towards the threat. Stress is serious business. According to the UK Health and Safety Executive over ten million working days were lost to work-related stress in the UK alone in 2010/2011. Work related travel is a stressful experience that will increasingly be studied in today’s global environment. The current study identified several correlates of travel stress, most notably the effects of travel on civil servants.
Our World is accelerating and as the demands placed upon many of us continue to increase, it's more important than ever to take steps to keep our rising stress levels in check. These results may help to develop a better understanding of the potential effects of travel on psychological health, as well as to guide organizations in taking pragmatic measures to reduce the risks of travel stress to their employees.
6.2. Recommendations
Based on the findings of this study, the following recommendations were proffered:
1) Provision/Improvement of Road Transport Facilities
In order to make urban transport attractive there is the urgent need to address the inconveniences and stress been experience at present. Short term solutions to the problems within the city include the introduction of better traffic controls particularly synchronized traffic signals; provision of better facilities for pedestrians and cyclists; construction of more parking spaces and an efficient and regular enforcement of traffic laws and regulations.
In the long term there is the need for a comprehensive urban transportation plan for Ibadan and its immediate region. Research should be geared towards the study of the existing patterns of activity in the city; the analysis of the road networks in terms of their capacity and utilization, trip patterns of the population and the various vehicles providing the means for circulation.
The governments should construct more urban link roads especially in the newly developing areas and maintain the existing ones to increases accessibility. Where governments cannot provide the facilities for intra-urban bus transit bus services themselves, then, they should subsidize those enterprises that have proved, beyond reasonable doubt that they can provide bus services. This will encourage private bus enterprise operators to ply more routes in the city as may be directed by the governments.
2) The Use of Mass Transit/Bus Priority
Provision of functional mass transit which offers good alternative to driving will help in moving more people than tax-cabs and mini-buses and the space occupied by smaller vehicles will be well reduced if larger buses are patronized. Also, resuscitation of reliable railway lines and buses in the city to enhance intermodal link with the roads should be integrated so as to reduce level of road patronage.
Observation during the research revealed that the present government in an attempt to reduce the travel stress being experienced by civil servants in Oyo State provided bus to convey workers. Yet the field survey revealed that the programme is not as effective as it supposed because many of the workers at times needed to wait in the sun for more than 30 minutes before buses convey them which signifies poor level of service.
Against this background, urban transport planning and management should be depoliticized and professionalized. Government should desist from using the transport sector as means of assisting and compensating political associates and friends, especially those not grounded in transport education. Transport is highly technical, dynamic and complex and so must not be handled by people without transport education.
3) Formulation of Policies/Implementation
Government at federal, state and local level should put in place policies to the following effects:
Creation of more parking spaces in the Local government.
Rehabilitation and expansion of roads.
Construction of drainage channels.
Removal of markets along road sides.
Government through Town Planning Authorities, should set and ensure that guide lines for erection of buildings and shops near the main roads in the city are complied with.
A law banning street trading should be set in motion and offenders should be tried to serve as deterrent to others.
Abbreviations
UTFI | Urban Transport Facilities Index |
WTFI | Weight Transport Facilities Index |
FLII | Factors Level of Impact Index |
ARTI | Approach to Reduction of Travel Index |
CWI | Civil Servants’ Well-being Index |
SWV | Summation of Weight Value |
ND | National Diploma |
NCE | Nigeria Certificate in Education |
BSC | Bachelor of Science |
MSC | Master of Science |
PhD | Doctor of Philosophy |
Conflicts of Interest
The authors declare no conflicts of Interest.
References
| [1] |
Adelekan, I. O., and Adebayo, W. O. (2021). Urban mobility challenges and commuting stress among workers in Ibadan, Nigeria. Journal of Transport and Land Use, 14(1), 345–360.
|
| [2] |
Adetunji, O., and Adeniran, A. (2020). Traffic congestion and productivity loss in Lagos megacity. African Cities Review, 8(2), 55–72.
|
| [3] |
Agyemang, E., and Prasad, P. (2022). Traffic congestion and worker stress in developing cities. Transport Policy, 117, 98–108.
|
| [4] |
Agyemang, E., and Yeboah, K. (2022). Commuting stress and worker productivity in Accra, Ghana. Transport Policy, 117, 98–108.
https://doi.org/10.1016/j.tranpol.2021.12.006
|
| [5] |
Amoako, C., and Cobbinah, P. B. (2021). Urban transport inequalities and commuter stress in African cities. Cities, 108, 102980.
https://doi.org/10.1016/j.cities.2020.102980
|
| [6] |
Atser, J., and Ezeani, E. (2022). Commuting patterns and occupational stress among government employees in Abuja, Nigeria. Nigerian Journal of Public Administration, 20(3), 112–129.
|
| [7] |
Carpenter, C., and Ghilarducci, T. (2023). Work–life spillover effects of commuting stress in urban labour markets. Work, Employment and Society, 37(1), 129–147.
https://doi.org/10.1177/09500170221085794
|
| [8] |
Chen, Y., He, L., and Chen, S. (2020). Traffic congestion, commuter stress, and employee well-being: Evidence from Chinese megacities. Transportation Research Part F: Traffic Psychology and Behaviour, 72, 35–47.
https://doi.org/10.1016/j.trf.2020.05.009
|
| [9] |
Deshmukh, M. (2023). Commuting stress and occupational health among office workers in Mumbai. Asia-Pacific Journal of Public Health, 35(2), 134–147.
|
| [10] |
Duarte, F., and Gonçalves, A. (2023). Commuting hardships and psychological strain in Latin American cities. Urban Studies, 60(8), 1521–1539.
https://doi.org/10.1177/00420980221144600
|
| [11] |
Eurofound. (2021). Working conditions and sustainable work: An analysis of commuting stress in Europe. Publications Office of the European Union.
|
| [12] |
Filani M. O. (1094). Transport. In Filani, M. O, F. O. Akintola and C. O Ikporukpo, (Eds), Ibadan Region, Ibadan; Rex Charles, pp: 179-190.
|
| [13] |
Hennessy, D. (2020). Commuting stress and job satisfaction among urban employees. Journal of Occupational Health Psychology, 25(4), 563–574.
|
| [14] |
International Labour Organization. (2022). Global report on occupational safety and worker well-being. ILO Publications.
|
| [15] |
International Transport Forum. (2023). Urban mobility trends and mobility-related stress. OECD Publishing.
|
| [16] |
Khan, S., Rahman, M., and Das, S. (2021). Public transport stress and worker productivity in South Asian cities. Journal of Transport Geography, 92, 103042.
|
| [17] |
National Airspace Research and Development Agency, 2013.
|
| [18] |
Ndetto, E., and Jimenez, A. (2021). Travel stress, gendered mobility, and safety concerns among women in Dar es Salaam. Journal of Transport Geography, 94, 103104.
|
| [19] |
Nyangoro, E., and Wafula, D. (2022). Commuter coping strategies and their effect on perceived travel stress in Nairobi. Transport Reviews, 42(3), 441–459.
https://doi.org/10.1080/01441647.2021.1933818
|
| [20] |
Oduwaye, L. (2022). Psychological outcomes of long commuting times in Lagos megacity. Journal of Urban Management, 11(2), 230–242.
|
| [21] |
Olawande, T., and Olusanya, A. (2023). Gendered experiences of commuting stress in Lagos megacity. Transportation Research Interdisciplinary Perspectives, 19, 100782.
|
| [22] |
Olawole, M., and Aloba, O. (2020). Urban commuting and stress among workers in Lagos. Nigerian Journal of Transport and Development Studies, 5(1), 76–89.
|
| [23] |
Oluwafemi, A., and Aluko, O. (2023). Transport infrastructure deficits and commuter well-being in Ibadan metropolis. Journal of African Urban Studies, 5(1), 76–95.
|
| [24] |
Omondi, P., and Agong, S. (2021). Congestion, commuting stress, and worker productivity in Nairobi. African Transport Journal, 3(1), 54–69.
|
| [25] |
Rahman, M., Chowdhury, S., and Khalid, M. (2022). Traffic congestion and psychological stress among urban commuters in Dhaka. Transportation Research Part D: Transport and Environment, 107, 103286.
https://doi.org/10.1016/j.trd.2022.103286
|
| [26] |
Sener, I., and Lee, R. (2021). Commuting stress and job performance among urban workers. Transportation Research Part F, 80, 235–247.
|
| [27] |
Sharifi, A., and Khavarian-Garmsir, A. (2021). Urban transport, environmental stressors, and well-being. Sustainable Cities and Society, 74, 103207.
|
| [28] |
Smith, H., Giovani, A., and Patel, R. (2023). Commuting, mental strain, and productivity loss in global cities. International Journal of Urban Sustainable Development, 15(2), 145–162.
|
| [29] |
United Nations-Habitat. (2021). The state of urban mobility in developing regions. UN-Habitat.
|
| [30] |
Wang, Y., Xu, T., and Li, J. (2022). Commuting stress, emotional exhaustion, and workplace outcomes: Evidence from Asian megacities. Journal of Transport and Health, 26, 101471.
|
| [31] |
World Bank. (2022). Urban transport and worker productivity: Global evidence on commuting stress. World Bank Publications.
|
| [32] |
World Health Organization. (2022). Urban stressors and occupational health: Global evidence and policy pathways. WHO Press.
|
| [33] |
Yamane, T. (1967). Statistics: An introductory analysis (2nd ed.). Harper and Row.
|
Cite This Article
-
APA Style
Ayorinde, A. J., Oloruntoba, A. A., Kolapo, S. O. (2026). The Impact of Urban Travel Stress on the Well-being and Job Efficiency of Civil Servants in Ibadan, Nigeria. Urban and Regional Planning, 11(2), 122-132. https://doi.org/10.11648/j.urp.20261102.13
 Copy
|
Copy
|
 Download
ACS Style
Ayorinde, A. J.; Oloruntoba, A. A.; Kolapo, S. O. The Impact of Urban Travel Stress on the Well-being and Job Efficiency of Civil Servants in Ibadan, Nigeria. Urban Reg. Plan. 2026, 11(2), 122-132. doi: 10.11648/j.urp.20261102.13
Copy
|
Download
AMA Style
Ayorinde AJ, Oloruntoba AA, Kolapo SO. The Impact of Urban Travel Stress on the Well-being and Job Efficiency of Civil Servants in Ibadan, Nigeria. Urban Reg Plan. 2026;11(2):122-132. doi: 10.11648/j.urp.20261102.13
Copy
|
Download
-
@article{10.11648/j.urp.20261102.13,
  author = {Adejare Jacob Ayorinde and Asiyanbi Adedolapo Oloruntoba and Samuel Olugbenga Kolapo},
  title = {The Impact of Urban Travel Stress on the Well-being and Job Efficiency of Civil Servants in Ibadan, Nigeria},
  journal = {Urban and Regional Planning},
  volume = {11},
  number = {2},
  pages = {122-132},
  doi = {10.11648/j.urp.20261102.13},
  url = {https://doi.org/10.11648/j.urp.20261102.13},
  eprint = {https://article.sciencepublishinggroup.com/pdf/10.11648.j.urp.20261102.13},
  abstract = {This paper examines the effect of travel-related stress on the work performance and well-being of civil servants in Ibadan, Nigeria. The study aims to assess the extent to which daily commuting conditions influence workers’ health, productivity, and overall job efficiency. The objectives are to identify the major travel stressors encountered by civil servants; evaluate the relationship between socio-economic characteristics and perceived stress; assess the condition of urban transport infrastructure and its contribution to stress; and determine the effects of travel stress on workers’ well-being and job performance. Primary data were obtained from 139 civil servants across selected ministries. Variables analysed include urban infrastructure condition indicators neighbourhood road quality, public transport condition, streetlight functionality, traffic flow, drainage condition, and bus-stop facilities, and stress impact indicators such as fever, headache, stomach disorder, cold, elevated body temperature, and body pain. Analytical tools employed include descriptive statistics and Likert scaling. Major stress-inducing factors identified include traffic congestion, poor road surfaces, queues at bus stops, and impatience among road users. The study concludes that travel stress remains a critical challenge affecting the physical well-being and job performance of civil servants in Ibadan. Recommendations include improving public transport services, rehabilitating and expanding road infrastructure, enforcing traffic management regulations, strengthening street lighting and drainage systems, and developing worker-oriented mobility policies such as synchronized mass transit services and priority lanes for civil servants. Implementing these measures will enhance accessibility, safety, affordability, and comfort within the intra-urban transport system, ultimately improving workplace productivity and overall quality of life for civil servants.},
 year = {2026}
}
Copy
|
Download
-
TY  - JOUR
T1  - The Impact of Urban Travel Stress on the Well-being and Job Efficiency of Civil Servants in Ibadan, Nigeria
AU  - Adejare Jacob Ayorinde
AU  - Asiyanbi Adedolapo Oloruntoba
AU  - Samuel Olugbenga Kolapo
Y1  - 2026/06/02
PY  - 2026
N1  - https://doi.org/10.11648/j.urp.20261102.13
DO  - 10.11648/j.urp.20261102.13
T2  - Urban and Regional Planning
JF  - Urban and Regional Planning
JO  - Urban and Regional Planning
SP  - 122
EP  - 132
PB  - Science Publishing Group
SN  - 2575-1697
UR  - https://doi.org/10.11648/j.urp.20261102.13
AB  - This paper examines the effect of travel-related stress on the work performance and well-being of civil servants in Ibadan, Nigeria. The study aims to assess the extent to which daily commuting conditions influence workers’ health, productivity, and overall job efficiency. The objectives are to identify the major travel stressors encountered by civil servants; evaluate the relationship between socio-economic characteristics and perceived stress; assess the condition of urban transport infrastructure and its contribution to stress; and determine the effects of travel stress on workers’ well-being and job performance. Primary data were obtained from 139 civil servants across selected ministries. Variables analysed include urban infrastructure condition indicators neighbourhood road quality, public transport condition, streetlight functionality, traffic flow, drainage condition, and bus-stop facilities, and stress impact indicators such as fever, headache, stomach disorder, cold, elevated body temperature, and body pain. Analytical tools employed include descriptive statistics and Likert scaling. Major stress-inducing factors identified include traffic congestion, poor road surfaces, queues at bus stops, and impatience among road users. The study concludes that travel stress remains a critical challenge affecting the physical well-being and job performance of civil servants in Ibadan. Recommendations include improving public transport services, rehabilitating and expanding road infrastructure, enforcing traffic management regulations, strengthening street lighting and drainage systems, and developing worker-oriented mobility policies such as synchronized mass transit services and priority lanes for civil servants. Implementing these measures will enhance accessibility, safety, affordability, and comfort within the intra-urban transport system, ultimately improving workplace productivity and overall quality of life for civil servants.
VL  - 11
IS  - 2
ER  -
Copy
|
Download