Research Article | | Peer-Reviewed

Assessment of Recharge Dynamics Under Extreme Rainfall Using Groundwater Fluctuations and Stable Isotopes Signatures: Insights from an Urban Observatory in Dakar

Received: 28 August 2025     Accepted: 10 September 2025     Published: 25 September 2025
Views:       Downloads:
Abstract

Rapid urbanization across sub-Saharan Africa intensifies water supply challenges, making groundwater an essential resource for meeting the needs of low-income urban communities. However, the recurrence of extreme rainfall events due to climate change present major challenges for sustainable groundwater management, particularly in urban areas where infrastructures often impedes natural recharge processes and simultaneously amplifies flood risks. Here we investigate the recharge dynamics of the Thiaroye quaternary sand aquifer in Dakar, Senegal, under extreme rainfall conditions, based on high resolution monitoring of groundwater fluctuations and stable isotope analysis. The study combines high-frequency hydrological data from the Dakar suburban groundwater observatory, with isotopic signatures (δ18O and δ2H) to trace recharge processes and contamination risks. Results indicate that high to extreme rainfall events (>10 mm.d-1) are the primary drivers of groundwater level fluctuations, with an identified threshold of approximately 9 mm needed for effective recharge. The isotopic analysis confirms consistent recharge conditions primarily influenced by local rainfall despite substantial variability in precipitation isotopic composition. This research underscores the critical need for improved groundwater management strategies to enhance urban resilience against extreme climatic events such as heavy to extreme rainfall, bridging the knowledge gap regarding groundwater recharge mechanisms in rapidly urbanizing areas like Dakar.

Published in Journal of Water Resources and Ocean Science (Volume 14, Issue 5)
DOI 10.11648/j.wros.20251405.11
Page(s) 118-133
Creative Commons

This is an Open Access article, distributed under the terms of the Creative Commons Attribution 4.0 International License (http://creativecommons.org/licenses/by/4.0/), which permits unrestricted use, distribution and reproduction in any medium or format, provided the original work is properly cited.

Copyright

Copyright © The Author(s), 2025. Published by Science Publishing Group

Keywords

Urban Groundwater, Recharge, Isotopes, Rainfall Events, Groundwater Fluctuations, Flooding, Dakar

1. Introduction
In sub-Saharan Africa (SSA), rapid urbanization due to population growth in large cities places increasing pressure on urban water supply systems, exacerbating vulnerability to climate variability and extreme events . Limited access to piped water across many cities of the region increase dependence on informal or self-supply systems, with groundwater as a vital source of domestic water . Thus, groundwater resources offer strategic advantages for urban resilience owing to the relative ability to mitigate short-term climate change, lower treatment requirements, and availability beneath the low income densely communities . Nevertheless, despite its inherent resilience, urban groundwater resources are increasingly threatened by excessive extraction, contamination from on-site sanitation systems, and inadequate land-use planning, particularly within informal settlements . It is therefore essential to strengthen groundwater monitoring and management to ensure sustainable and climate-resilient urban water security in sub-Saharan African cities.
In recent decades, climate trends have demonstrated an increase in both the frequency and intensity of extreme precipitation events throughout sub-Saharan Africa. This phenomenon is attributed to ongoing climate change and presents substantial challenges to urban water management . Such extreme events can lead to rapid infiltration and recharge of urban aquifers, but the groundwater response remain poorly understood, particularly in rapidly urbanizing regions with complex hydrological settings . In Dakar, Senegal, intense rainfall coupled with inadequate urban drainage infrastructure has resulted in episodic groundwater flooding and altered recharge dynamics, highlighting the vulnerability of urban aquifers to both climatic and anthropogenic pressures . The combined effects of increased rainfall variability and urban land use changes introduce uncertainties in predicting groundwater recharge rates, recharge pathways, and the potential for groundwater contamination during extreme events . Understanding these processes is critical to improving groundwater management and enhancing urban resilience for sustainable cities under changing climate conditions.
Although climate-related changes in urban water systems are well documented, there is still limited understanding of how extreme rainfall events affect groundwater recharge. This issue is particularly pressing in low-income urban environments like Dakar. Prior studies in SSA often lack high-resolution hydrogeological data and urban infrastructure frequently overrides natural recharge pathways, making process understanding complex . In the Thiaroye aquifer of Dakar suburb, investigations combining water-table fluctuation, chloride mass balance, and environmental isotopes were conducted to quantify groundwater recharge and identify sources. These studies found annual recharge rates ranging from ~18 to 144 mm but highlighted substantial uncertainty tied to waste-derived chloride interference and inconsistent monitoring . The isotopic approach revealed that the isotopic signatures of precipitation influence those of groundwater, thus highlighting their meteoric origin . However, uncertainties persist in Dakar regarding seasonal variabilities and controls on δ18O and δ2H in rainfall. More recently, the AfriWatSan urban observatory in Dakar has provided high-frequency observations showing that extreme rainfall events trigger rapid increases in soil moisture and groundwater levels, alongside episodic flushing of nitrate contamination from adjacent septic systems into shallow aquifers . However, these insights remain preliminary and the precise mechanisms, volumetric contributions, and spatiotemporal variability of extreme-event recharge in highly urbanized, are still poorly constrained. As a result, models and groundwater resources management strategies operate under considerable uncertainty, underscoring the need for more detailed, long-term, isotope-informed recharge monitoring in Dakar and similar SSA urban settings.
This study aims to assess the Dakar urban aquifer response to extreme rainfall events by combining stable isotope analysis with long-term hydrological monitoring data from an urban groundwater observatory. By tracing the isotopic signatures (δ18O and δ2H) of precipitation, surface and groundwater during and after high-intensity rainfall events, the research seeks to identify recharge pathways, estimate recharge timing, and detect potential contamination processes. The integration of high-frequency precipitation and groundwater fluctuation measurements, unsaturated zone matrix data and stable isotope tracers enable a more precise understanding of the short-term reactivity of the aquifer to extreme climatic inputs. Focusing on the Thiaroye suburban area, highly exposed to both flooding and groundwater stress, the study also examines how land use, surface sealing, and on-site sanitation influence recharge dynamics. Ultimately, the objective is to generate actionable insights for improving urban groundwater management and resilience for sustainable city in the face of intensifying climate extremes.
2. Material and Methods
2.1. Local Setting
The study area covers the suburban Dakar peninsula, located at the western part of Africa (Figure 1). The region is characterized by a semi-arid Sahelian climate marked by a short rainy season from July to October with mean annual precipitation ranging between 450 and 500 mm; annual temperatures varies between 21 and 29°C . Evidence from recent decades indicates both substantial interannual fluctuations and a growing frequency of extreme rainfall events . The relief is shaped by depressed dunes where three hydrogeological units are identified: (1) the lakes area to the north, (2) Niayes area or closed dune depressions to the west and (3) dune area which covers most of the region. The suburban Dakar observatory is underlain by the Thiaroye Quaternary sand aquifer, known as an unconfined, highly permeable and shallow groundwater system. Quaternary deposits of the reservoir comprised mainly unconsolidated clayey sands, coarse sands, and aeolian sands that form the Ogolian dunes in the coastal zone and are underlain by Eocene marl to clay formations which outcrop in the south . Recharge is generally attributed to the direct infiltration from rainfall or additional sources such as wastewater and irrigation waters that contaminate the groundwater . The unsaturated zone matrix is comprised mainly of fine to medium sand fractions, with only 0–2% clay (Figure 2).
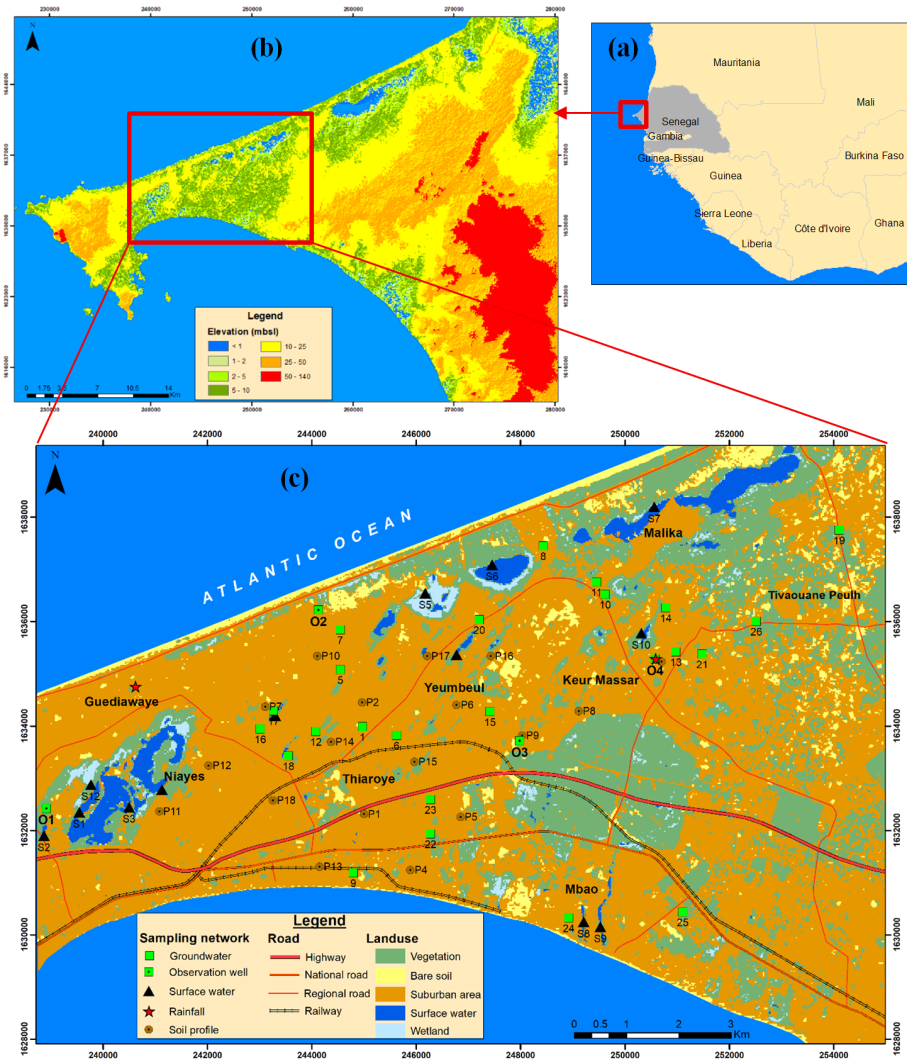
Figure 1. Series of maps showing the locations respectively of (a) Senegal, (b) Cap-Vert Peninsula, and (c) Keur Massar in suburban Dakar.
2.2. Monitoring and Sampling Strategy
2.2.1. Soil Sampling
Undisturbed soil sampling was carried out from 18 locations across the study area. Samples of 100 ml (cm3) were taken with an Eijelkamp soil sample ring kit auger each 50 cm from the soil surface to the capillary fringe. Samples were then oven dried at the Universite Cheikh Anta Diop hydrochemistry laboratory to determine the total porosity and bulk density (by gravimetric method), as well as soil texture by the hydrometer experimentation (Table 1).
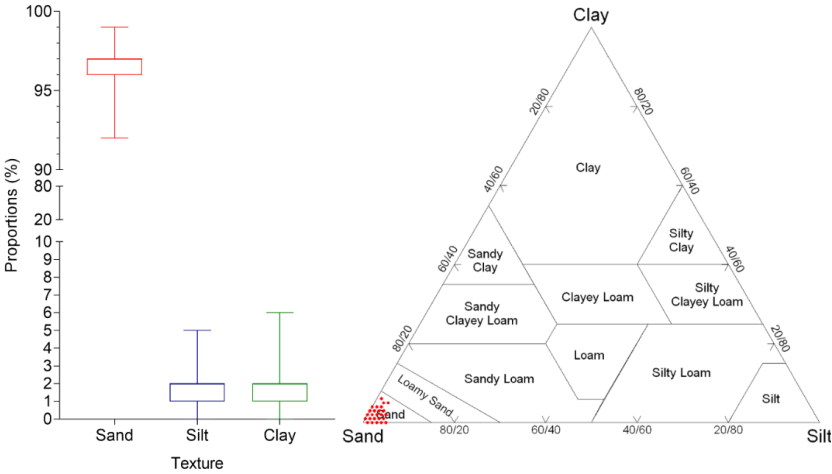
Figure 2. Particle size distribution (a) Sand, Silt and Clay proportions; (b) United States Department of Agriculture (USDA) texture classification of soil samples (N=145).
Table 1. Bulk density and total porosity from unsaturated zone of quaternary sand aquifer.

Profile

Bulk density (g.cm-3)

Total porosity

Min.

Max.

Mean

Min.

Max.

Mean

P 1

1.59

1.68

1.62

0.37

0.40

0.39

P 2

1.52

1.70

1.61

0.36

0.43

0.39

P 3

1.46

1.71

1.60

0.36

0.45

0.39

P 4

1.45

1.67

1.60

0.37

0.45

0.39

P 5

1.50

1.65

1.59

0.38

0.43

0.40

P 6

1.41

1.81

1.59

0.32

0.46

0.38

P 7

1.57

1.77

1.67

0.33

0.41

0.37

P 8

1.62

1.68

1.65

0.37

0.39

0.38

P 9

1.59

1.68

1.64

0.37

0.40

0.38

P 10

1.54

1.71

1.65

0.35

0.42

0.38

P 11

1.59

1.73

1.67

0.35

0.40

0.37

P 12

1.43

1.70

1.62

0.36

0.46

0.39

P 13

1.59

1.70

1.66

0.36

0.40

0.37

P 14

1.50

1.75

1.66

0.34

0.43

0.37

P 15

1.53

1.77

1.68

0.33

0.42

0.37

P 16

1.65

1.70

1.67

0.36

0.38

0.37

P 17

1.68

1.72

1.70

0.35

0.37

0.36

P 18

1.67

1.72

1.70

0.35

0.37

0.36

2.2.2. Rainfall and Groundwater Monitoring
Rainfall monitoring was conducted using a Lambrecht tipping bucket rain gauge (Lambrecht meteo, Germany) installed in the Keur Massar area. High-resolution data were collected from 2018 to 2022 using hourly measurements to capture short-term variability in hydrological conditions. These detailed time series were subsequently processed and aggregated to generate daily, monthly, and annual datasets, providing a comprehensive temporal overview of rainfall variability over the 5-years monitoring period. The daily rainfall data were categorized based on the classification proposed by Zhou and Zhao (2021). Table 2 presents the main rainfall intensity classifications commonly used in the literature.
Water table fluctuations (WTF) were monitored using submersible pressure transducers across multiple observation piezometers. Rugged Troll 100 sensors (In-Situ Inc.) were deployed in piezometers O1, O2 and O4 while an AquaTROLL 100 sensor (In-Situ Inc.) was installed in O3. Daily measurements were recorded at O1, O2, and O3 between May 6, 2017, and February 11, 2021. In addition, high-resolution monitoring at an hourly time step was conducted at O4 over a nine-month period, from March 31 to December 31, 2022. These instruments recorded continuous pressure head data, providing valuable insights of groundwater flow under variable climatic and urban conditions. Figure 3 shows the piezometric map for 2020 with the locations of the various observation piezometers. Monitoring of groundwater fluctuations covers the low-lying areas of Niayes (O1) and Keur Massar (O4), the coastal area (O2), and the piezometric dome (O3). Table 3 describes the configuration of the piezometers and the monitoring system.
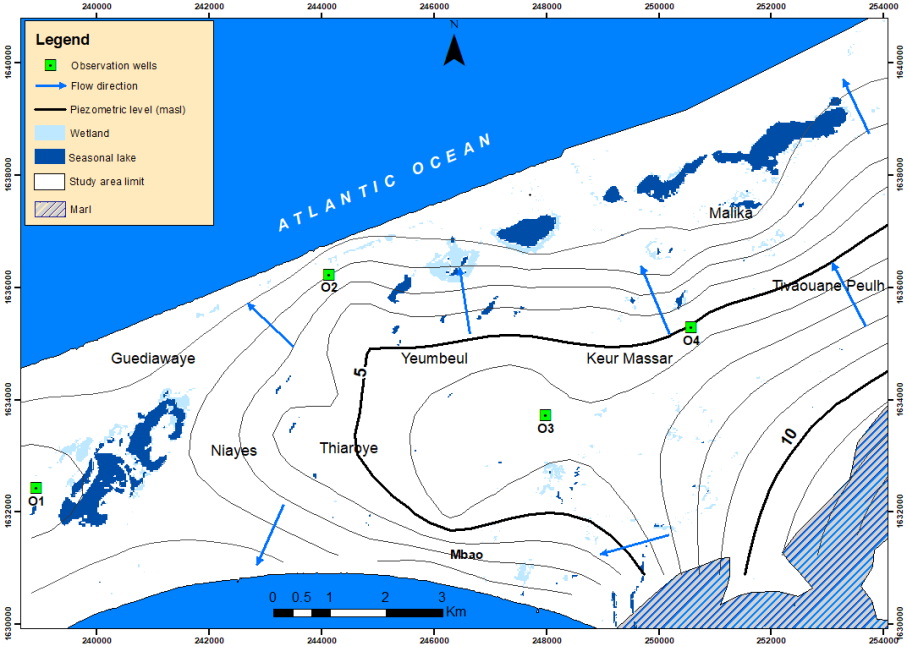
Figure 3. Observation wells location and piezometric map of the Thiaroye urban aquifer in September 2017.
Table 2. Daily rainfall classification derived from the literature.

Aronica et al., 2013

OMM, 2018

Zhou et Zhao, 2021

Intensity (I) (mm.day-1)

Description

Intensity (I) (mm.day-1)

Description

Intensity (I) (mm.day-1)

Description

0.1 ≤ I < 4

Light

I< 2.5

Light

0.2 ≤I < 10

Normal

4 ≤ I < 6

Light/Moderate

2.5 ≤I < 10

Moderate

10 ≤I < 20

Heavy

6 ≤ I < 32

Moderate/Heavy

10 ≤I < 50

Heavy

I≥20

Extreme

32 ≤ I < 64

Heavy

I≥50

Heavy/Torrential

64 ≤ I < 128

Heavy/Torrential

I ≥128

Torrential

2.2.3. Rainfall, Surface Water and Groundwater Sampling
Water samples for stable isotopes analysis were collected during field campaigns in 2017 and 2019 from rainfall, surface water and groundwater. Rainfall samples were collected using a homemade precipitation collector developed to minimize any residual evaporation to an insignificant level for precipitation samples collected over a 1-month period. Groundwater samples were collected in July 2017 and November 2019 from boreholes, piezometers and hand-pumped wells. Samples from piezometers and hand-pumped wells were collected after purging with a submersible pump until stable measurements of pH and electrical conductivity (EC) were achieved. Additionally, surface water was collected in November 2019 from seasonal lakes and retention ponds distributed across the study area. Monthly rainwater was sampled between August and October 2019 at the meteorological stations of Keur Massar and Guediawaye. All samples were filtered (0.22-μm membrane) to remove suspended particles, stored in 50 mL polyethylene bottles, and tightly sealed to prevent evaporation, for the analysis of stable water isotopes (δ2H and δ18O).
2.3. Analytical Methods
Stable-isotope ratios of O and H in samples collected in 2017 and 2019 were analysed by a commercial laboratory, Elemtex Limited (UK). δ18O and δ2H compositions are reported in the conventional ‰ notation referenced to the V-SMOW. The analytical reproducibility is ±0.1‰ for the oxygen and ± 1.0 ‰ for deuterium. The equation from was used to calculate the δ values is:
δ=RsRv-SMOW-1×1,000(1)
where RS represents either the or the 18O/16O or the 2H/1H ratio of the sample, and RV-SMOW is either the 18O/16O or the 2H/1H ratio of the V-SMOW. A total of 71 samples were analysed from rainfall, surface water and groundwater.
Table 3. Geometric configuration of piezometers and pressure head sensor installation.

Piezometer ID

Total depht (cm)

Screened depht (cm)

Sensor position (cm)

Measurement timestep

Monitoring time

O1

2500

1800 - 2200

856

Daily

2017 - 2022

O2

2600

1900 - 2300

823

Daily

2017 - 2020

O3

2500

1800 - 2200

733

Daily

2017 - 2020

O4

1500

900 - 1100

793

Hourly

2022

3. Results
3.1. Rainfall Patterns and Extreme Events
Rainfall data recorded at the Keur Massar meteorological station between 2018 and 2022 show strong interannual and seasonal variability, typical of the Sahelian climate. Total annual precipitation ranged from 238 mm in 2021 to 767 mm in 2022, with a peak occurring between August and September (Figure 4). The rainy season typically extends from June to October and indicates a unimodal pattern with maximum rainfall recorded in August (2020 = 232 mm; 2021 = 125 mm) and September (2018 = 113 mm; 2019 = 227 mm; 2022 = 270 mm).
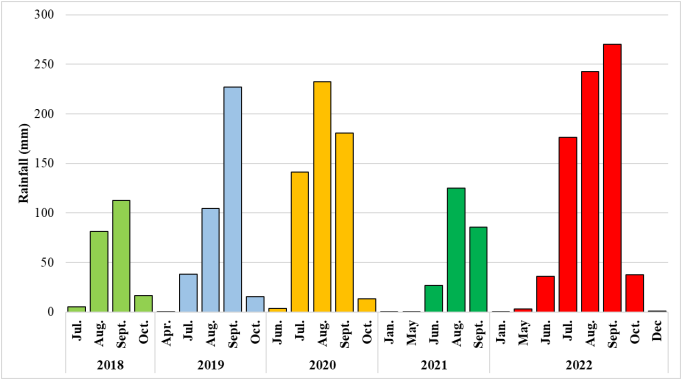
Figure 4. Monthly rainfall variation at the experimental site from 2018 to 2022.
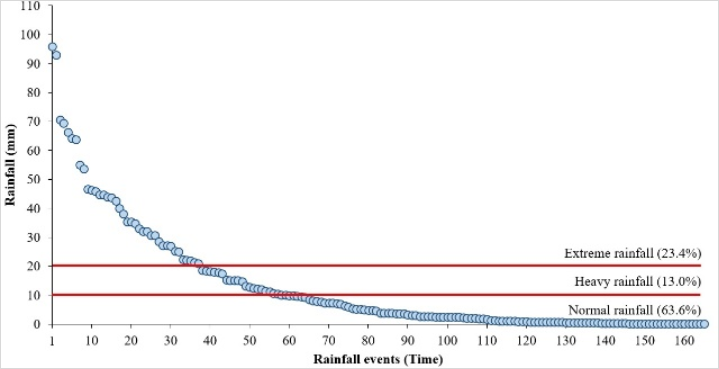
Figure 5. Classification of the past 5-years rainfall distribution in the study area.
Figure 5 presents the classification of rainfall distribution over the past 5-years (from 2018 to 2022) in the urban observatory following classification. During the monitoring period, a total of 166 rainfall events were detected. Normal rainfall events (> 10 mm) are the most frequently observed, accounting for 63% of all recorded occurrences. Within this category, over half of the events have intensities below 2 mm, indicating a predominance of low-intensity precipitation. These light rainfall events are rapidly lost to evaporation and do not contribute to groundwater recharge. High to extreme rainfall (≥ 10 mm) account for 37% of rainfall events, with extreme rainfall (≥ 20 mm) being the most prevalent, observed in 24% of all cases. The rapid infiltration of precipitation caused by these extreme events reaching up to 90 mm, is largely responsible for the sharp rise in groundwater levels and the flooding observed in the study area.
Figure 6 shows daily rainfall patterns in urban observatory from 2020 to 2022, focusing on event duration and intensity. A similar trend is observed in 2020 and 2022 (51 and 50 days, respectively), but 2022 experienced significantly longer in term of duration (213 hours vs. 165 hours) and more intensive (767 mm vs. 570 mm). In contrast, 2021 was notably drier, with only 21 rainy days, a total duration of 72 hours, and a cumulative rainfall of 296mm. Short-duration rainfall events (≤1 hour) accounted for 30% to 48% of total events depending on the year, generally associated with low to moderate intensities (up to 13.2 mm in 2020). Medium-duration events (1–5 hours) were most frequent in 2022 (44%), with intensities reaching up to 35.2 mm. Long-duration rainfall events (≥5 hours) represented 20% to 32% of events and produced the highest recorded intensities, including a peak of 95.8 mm in 2022. The interannual comparison highlights significant variability, with 2022 showing a marked increase in both rainfall duration and intensity.
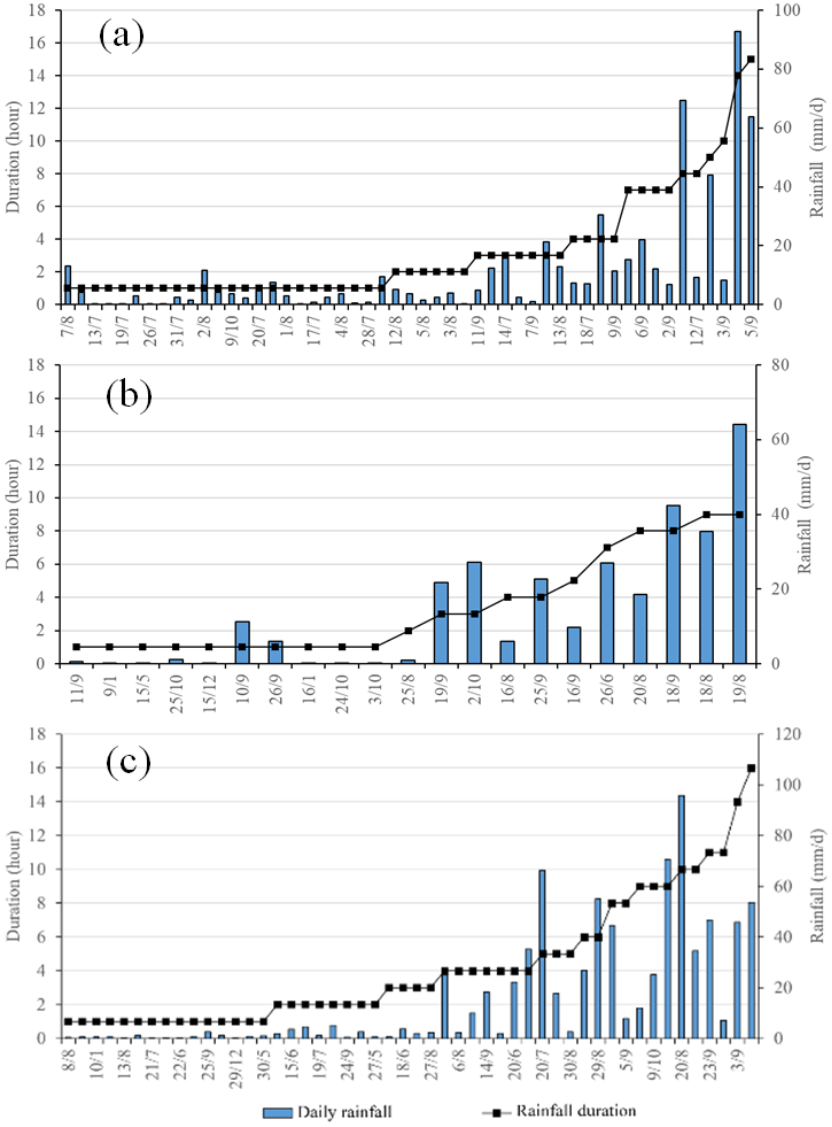
Figure 6. Daily rainfall intensity and duration in (a) 2020, (b) 2021, and (c) 2022.
3.2. Groundwater Response to Extreme Rainfall Events
Figure 7 presents the results of the daily WTF in piezometers O1, O2, and O3. A general observation reveals synchronous groundwater response during the rainy season, reflecting diffuse recharge processes across the study area. The rapid response of the groundwater table in the urban context of Thiaroye is undoubtedly linked to the intensity of rainfall, but also to physical characteristics such as the relatively flat topography, the sandy texture of the soils (porosity: 0.36 – 0.40) that imparts high permeability, and the shallow nature of the aquifer. Groundwater appears especially close to the surface in the piezometric dome zone (O3), where depths range between 70 and 200 cm. In the Niayes area (O1), groundwater depths vary between 257 and 369 cm, while in the coastal zone (O2), groundwater table is deeper (473 to 543 cm). Overall, the hydrographs show an important rise from July to October, with amplitudes strongly influenced by rainfall. In O1, observed rises were 54.3 cm in 2018, 76.3 cm in 2019, 68.4 cm in 2020, and 64.6 cm in 2022. In O2, the WTF magnitudes are less pronounced (2019: 49.8 cm; 2020: 63.3 cm). In O3 observation well, the magnitudes were higher (2017: 85.5 cm), 2019: 92.7 cm; 2020: 96.7 cm).
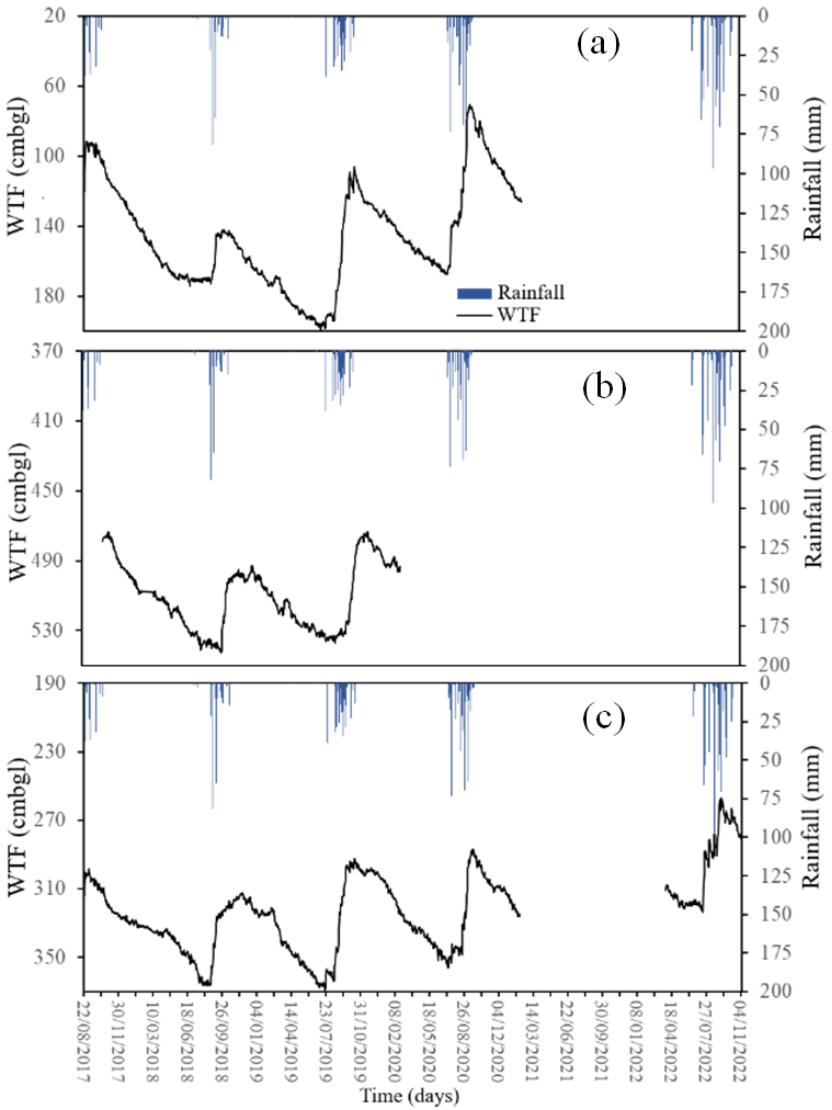
Figure 7. Monitoring of daily WTF at the groundwater observatory: (a) dome area (O3); (b) northern coastal zone (O2) and Niayes zone (O1).
Groundwater rise is followed by a longer recession period, which begins a few days after the end of the monsoon. The groundwater level gradually declines across all piezometers, with an average rate ranging between 1 and 2 cm per day. This decrease is reflected in the recession slopes, which vary depending on the location. In the piezometric dome where deep drainage is generally more active, high recession slopes occurs, particularly during wetter years (2017: 0.31: 2020: 0.35). In contrast, the Niayes zone exhibits low slopes, ranging from 0.15 to 0.24. Similarly, in the coastal zone, the recession trend mirrors that of the Niayes, with slopes between 0.16 and 0.19, suggesting slower drainage compared to the dome area. During recession periods, short-term episodic groundwater rises were occasionally observed in monitoring piezometers. These local fluctuations generally occur with low amplitudes and were shaped by the specific hydrological context of each zone. However, in 2019, a distinct groundwater level increase was recorded from February to March, observed across all piezometers but with varying amplitudes: highest in the coastal zone (8.9 cm), and lower in the dome (5.6 cm) and Niayes (4.7 cm) areas.
Figure 8 shows the temporal variability of WTF and rainfall intensity over a nine-month period (March to December 2022), based on high-resolution (hourly) monitoring conducted at piezometer O3. During the dry season (April to mid-July), groundwater levels remained relatively stable around 310 cm below ground level, reflecting an absence of significant recharge. Notably, a rainfall event delivering 15 mm within one hour occurred in late June but did not induce any appreciable change in groundwater level. This suggests that the event was insufficient to overcome the initial soil moisture deficit or that rapid losses via evapotranspiration dominated under the dry antecedent conditions.
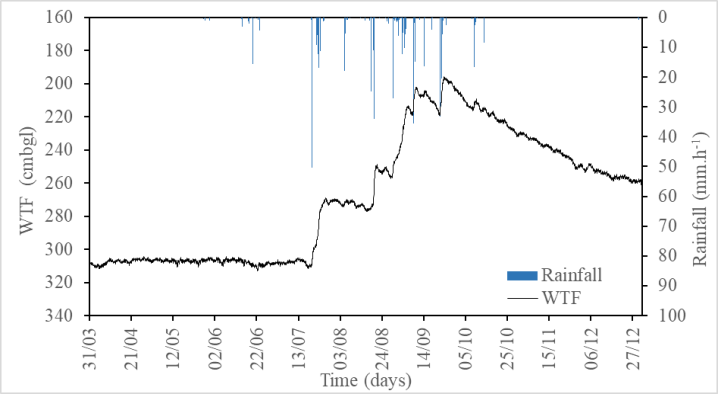
Figure 8. Groundwater level evolution from March 31 to December 31, 2020, at the observation well O4.
With the onset of the monsoon in mid-July, the frequency and intensity of rainfall events increased, inducing a distinct and progressive rise in the groundwater table. The high-resolution hydrograph from piezometer O3 exhibits stepped increases closely aligned with individual high-intensity rainfall events. The magnitude of these rises ranged from 2 to 20 cm and depended on the rainfall intensity and duration. This synchronous behavior highlights the occurrence of diffuse recharge processes throughout the study area. The peak in groundwater level, observed in late September (196 cm), is followed by a gradual recession, suggesting the cessation of recharge and the influence of drainage or groundwater abstraction.
A comprehensive analysis was conducted to assess the groundwater table response to rainfall events observed during the monitoring period. Table 5 lists the magnitudes of groundwater level rise following individual rainfall events. The findings reveal a more significant aquifer response to short-duration and high to extreme rainfall. For example, the event of July 20th generated 66.2 mm over 4 h and resulted in a groundwater level increase of 13.8 cm.
The relationship between rainfall intensity and groundwater response (GWR) was further examined through linear regression analysis, as illustrated in Figure 9. A strong positive correlation is observed between the rainfall event intensity and the corresponding groundwater response (R2= 0.85). The results reveal that rainfall intensity is a key factor in groundwater recharge dynamics in the study area. The linear regression model, expressed as GWR = 0.22P – 1.88, highlights the sensitivity of the aquifer system to high intensity rainfall. This indicates that the aquifer response threshold is close to 9 mm of precipitation.
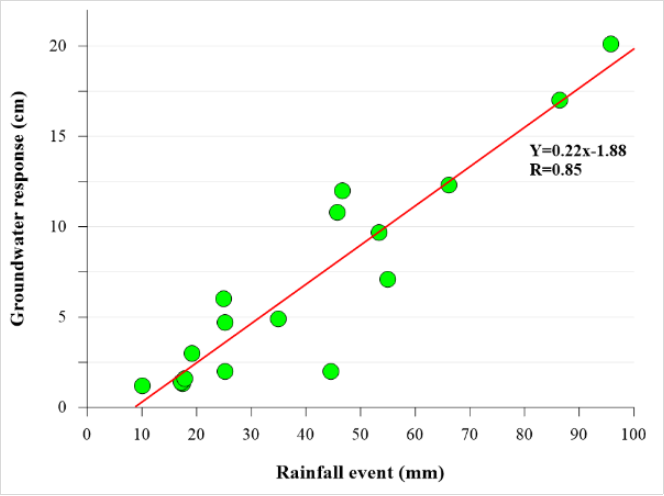
Figure 9. Relationship between groundwater response and rainfall event intensity in 2022.
3.3. Tracing of Source Waters and Recharge Processes
The isotopic composition δ18O and δ2H of groundwater samples collected in July 2017 and November 2019 exhibits a narrow range of variation across the monitoring periods (Table 4). In July 2017, the δ2H values ranged from –33.34‰ to –10.08‰, with a mean of –23.45‰, whereas the δ18O values varied between –5.04‰ and –0.39‰, averaging –2.94‰. Similar ranges were observed in November 2019, with δ2H values spanning from –33.8‰ to –6.9‰ (mean: –22.39‰) and δ18O values ranging from –5.2‰ to –0.11‰ (mean:–2.85 ‰). The observed similarity in mean values between 2017 and 2019 suggests that the isotopic composition of groundwater remains relatively stable over time. Rainfall samples collected between July and August 2019 exhibited a wide range of isotopes. δ2H values varied from –35.30‰ to –17.80‰, with a mean of –29.32‰, while δ18O values ranged from –5.84‰ to –3.19‰ (mean: –4.57‰). These values are generally more depleted than those observed in groundwater, particularly for δ18O, indicating that rainfall delivers a relatively depleted isotopic signature to the aquifer. Surface water exhibited enriched isotopic signatures compared to groundwater and rainfall, with δ2H ranging from –22.6‰ to 23.3‰ (mean: 6.44‰) and δ18O from –3.6‰ to 6.1‰ (mean: 1.83‰). The significant enrichment and wide range suggest strong evaporative effects on surface water bodies, which is typical in semi-arid to arid settings.
Table 4. Variation of δ2H and δ18O in rainfall, surface water and groundwater in 2017 and 2019.

Variables

Min

Max

Mean

SD

2017

Groundwater in July (N= 26)

δ2H (V-SMOW)

-33.34

-10.08

-23.45

7.69

δ18O (V-SMOW)

-5.04

-0.39

-2.94

1.48

2019

Rainfall from July to August (N= 6)

δ2H (V-SMOW)

-35.30

-17.80

-29.32

7.84

δ18O (V-SMOW)

-5.84

-3.19

-4.57

1.12

Groundwater in November (N= 27)

δ2H (V-SMOW)

-33.8

-6.9

-22.39

8.31

δ18O (V-SMOW)

-5.2

-0.11

-2.85

1.50

Surface water in November (N= 12)

δ2H (V-SMOW)

-22.6

23.3

6.44

14.80

δ18O (V-SMOW)

-3.6

6.1

1.83

3.22

The δ2H–δ18O relationships for groundwater, surface water, and rainfall samples are shown in Figure 10. Rainfall data regress along a Local Meteoric Water Line (LMWL), δ2H = 7.3 δ18O + 5.1 (R2 = 0.98), similar to a previously computed LMWL by , δ2H = 7.4 δ18O + 5.6 (R2 = 0.99). The isotopic signature of rainfall data is much less depleted in October (δ2H = -3.19‰; δ18O = -17.80‰), coinciding with the predominance of low-intensity rainfall events and highlighting the amount effect. Groundwater samples collected in 2017 (n = 26) and 2019 (n = 27) plot along regression lines with similar slopes (5.4 and 5.2, respectively) and high coefficients of determination (R2 = 0.98 and 0.94). These slopes are significantly lower than those of the Local Meteoric Water Line, suggesting evaporative enrichment of groundwater prior to or during recharge. Surface water samples (n = 12) display a regression slope of 4.85 (R2 = 0.94), which is even lower than that of groundwater, and exhibit more enriched isotopic signatures, indicative of strong evaporation effects. The close alignment of rainfall and groundwater data suggests interconnection, with isotopic compositions controlled primarily by rainfall inputs and subsequent evaporation.
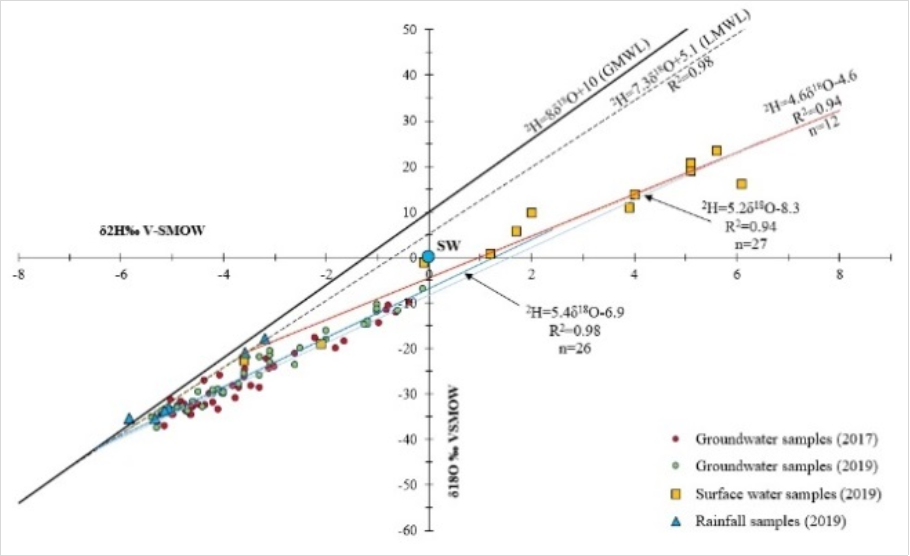
Figure 10. δ2H vs. δ18O values of surface water, groundwater collected in 2017 and 2019 and rainwater compared to the Global Meteoric Water Line.
4. Discussion
The present study shows that groundwater dynamics in the Dakar suburban observatory are influenced by rainfall variability. The predominance of episodic normal rainfall events (<10 mm day⁻1) suggests that a significant portion of the annual precipitation is likely lost to evaporation or contributes primarily to soil moisture replenishment rather than groundwater recharge. This finding confirms previous studies in semi-arid environments, where low-intensity rainfall is generally insufficient to overcome antecedent soil moisture deficits and reach the groundwater table . In contrast, extreme rainfall (> 20 mm. d-1) events, often exceeding 90 mm.d-1, are likely the primary drivers of the sharp groundwater level rises and localized flooding observed in the study area. Such observations are consistent with other findings from Sahelian and urban contexts, where high-intensity rainfall events dominate recharge dynamics and generate sufficient infiltration to bypass evapotranspiration losses . The interannual variability in rainfall duration and intensity, particularly the exceptional conditions recorded in 2022 (Table 5), has significant implications for both groundwater recharge potential and urban flood. Climate projections for the Sahelian regions suggest that extreme rainfall events may become more frequent and intense under ongoing climate change, thereby amplifying these risks . Understanding how these events control recharge processes is thus critical for developing adaptive groundwater management strategies in highly urbanized settings such as Dakar, where groundwater resources are essential for water supply and are increasingly vulnerable to climate variability and pollution.
Table 5. Relationship between rainfall events (intensity and duration) and groundwater response at O4 in 2022.

Date

Rainfall duration

Groundwater level response (cm)

Rainfall (mm)

Day

Hour

20-07

4

12.3

66.2

22 to 24-07

26

17

86.4

24-07

3

1.3

17.4

05-08

8

2

44.6

18-08

3

2

25.2

20 to 21-08

10

20.1

95.8

29-08

6

7.1

55

31-08 to 01-09

20

3

19.2

03-09

14

10.8

45.8

04-09

4

6

25

09-09

6

9.7

53.4

09-09

3

1.4

17.2

14-09

3

1.6

17.8

22-09

3

4.9

35

23-09

11

12

46.6

09-10

9

4.7

25.2

14-10

4

1.2

10

The identification of a rainfall threshold of approximately 9 mm for effective groundwater recharge has critical implications for urban flood risk and water security in the study area. In highly urbanized settings such as Dakar, intense rainfall events susceptible to generate consistent recharge are also those most likely to trigger surface runoff and flooding due to the prevalence of impervious surfaces and insufficient drainage infrastructure . Consequently, groundwater recharge and flood generation processes are intimately linked, and extreme events can simultaneously cause sharp groundwater level increases and severe urban flooding. This dual effect threatens water security by increasing the vulnerability of shallow aquifers to faecal contamination, thereby compromising groundwater quality . These findings underscore the urgency of advancing Sustainable Development Goal (SDG) 11, which aims to make cities inclusive, safe, resilient and sustainable. Strengthening urban planning, improving flood control infrastructure, and safeguarding aquifer recharge zones are essential for enhancing urban resilience to extreme hydrological events and protecting groundwater resources on which millions of urban residents depend for drinking water.
The isotopic data reveal a relatively stable δ2H and δ18O compositions of groundwater across both sampling campaigns in 2017 and 2019, suggesting limited temporal variability in recharge sources or processes. This stability in groundwater isotope signatures, despite the high variability observed in rainfall isotopic composition, indicates consistent recharge conditions governed primarily by rainfall inputs. Rainfall samples displayed more depleted values, particularly for δ18O, which is characteristic of meteoric origin, whereas surface water exhibited substantially more enriched and variable isotopic signatures. This enrichment is indicative of significant evaporative processes, a common feature in surface water bodies exposed to high evapotranspiration in semi-arid urban environments . The regression slopes of groundwater samples (5.4 in 2017 and 5.2 in 2019) are notably lower than the Local Meteoric Water Line (LMWL) derived from rainfall (slope = 7.3), highlighting the influence of evaporation prior to or during infiltration. This pattern is further corroborated by the even lower slope (4.8) observed in surface water samples, suggesting more advanced evaporative enrichment. Such isotopic divergence between the LMWL and groundwater is often interpreted as a signature of evaporation under arid or semi-arid conditions, where infiltration may occur after surface retention and partial evaporation . The close isotopic alignment between rainfall and groundwater samples supports the interpretation that local rainfall is the dominant source of recharge in the Thiaroye aquifer system, rather than surface water contribution. Furthermore, the pronounced evaporative enrichment observed in surface water underlines the weak hydrological connectivity between these bodies and the underlying aquifer. This distinction supports the interpretation that groundwater recharge predominantly occurs directly from rainfall infiltration rather than via indirect recharge.
5. Conclusion
This study provides new insights into the recharge dynamics of the Thiaroye aquifer in Dakar under extreme rainfall conditions, a critical issue for rapidly urbanizing cities across sub-Saharan Africa. By integrating high-resolution groundwater fluctuation data with stable isotope tracers, we demonstrate that recharge is strongly controlled by high- to extreme-intensity rainfall events, with a threshold of approximately 9 mm required for effective infiltration. The short-duration and high-magnitude events drive abrupt groundwater level rises but also exacerbate urban flooding, underscoring the dual role of extreme rainfall as both a recharge mechanism and a flood hazard.
The isotopic analysis confirms that groundwater recharge is primarily sourced from local rainfall, with limited contribution from surface water bodies that are subject to strong evaporative enrichment. Despite significant variability in rainfall isotopic composition, groundwater signatures remain relatively stable, suggesting that recharge processes are buffered by local hydrogeological conditions. However, the evaporative imprint observed in groundwater highlights the vulnerability of recharge pathways to surface exposure and land-use pressures, particularly in densely urbanized zones where sanitation infrastructure is inadequate.
These findings have critical implications for urban water security in Dakar and similar SSA cities. First, the recharge–flood nexus revealed here highlights the need for integrated planning that considers both groundwater sustainability and flood risk management. Strengthening urban drainage systems, protecting recharge zones, and limiting contamination sources such as on-site sanitation are urgent priorities to safeguard groundwater quality. Second, the identification of a recharge threshold provides a valuable benchmark for groundwater models and adaptation planning under projected increases in extreme rainfall events due to climate change. Finally, the study underscores the importance of sustained isotope-informed monitoring at high temporal resolution to capture the variability of recharge processes under evolving climatic and urban pressures.
Abbreviations

EC

Electrical Conductivity

GWR

Groundwater Response

IPCC

Intergovernmental Panel on Climate Change

LMWL

Local Meteoric Water Line

SDG

Sustainable Development Goal

SMOW

Standard Mean Ocean Water

SSA

Sub-Saharan Africa

USDA

United States Department of Agriculture

WMO

World Meteorological Organization

WTF

Water Table Fluctuation

Acknowledgments
We acknowledge the generous help provided by Elemtex Limited laboratory (UK) in the development of the stable isotope dataset employed in this study. We are also very grateful for the useful comments provided by two anonymous reviewers.
Author Contributions
Abdoulaye Pouye: Conceptualization, Data curation, Formal Analysis, Investigation, Methodology, Software, Writing – original draft, Writing – review & editing
Mandiaye Diene: Data curation, Writing – original draft, Writing – review & editing
Lamine Diop: Data curation, Writing – original draft, Writing – review & editing
Seynabou Cissé Faye: Project administration, Supervision, Validation
Funding
This document is an output from the AfriWatSan project funded by The Royal Society Africa Capacity Building Initiative and the UK Department for International Development (DFID) (Grant Ref. AQ140023). The views expressed and information contained in it are not necessarily those of or endorsed by the Royal Society or DFID, which can accept no responsibility for such views or information or for any reliance placed on them.
Data Availability Statement
The data that support the findings of this study are available from the corresponding author, [A. P], upon reasonable request.
Conflicts of Interest
The authors declare no conflicts of interest.
References
[1] R. G. Taylor, A. D. Koussis, and C. Tindimugaya, ‘Groundwater and climate in Africa—a review’, Hydrological Sciences Journal, vol. 54, no. 4, pp. 655–664, Aug. 2009,
[2] UN-Habitat, Ed., The value of sustainable urbanization. in World cities report, no. 2020. Nairobi, Kenya: UN-Habitat, 2020.
[3] S. Adelana and A. MacDonald, Eds., ‘Groundwater research issues in Africa’, in Applied Groundwater Studies in Africa, vol. 20086152, in IAH - Selected Papers on Hydrogeology, vol. 20086152., Taylor & Francis, 2008.
[4] D. J. Lapworth, M. E. Stuart, S. Pedley, D. Nkhuwa, and M. Tijani, ‘A review of urban groundwater use and water quality challenges in Sub-Saharan Africa’, British Geological Survey, Nottingham, UK, Open Report OR/17/056, 2017.
[5] J. Grönwall and S. Oduro-Kwarteng, ‘Groundwater as a strategic resource for improved resilience: a case study from peri-urban Accra’, Environ Earth Sci, vol. 77, no. 1, p. 6, Jan. 2018,
[6] F. La Vigna, ‘Review: Urban groundwater issues and resource management, and their roles in the resilience of cities’, Hydrogeol J, vol. 30, no. 6, pp. 1657–1683, Sep. 2022,
[7] S. Foster, A. Bousquet, and S. Furey, ‘Urban groundwater use in Tropical Africa – a key factor in enhancing water security?’, Water Policy, vol. 20, no. 5, Art. no. 5, Oct. 2018.
[8] J. Wright, S. Gundry, and R. Conroy, ‘Household drinking water in developing countries: a systematic review of microbiological contamination between source and point‐of‐use’, Tropical Med Int Health, vol. 9, no. 1, pp. 106–117, Jan. 2004,
[9] V. Bobde, A. A. Akinsanola, A. H. Folorunsho, A. A. Adebiyi, and O. E. Adeyeri, ‘Projected regional changes in mean and extreme precipitation over Africa in CMIP6 models’, Environ. Res. Lett., vol. 19, no. 7, p. 074009, Jul. 2024,
[10] S. F. Hounvou, K. F. Guedje, H. Kougbeagbede, J. Adechinan, E. Houngninou, and A. Houeto, ‘Spatiotemporal Variability of Extreme Rainfall in Southern Benin in the Context of Global Warming’, Advances in Meteorology, vol. 2023, pp. 1–11, Mar. 2023,
[11] X. Ncipha, A. Kruger, and L. Sibali, ‘Interannual Variation of Half-Hourly Extreme Precipitation in Africa: The Assessment of the Warmest Decade (2011–2020) Since the Beginning of Observations’, Earth Syst Environ, vol. 8, no. 2, pp. 207–220, Jun. 2024,
[12] S. Foster, ‘The key role for groundwater in urban water-supply security’, Journal of Water and Climate Change, vol. 13, no. 10, Art. no. 10, Oct. 2022,
[13] D. N. Lerner, ‘Identifying and quantifying urban recharge: a review’, Hydrogeology Journal, vol. 10, no. 1, pp. 143–152, Feb. 2002,
[14] R. G. Taylor et al., ‘Evidence of the dependence of groundwater resources on extreme rainfall in East Africa’, Nature Clim Change, vol. 3, no. 4, Art. no. 4, Apr. 2013,
[15] S. Cisse Faye et al., ‘Tracing natural groundwater recharge to the Thiaroye aquifer of Dakar, Senegal’, Hydrogeol J, vol. 27, no. 3, Art. no. 3, May 2019,
[16] M. T. Diaw et al., ‘On-site sanitation density and groundwater quality: evidence from remote sensing and in situ observations in the Thiaroye aquifer, Senegal’, Journal of Water, Sanitation and Hygiene for Development, vol. 10, no. 4, Art. no. 4, Dec. 2020,
[17] M. Diedhiou, S. Cisse Faye, O. C. Diouf, S. Faye, and S. Wohnlich, ‘Groundwater Quality Assessment in a Coastal Sand Aquifer: Implications for Drinking Water and Agricultural Use’, RJASET, vol. 8, no. 5, Art. no. 5, Aug. 2014,
[18] A. Pouye, S. Cissé Faye, M. Diédhiou, C. B. Gaye, and R. G. Taylor, ‘Nitrate contamination of urban groundwater and heavy rainfall: Observations from Dakar, Senegal’, Vadose Zone Journal, Jan. 2023,
[19] A. M. MacDonald, H. C. Bonsor, B. É. Ó. Dochartaigh, and R. G. Taylor, ‘Quantitative maps of groundwater resources in Africa’, Environ. Res. Lett., vol. 7, no. 2, Art. no. 2, Jun. 2012,
[20] C. Diouf, ‘Combined uses of water-table fluctuation (WTF), chloride mass balance (CMB) and environmental isotopes methods to investigate groundwater recharge in the Thiaroye sandy aquifer (Dakar, Senegal)’, Afr. J. Environ. Sci. Technol., vol. 6, no. 11, Art. no. 11, Nov. 2012,
[21] S. Diedhiou et al., ‘Extreme rainfall in Dakar (Senegal): a case study for September 5, 2020’, Front. Water, vol. 6, p. 1439404, Nov. 2024,
[22] O. C. Diouf et al., ‘Modelling groundwater evapotranspiration in a shallow aquifer in a semi-arid environment’, Journal of Hydrology, vol. 587, p. 124967, Aug. 2020,
[23] A. Pouye, S. C. Faye, M. Diédhiou, C. B. Gaye, and R. G. Taylor, ‘An evaluation of groundwater vulnerability assessment methods in a rapidly urbanizing city: evidence from Dakar, Senegal’, Environ Earth Sci, vol. 81, no. 16, Art. no. 16, Aug. 2022,
[24] T. B. Coplen, ‘Normalization of oxygen and hydrogen isotope data’, Chemical Geology: Isotope Geoscience section, vol. 72, no. 4, pp. 293–297, Jun. 1988,
[25] H. Zhou and W. Z. Zhao, ‘Evolution of soil-water states in the vadose zone of a desert soil after an extreme rainfall event and its impact on the ecosystem’, Hydrogeol J, vol. 29, no. 6, Art. no. 6, Sep. 2021,
[26] D. O. V. Kotchoni, J.-M. Vouillamoz, F. M. A. Lawson, P. Adjomayi, M. Boukari, and R. G. Taylor, ‘Relationships between rainfall and groundwater recharge in seasonally humid Benin: a comparative analysis of long-term hydrographs in sedimentary and crystalline aquifers’, Hydrogeol J, vol. 27, no. 2, Art. no. 2, Mar. 2019,
[27] B. R. Scanlon et al., ‘Global synthesis of groundwater recharge in semiarid and arid regions’, Hydrological Processes, vol. 20, no. 15, pp. 3335–3370, Oct. 2006,
[28] J. P. R. Sorensen et al., ‘Groundwater recharge is diffuse in semi-arid African drylands: Evidence from highly instrumented observatories’, Journal of Hydrology, vol. 636, p. 131227, Jun. 2024,
[29] M. O. Cuthbert et al., ‘Observed controls on resilience of groundwater to climate variability in sub-Saharan Africa’, Nature, vol. 572, no. 7768, Art. no. 7768, Aug. 2019,
[30] IPCC, Climate Change 2021 – The Physical Science Basis: Working Group I Contribution to the Sixth Assessment Report of the Intergovernmental Panel on Climate Change, 1st ed. Cambridge University Press, 2023.
[31] M. Owor, R. G. Taylor, C. Tindimugaya, and D. Mwesigwa, ‘Rainfall intensity and groundwater recharge: empirical evidence from the Upper Nile Basin’, Environ. Res. Lett., vol. 4, no. 3, p. 035009, Sep. 2009,
[32] L. P. M. Diémé, C. Bouvier, A. Bodian, and A. Sidibé, ‘Modelling urban stormwater drainage overflows for assessing flood hazards: application to the urban area of Dakar (Senegal)’, Nat. Hazards Earth Syst. Sci., vol. 25, no. 3, pp. 1095–1112, Mar. 2025,
[33] M. S. Diop, ‘Les capacités adaptatives des communautés de la périphérie de Dakar face aux inondations’, Thèse de Doctorat unique, Université Paris-Saclay (ComUE), France, 2019. Available:
[34] J. R. Gat, ‘Oxygen and hydrogen isotopes in the hydrologic cycle’, Annu. Rev. Earth Planet. Sci., vol. 24, no. 1, pp. 225–262, May 1996,
[35] C. Millogo, I. Ki, I. Ouedraogo, and S. Nakolendoussé, ‘Hydrogeological Characterisation of a Sedimentary Aquifer and Springs Near the City of Bobo-Dioulasso, Burkina Faso: Isotopic Approaches’, WROS, vol. 13, no. 4, pp. 105–115, Oct. 2024,
[36] I. D. Clark and P. Fritz, Environmental isotopes in hydrogeology. Boca Raton, FL: CRC Press/Lewis Publishers, 1997.
[37] S. Jasechko, Global Isotope Hydrogeology Review, Reviews of Geophysics, vol. 57, no. 3, pp. 835–965, Sep. 2019,
Cite This Article
  • APA Style

    Pouye, A., Diene, M., Diop, L., Faye, S. C. (2025). Assessment of Recharge Dynamics Under Extreme Rainfall Using Groundwater Fluctuations and Stable Isotopes Signatures: Insights from an Urban Observatory in Dakar. Journal of Water Resources and Ocean Science, 14(5), 118-133. https://doi.org/10.11648/j.wros.20251405.11

    Copy | Download

    ACS Style

    Pouye, A.; Diene, M.; Diop, L.; Faye, S. C. Assessment of Recharge Dynamics Under Extreme Rainfall Using Groundwater Fluctuations and Stable Isotopes Signatures: Insights from an Urban Observatory in Dakar. J. Water Resour. Ocean Sci. 2025, 14(5), 118-133. doi: 10.11648/j.wros.20251405.11

    Copy | Download

    AMA Style

    Pouye A, Diene M, Diop L, Faye SC. Assessment of Recharge Dynamics Under Extreme Rainfall Using Groundwater Fluctuations and Stable Isotopes Signatures: Insights from an Urban Observatory in Dakar. J Water Resour Ocean Sci. 2025;14(5):118-133. doi: 10.11648/j.wros.20251405.11

    Copy | Download

  • @article{10.11648/j.wros.20251405.11,
      author = {Abdoulaye Pouye and Mandiaye Diene and Lamine Diop and Seynabou Cissé Faye},
      title = {Assessment of Recharge Dynamics Under Extreme Rainfall Using Groundwater Fluctuations and Stable Isotopes Signatures: Insights from an Urban Observatory in Dakar
    },
      journal = {Journal of Water Resources and Ocean Science},
      volume = {14},
      number = {5},
      pages = {118-133},
      doi = {10.11648/j.wros.20251405.11},
      url = {https://doi.org/10.11648/j.wros.20251405.11},
      eprint = {https://article.sciencepublishinggroup.com/pdf/10.11648.j.wros.20251405.11},
      abstract = {Rapid urbanization across sub-Saharan Africa intensifies water supply challenges, making groundwater an essential resource for meeting the needs of low-income urban communities. However, the recurrence of extreme rainfall events due to climate change present major challenges for sustainable groundwater management, particularly in urban areas where infrastructures often impedes natural recharge processes and simultaneously amplifies flood risks. Here we investigate the recharge dynamics of the Thiaroye quaternary sand aquifer in Dakar, Senegal, under extreme rainfall conditions, based on high resolution monitoring of groundwater fluctuations and stable isotope analysis. The study combines high-frequency hydrological data from the Dakar suburban groundwater observatory, with isotopic signatures (δ18O and δ2H) to trace recharge processes and contamination risks. Results indicate that high to extreme rainfall events (>10 mm.d-1) are the primary drivers of groundwater level fluctuations, with an identified threshold of approximately 9 mm needed for effective recharge. The isotopic analysis confirms consistent recharge conditions primarily influenced by local rainfall despite substantial variability in precipitation isotopic composition. This research underscores the critical need for improved groundwater management strategies to enhance urban resilience against extreme climatic events such as heavy to extreme rainfall, bridging the knowledge gap regarding groundwater recharge mechanisms in rapidly urbanizing areas like Dakar.
    },
     year = {2025}
    }
    

    Copy | Download

  • TY  - JOUR
    T1  - Assessment of Recharge Dynamics Under Extreme Rainfall Using Groundwater Fluctuations and Stable Isotopes Signatures: Insights from an Urban Observatory in Dakar
    
    AU  - Abdoulaye Pouye
    AU  - Mandiaye Diene
    AU  - Lamine Diop
    AU  - Seynabou Cissé Faye
    Y1  - 2025/09/25
    PY  - 2025
    N1  - https://doi.org/10.11648/j.wros.20251405.11
    DO  - 10.11648/j.wros.20251405.11
    T2  - Journal of Water Resources and Ocean Science
    JF  - Journal of Water Resources and Ocean Science
    JO  - Journal of Water Resources and Ocean Science
    SP  - 118
    EP  - 133
    PB  - Science Publishing Group
    SN  - 2328-7993
    UR  - https://doi.org/10.11648/j.wros.20251405.11
    AB  - Rapid urbanization across sub-Saharan Africa intensifies water supply challenges, making groundwater an essential resource for meeting the needs of low-income urban communities. However, the recurrence of extreme rainfall events due to climate change present major challenges for sustainable groundwater management, particularly in urban areas where infrastructures often impedes natural recharge processes and simultaneously amplifies flood risks. Here we investigate the recharge dynamics of the Thiaroye quaternary sand aquifer in Dakar, Senegal, under extreme rainfall conditions, based on high resolution monitoring of groundwater fluctuations and stable isotope analysis. The study combines high-frequency hydrological data from the Dakar suburban groundwater observatory, with isotopic signatures (δ18O and δ2H) to trace recharge processes and contamination risks. Results indicate that high to extreme rainfall events (>10 mm.d-1) are the primary drivers of groundwater level fluctuations, with an identified threshold of approximately 9 mm needed for effective recharge. The isotopic analysis confirms consistent recharge conditions primarily influenced by local rainfall despite substantial variability in precipitation isotopic composition. This research underscores the critical need for improved groundwater management strategies to enhance urban resilience against extreme climatic events such as heavy to extreme rainfall, bridging the knowledge gap regarding groundwater recharge mechanisms in rapidly urbanizing areas like Dakar.
    
    VL  - 14
    IS  - 5
    ER  - 

    Copy | Download

Author Information