
Objective: To identify the most informative metabolic biomarkers associated with newly diagnosed cancer and to evaluate the potential of interpretable machine learning methods for their identification and patient classification. Materials and methods: This single-center retrospective study included 210 patients: 110 subjects without cancer and 100 patients with newly diagnosed malignancies. Clinical, anthropometric, laboratory, and metabolic variables were analyzed, including body mass index, waist circumference, visceral adiposity index, fasting glucose, immunoreactive insulin, insulin resistance indices, lipid profile, adipokines, and inflammatory markers. After preprocessing and stratified splitting into training, validation, and test sets, a family of Logistic Regression models, Elastic Net, Decision Tree, and CatBoost were used for binary classification. Model interpretation was performed using SHAP analysis, CatBoost feature importance, decision tree structure, SHAP Waterfall plots, and standardized Elastic Net coefficients. Results: CatBoost demonstrated the best classification performance on the test set (AUROC=0.9805; AUPRC=0.9711; Recall=0.9091; Precision=0.9524; F1-score=0.9302). Independent interpretation methods consistently identified the hyperglycemia criterion, fasting glucose, HOMA-IR, oral glucose tolerance test parameters, and the number of metabolic syndrome components as the leading predictors. Distribution analysis confirmed a shift of these biomarkers toward more pronounced carbohydrate metabolism disorders in the oncology group. Conclusion: Interpretable machine learning can support the identification of metabolic biomarkers associated with newly diagnosed cancer. Carbohydrate metabolism and insulin resistance markers were the most informative predictors and may be useful for early oncometabolic risk stratification and future clinical decision-support models.
| Published in | American Journal of Clinical and Experimental Medicine (Volume 14, Issue 5) |
| DOI | 10.11648/j.ajcem.20261405.13 |
| Page(s) | 119-128 |
| Creative Commons |
This is an Open Access article, distributed under the terms of the Creative Commons Attribution 4.0 International License (http://creativecommons.org/licenses/by/4.0/), which permits unrestricted use, distribution and reproduction in any medium or format, provided the original work is properly cited. |
| Copyright |
Copyright © The Author(s), 2026. Published by Science Publishing Group |
Cancer, Machine Learning, SHAP, CatBoost, Insulin Resistance, HOMA-IR, Hyperglycemia, Metabolic Syndrome, Biomarkers
Parameter | SG (n=110) | Oncology (n=100) | p |
|---|---|---|---|
Age, years | 48.20 (38.68; 59.88) | 49.30 (41.70; 62.35) | 0.234 |
Weight, kg | 80.00 (70.75; 98.00) | 80.00 (71.00; 89.75) | 0.432 |
BMI, kg/m2 | 27.83 (23.79; 33.26) | 28.91 (25.38; 33.51) | 0.328 |
WC, cm | 81.00 (72.00; 92.75) | 87.00 (76.00; 97.00) | 0.187 |
VAI | 2.42 (1.25; 4.41) | 3.38 (2.16; 4.46) | 0.009 |
Glucose, mmol/L | 4.70 (4.30; 5.10) | 5.95 (4.83; 7.58) | <0.001 |
IRI, µIU/mL | 29.40 (14.85; 45.30) | 48.90 (34.10; 88.95) | <0.001 |
HOMA-IR | 5.90 (2.88; 9.10) | 12.18 (8.05; 25.83) | <0.001 |
Matsuda | 2.11 (1.48; 3.83) | 1.14 (0.75; 1.87) | <0.001 |
Caro | 0.16 (0.10; 0.29) | 0.12 (0.08; 0.20) | 0.002 |
Visfatin | 32.10 (26.38; 37.15) | 23.10 (10.83; 34.00) | <0.001 |
Resistin | 7.85 (4.88; 9.60) | 23.20 (15.98; 33.28) | <0.001 |
IL-10 | 16.20 (9.63; 26.20) | 10.75 (6.73; 15.88) | <0.001 |
Model | AUROC | AUPRC | Recall (Sensitivity) | Precision (PPV) | F1-score |
|---|---|---|---|---|---|
CatBoost | 0.9805 | 0.9711 | 0.9091 | 0.9524 | 0.9302 |
Decision Tree | 0.8701 | 0.8800 | 0.9091 | 0.7692 | 0.8333 |
Logistic Regression (Elastic Net) | 0.7581 | 0.6604 | 0.7727 | 0.6071 | 0.6800 |
Logistic Regression (L2, Ridge) | 0.7614 | 0.6626 | 0.7727 | 0.6071 | 0.6800 |
Logistic Regression (L1, Lasso) | 0.7256 | 0.6158 | 0.8636 | 0.5278 | 0.6552 |
Logistic Regression (No regularization) | 0.6761 | 0.5664 | 0.7273 | 0.5926 | 0.6531 |
BMI | Body Mass Index |
WC | Waist Circumference |
VAI | Visceral Adiposity Index |
SHAP | SHapley Additive exPlanations |
OGTT | Oral Glucose Tolerance Test |
| [1] |
World Health Organization. Cancer. Available from:
https://www.who.int/news-room/fact-sheets/detail/cancer (accessed 23 August 2026). |
| [2] | Kaprin A. D., Perkhov V. I., Genatulin M. A. Dynamics of target indicators of the Russian federal project "Fight against Oncological Diseases". Preventive Medicine. 2026; 29(3): 7–14. |
| [3] | Bairova K. I., Mkrtumyan A. M., Prilepa S. A., Medvedeva E. V. Visceral obesity as a risk factor for breast cancer. Therapeutic Archive. 2025; 97(10): 830–835. |
| [4] | Ermak A. D., Gavrilov D. V., Novitsky R. E., Gusev A. V., Komarov Yu. I., Andreichenko A. E. Using machine learning to predict oncological diseases based on electronic medical record data: an automated approach to screening. Oncology Issues. 2025; 71(4): OF–2258. |
| [5] | Miotto R., Li L., Kidd B. A., Dudley J. T. Deep Patient: An unsupervised representation to predict the future of patients from the electronic health records. Scientific Reports. 2016; 6: 26094. |
| [6] | Sung H., Filho A. M., Laversanne M., Ferlay J., Siegel R. L., Soerjomataram I., Jemal A., Bray F. Global cancer statistics 2024: GLOBOCAN estimates of incidence and mortality worldwide for 34 cancers in 186 countries. CA: A Cancer Journal for Clinicians. 2026. |
| [7] | Lee F., Moore J., Markouli M., Ghusn W. The oncogenic burden of obesity: mechanistic links between adiposity and gastrointestinal cancers — a comprehensive narrative review. Biomedicines. 2025;13(7):1571. |
| [8] | Zhao X., An X., Yang C., Sun W., Ji H., Lian F. The crucial role and mechanism of insulin resistance in metabolic disease. Frontiers in Endocrinology. 2023;14:1149239. |
| [9] | Zhang A. M. Y., Xia Y. H., Lin J. S. H., Chu K. H., Wang W. C. K., Ruiter T. J. J., et al. Hyperinsulinemia acts via acinar insulin receptors to initiate pancreatic cancer by increasing digestive enzyme production and inflammation. Cell Metabolism. 2023;35(12):2119-2135.e5. |
| [10] | Yin J., Freedman N. D., Liu Y., Dawsey S. M., Yang H., Taylor P. R., et al. Associations between serum glucose, insulin, insulin resistance and the risk of incident primary liver cancer or chronic liver disease mortality: a nested case-control study. British Journal of Cancer. 2023; 128(2): 275-284. |
| [11] | Son M., Moon S. Y., Koh M., Kang Y., Lee J. Y. Association between surrogate markers of insulin resistance and the incidence of colorectal cancer in Korea: a nationwide population-based study. Journal of Clinical Medicine. 2024; 13(6): 1628. |
| [12] | Caruso A., Gelsomino L., Panza S., Accattatis F. M., Naimo G. D., Barone I., et al. Leptin: a heavyweight player in obesity-related cancers. Biomolecules. 2023; 13(7): 1084. |
| [13] | Al-Tashi Q., Saad M. B., Muneer A., Qureshi R., Mirjalili S., Sheshadri A., et al. Machine learning models for the identification of prognostic and predictive cancer biomarkers: a systematic review. International Journal of Molecular Sciences. 2023;24(9):7781. |
| [14] | Mohamed Y. A., Khoo B. E., Mohd Asaari M. S., Aziz M. E., Ghazali F. R. Decoding the black box: explainable AI (XAI) for cancer diagnosis, prognosis, and treatment planning — a state-of-the-art systematic review. International Journal of Medical Informatics. 2025;193:105689. |
| [15] | Collins G. S., Moons K. G. M., Dhiman P., Riley R. D., Beam A. L., Van Calster B., et al. TRIPOD+AI statement: updated guidance for reporting clinical prediction models that use regression or machine learning methods. BMJ. 2024; 385: e078378. |
APA Style
Bairova, K. I., MusaelovichMkrtumyan, A. (2026). Interpretable Machine Learning for the Identification of Key Metabolic Biomarkers Associated with Newly Diagnosed Malignancies. American Journal of Clinical and Experimental Medicine, 14(5), 119-128. https://doi.org/10.11648/j.ajcem.20261405.13
ACS Style
Bairova, K. I.; MusaelovichMkrtumyan, A. Interpretable Machine Learning for the Identification of Key Metabolic Biomarkers Associated with Newly Diagnosed Malignancies. Am. J. Clin. Exp. Med. 2026, 14(5), 119-128. doi: 10.11648/j.ajcem.20261405.13
@article{10.11648/j.ajcem.20261405.13,
  author = {Kermen Ivanovna Bairova and Ashot MusaelovichMkrtumyan},
  title = {Interpretable Machine Learning for the Identification of Key Metabolic Biomarkers Associated with Newly Diagnosed Malignancies},
  journal = {American Journal of Clinical and Experimental Medicine},
  volume = {14},
  number = {5},
  pages = {119-128},
  doi = {10.11648/j.ajcem.20261405.13},
  url = {https://doi.org/10.11648/j.ajcem.20261405.13},
  eprint = {https://article.sciencepublishinggroup.com/pdf/10.11648.j.ajcem.20261405.13},
  abstract = {Objective: To identify the most informative metabolic biomarkers associated with newly diagnosed cancer and to evaluate the potential of interpretable machine learning methods for their identification and patient classification. Materials and methods: This single-center retrospective study included 210 patients: 110 subjects without cancer and 100 patients with newly diagnosed malignancies. Clinical, anthropometric, laboratory, and metabolic variables were analyzed, including body mass index, waist circumference, visceral adiposity index, fasting glucose, immunoreactive insulin, insulin resistance indices, lipid profile, adipokines, and inflammatory markers. After preprocessing and stratified splitting into training, validation, and test sets, a family of Logistic Regression models, Elastic Net, Decision Tree, and CatBoost were used for binary classification. Model interpretation was performed using SHAP analysis, CatBoost feature importance, decision tree structure, SHAP Waterfall plots, and standardized Elastic Net coefficients. Results: CatBoost demonstrated the best classification performance on the test set (AUROC=0.9805; AUPRC=0.9711; Recall=0.9091; Precision=0.9524; F1-score=0.9302). Independent interpretation methods consistently identified the hyperglycemia criterion, fasting glucose, HOMA-IR, oral glucose tolerance test parameters, and the number of metabolic syndrome components as the leading predictors. Distribution analysis confirmed a shift of these biomarkers toward more pronounced carbohydrate metabolism disorders in the oncology group. Conclusion: Interpretable machine learning can support the identification of metabolic biomarkers associated with newly diagnosed cancer. Carbohydrate metabolism and insulin resistance markers were the most informative predictors and may be useful for early oncometabolic risk stratification and future clinical decision-support models.},
 year = {2026}
}
TY  - JOUR
T1  - Interpretable Machine Learning for the Identification of Key Metabolic Biomarkers Associated with Newly Diagnosed Malignancies
AU  - Kermen Ivanovna Bairova
AU  - Ashot MusaelovichMkrtumyan
Y1  - 2026/09/04
PY  - 2026
N1  - https://doi.org/10.11648/j.ajcem.20261405.13
DO  - 10.11648/j.ajcem.20261405.13
T2  - American Journal of Clinical and Experimental Medicine
JF  - American Journal of Clinical and Experimental Medicine
JO  - American Journal of Clinical and Experimental Medicine
SP  - 119
EP  - 128
PB  - Science Publishing Group
SN  - 2330-8133
UR  - https://doi.org/10.11648/j.ajcem.20261405.13
AB  - Objective: To identify the most informative metabolic biomarkers associated with newly diagnosed cancer and to evaluate the potential of interpretable machine learning methods for their identification and patient classification. Materials and methods: This single-center retrospective study included 210 patients: 110 subjects without cancer and 100 patients with newly diagnosed malignancies. Clinical, anthropometric, laboratory, and metabolic variables were analyzed, including body mass index, waist circumference, visceral adiposity index, fasting glucose, immunoreactive insulin, insulin resistance indices, lipid profile, adipokines, and inflammatory markers. After preprocessing and stratified splitting into training, validation, and test sets, a family of Logistic Regression models, Elastic Net, Decision Tree, and CatBoost were used for binary classification. Model interpretation was performed using SHAP analysis, CatBoost feature importance, decision tree structure, SHAP Waterfall plots, and standardized Elastic Net coefficients. Results: CatBoost demonstrated the best classification performance on the test set (AUROC=0.9805; AUPRC=0.9711; Recall=0.9091; Precision=0.9524; F1-score=0.9302). Independent interpretation methods consistently identified the hyperglycemia criterion, fasting glucose, HOMA-IR, oral glucose tolerance test parameters, and the number of metabolic syndrome components as the leading predictors. Distribution analysis confirmed a shift of these biomarkers toward more pronounced carbohydrate metabolism disorders in the oncology group. Conclusion: Interpretable machine learning can support the identification of metabolic biomarkers associated with newly diagnosed cancer. Carbohydrate metabolism and insulin resistance markers were the most informative predictors and may be useful for early oncometabolic risk stratification and future clinical decision-support models.
VL  - 14
IS  - 5
ER  -
Department of Endocrinology, Russian University of Medicine of the Ministry of Health of Russia, Moscow, Russia
Department of Endocrinology, Russian University of Medicine of the Ministry of Health of Russia, Moscow, Russia
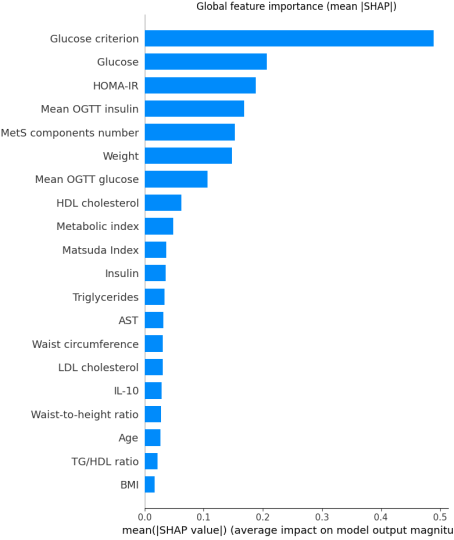
Figure 1. Global importance of metabolic biomarkers according to SHAP analysis.
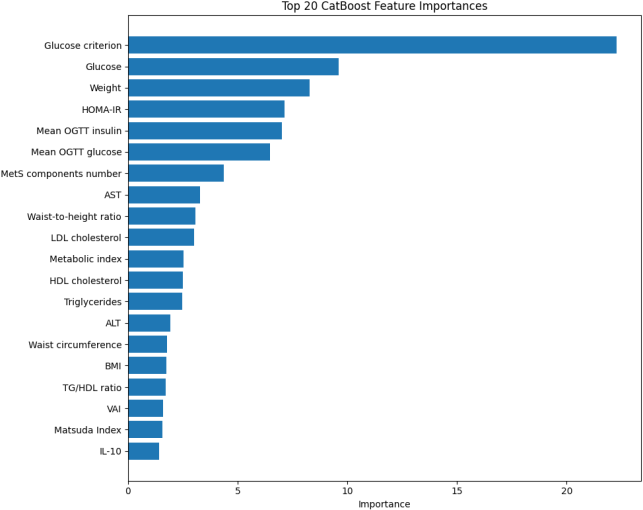
Figure 2. Internal feature importance of the CatBoost model.
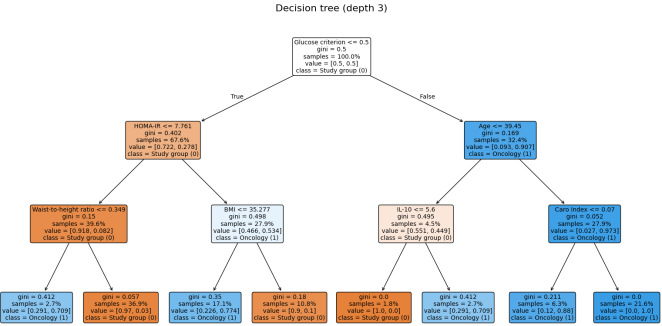
Figure 3. Interpretable patient classification model using Decision Tree.
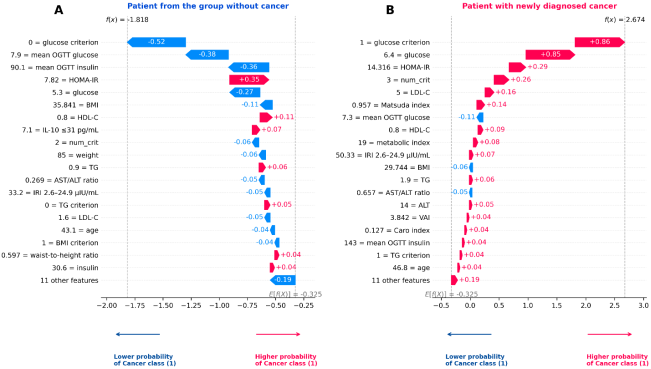
Figure 4. Individual interpretation of model decisions using the SHAP Waterfall method. A – patient from the study group without oncological disease; B – patient with a newly diagnosed oncological disease.
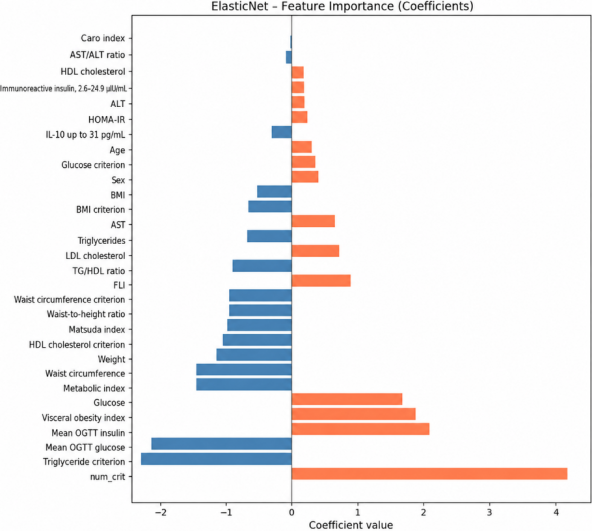
Figure 5. Coefficients of the Elastic Net model characterizing the direction of association of features with the probability of patient belonging to the group with newly diagnosed oncological diseases.
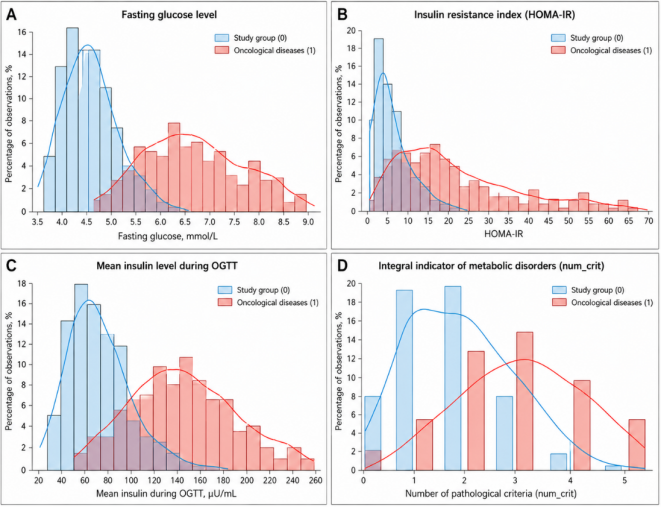
Figure 6. Distribution of the most informative metabolic biomarkers in patients of the study group and patients with newly diagnosed oncological diseases. A – fasting glucose level; B – HOMA-IR index; C – mean insulin level during OGTT; D – indicator of the number of metabolic syndrome components.

Information



 Share This Article
 Twitter
 Linked In
 Facebook
 Copy
Copy Download