1. Introduction
Solid waste is an impracticable material generated due to human day-to-day activity
| [23] | Kadhila, T., 2019. Implementation of a municipal solid waste management system in Swakopmund, Namibia 178. |
[23]
. Its generation is greatly accelerated in quantity and altered in composition throughout the world, particularly in developing countries
. It is generated from various sources such as households, commercial, institutional, industrial, and agricultural establishments
| [20] | Hailu, Y., 2019. Municipal Solid Waste Source Identification, Characterization and Physical Composition Analysis, Case Study Wolkite Town, Ethiopia. Am. J. Environ. Prot. 8, 48. https://doi.org/10.11648/j.ajep.20190802.12 |
[20]
. Municipal solid waste from such sources is facing a severe challenge in both developed and developing countries in terms of management. The quantity and types of waste are increasing due to population growth, rising standards of living, rapid urbanization, a booming economy, industrialization, and technological development
| [1] | Abdel-Shafy, H. I., Mansour, M. S. M., 2018. Solid waste issue: Sources, composition, disposal, recycling, and valorization. Egypt. J. Pet. 27, 1275-1290. https://doi.org/10.1016/j.ejpe.2018.07.003 |
| [6] | Azam, M., Jahromy, S. S., Raza, W., Raza, N., Lee, S. S., Kim, K.-H., Winter, F., 2020. Status, characterization, and potential utilization of municipal solid waste as renewable energy source: Lahore case study in Pakistan. Environ. Int. 134, 105291. https://doi.org/10.1016/j.envint.2019.105291 |
| [12] | Desta, H., Worku, H., Fetene, A., 2014. Assessment of the Contemporary Municipal Solid Waste Management in Urban Environment: The Case of Addis Ababa, Ethiopia. J. Environ. Sci. Technol. 7(2): 107-122. https://doi.org/10.3923/jest.2014.107.122 |
[1, 6, 12]
. Lack of awareness among the population, a high concentration of people in urban areas, and widespread use of disposable containers and parcels are among the factors aggravating the situation
| [3] | Ahmed, O. O., 2016. Solid Waste Management Practices in Two Northern Manitoba First Nations Communities: Community Perspectives on the Issues and Solutions. Nat. Resour. Inst. 1-216. http://hdl.handle.net/1993/31088 |
[3]
. According to
| [17] | Fereja, W. M., Chemeda, D. D., 2022. Status, characterization, and quantification of municipal solid waste as a measure towards effective solid waste management: The case of Dilla Town, Southern Ethiopia. J. Air \& Waste Manag. Assoc. 72, 187-201. https://doi.org/10.1080/10962247.2021.1923585 |
[17]
, lack of awareness among inhabitants, poor household waste segregation practices, and unsanitary landfill disposal are the main solid waste management problems. Additionally, ineffective solid waste fee systems, lack of trained manpower, inappropriate collection routes, unavailability of collection vehicles, illegal waste disposal, and improper placement of community containers are other barriers to effective waste management
| [17] | Fereja, W. M., Chemeda, D. D., 2022. Status, characterization, and quantification of municipal solid waste as a measure towards effective solid waste management: The case of Dilla Town, Southern Ethiopia. J. Air \& Waste Manag. Assoc. 72, 187-201. https://doi.org/10.1080/10962247.2021.1923585 |
| [21] | Hirpe, L., 2021. Municipal Solid Waste Management Policies, Practices, and Challenges in Ethiopia: A Systematic Review. Sustainability, 13(20), p. 11241. https://doi.org/10.3390/su132011241 |
[17, 21]
.
The management of municipal solid waste is a global issue, especially in developing countries
| [45] | Zohoori, M., Ghani, A., 2017. Municipal solid waste management challenges and problems for cities in low-income and developing countries. Int. J. Sci. Eng. Appl 6, 39-48. |
[45]
. The increasing urban population in these areas leads to the generation of a significant amount of waste, making its proper management a complex challenge that poses environmental and public health threats
| [9] | Change, C., 2019. Urban Municipal Solid Waste Management. |
[9]
. Signs of this issue include dirty areas within towns, garbage in the streets, refuse thrown into water bodies, disposal in open dumps, and unpleasant odors
| [13] | Deus, R. M., Mele, F. D., Bezerra, B. S., Battistelle, R. A. G., 2020. A municipal solid waste indicator for environmental impact: Assessment and identification of best management practices. J. Clean. Prod. 242, 118433. https://doi.org/10.1016/j.jclepro.2019.118433 |
[13]
. The environmental impact of municipal solid waste is evident in the aesthetic ugliness it creates in urban areas, as well as its potential to contaminate water bodies, posing a threat to the environment and public health
| [11] | De, S., Debnath, B., 2016. Prevalence of Health Hazards Associated with Solid Waste Disposal- A Case Study of Kolkata, India. Procedia Environ. Sci. 35, 201-208. https://doi.org/10.1016/j.proenv.2016.07.081 |
| [25] | Khoiron, K., Probandari, A. N., Setyaningsih, W., Kasjono, H. S., Setyobudi, R. H., Anne, O., 2020. A review of environmental health impact from municipal solid waste (MSW) landfill. Ann. Trop. Med. public Heal. 23, 60-67. |
[11, 25]
. The rapid population growth and industrialization have contributed to the production of large quantities of solid waste, exacerbating its negative impact over time. Therefore, it is crucial for municipal solid waste to be managed properly
.
To establish efficient municipal solid waste management systems, it is crucial to have accurate information about the amount and composition of waste being produced
. This information is necessary for stakeholders to implement appropriate management strategies
| [15] | ElSaid, S., Aghezzaf, E. H., 2020. Alternative strategies towards a sustainable municipal solid waste management system: A case study in Cairo. Waste Manag. \& Res. 38, 995-1006. https://doi.org/10.1177/0734242X20919488 |
[15]
. The rapid growth of population and urbanization has led to an increase in waste generation and a significant change in waste composition
. Hence, reliable data on waste generation and composition are essential for making informed decisions and enforcing proper waste management systems
. This information is necessary for planning, operation, and decision-making related to solid waste management
. According to
| [18] | Gallardo, A., Carlos, M., Peris, M., Colomer, F. J., 2014. Methodology to design a municipal solid waste generation and composition map: A case study. Waste Manag. 34, 1920-1931. https://doi.org/10.1016/j.wasman.2014.05.014 |
[18]
, to design an effective municipal solid waste management plan, the first step is to define the patterns of waste generation and composition within the town. This highlights the importance of gathering extensive information about the types and amounts of waste produced to manage municipal solid waste (MSW) effectively.
Solid waste composition is crucial for planning material recovery facilities and developing other waste reduction strategies
. Therefore, successful characterization is essential and depends on obtaining representative samples of the collected solid waste and making statistically accurate estimates of component weights
. Solid waste quantities should always be expressed in terms of weight
. Significant variations in quantity and composition are influenced by economic status, geographical land characteristics, rainfall, climate, people's habits, dietary choices, and the packaging materials they purchase. The reason for measuring the solid waste generation rate is to obtain data to determine the total amount of waste to be managed
. Solid waste generation and characterization are crucial parameters that affect environmental sustainability
| [35] | Ozcan, H. K., Guvenc, S. Y., Guvenc, L., Demir, G., 2016. Municipal solid waste characterization according to different income levels: A case study. Sustainability 8, 1044. https://doi.org/10.3390/su8101044 |
[35]
. Municipal solid waste characterization depends on social structure and income levels
| [33] | Nguyen, K. L. P., Chuang, Y. H., Chen, H. W., Chang, C. C., 2020. Impacts of socioeconomic changes on municipal solid waste characteristics in Taiwan. Resour. Conserv. Recycl. 161, 104931. |
[33]
. According to
| [29] | Lozano, D. P., Cynthia, L., Helbingen, B., Gasparatos, A., 2023. Household waste generation, composition and determining factors in rapidly urbanizing developing cities: case study of Santa Cruz de la Sierra, Bolivia. J. Mater. Cycles Waste Manag. 25, 565-581. https://doi.org/10.1007/s10163-022-01535-1 |
[29]
, detailed information about waste generation rates, composition, and influencing factors is essential for sustainable municipal solid waste management systems. While detailed waste characterization studies have been regularly conducted in industrialized countries for decades, they are still in early stages and limited in scope in developing countries
| [10] | Das, S., Lee, S.-H., Kumar, P., Kim, K.-H., Lee, S. S., Bhattacharya, S. S., 2019. Solid waste management: Scope and the challenge of sustainability. J. Clean. Prod. 228, 658-678. https://doi.org/10.1016/j.jclepro.2019.04.323 |
[10]
. As stated by
| [2] | Adeleke, O. A., Akinlabi, S. A., Jen, T. C., Dunmade, I., 2021. An overview of factors affecting the rate of generation and Physical Composition of Municipal Solid Waste. IOP Conf. Ser. Mater. Sci. Eng. 1107, 012096. https://doi.org/10.1088/1757-899x/1107/1/012096 |
[2]
, an effective waste management strategy requires detailed waste characterization, quantification, and prediction of the rate of generation and physical components of waste, which are also indicative of recoverable energy. An extensive dataset of waste generation and composition raises awareness among policymakers and organizations responsible for waste management
| [2] | Adeleke, O. A., Akinlabi, S. A., Jen, T. C., Dunmade, I., 2021. An overview of factors affecting the rate of generation and Physical Composition of Municipal Solid Waste. IOP Conf. Ser. Mater. Sci. Eng. 1107, 012096. https://doi.org/10.1088/1757-899x/1107/1/012096 |
[2]
.
Municipal solid waste management involves the production, collection, transfer, separation, transportation, and disposal of waste in a way that does not pose a threat to public health, the economy, conservation, aesthetics, and the environment. The main goal of solid waste management is to separate, process, handle, treat, and dispose of waste in an environmentally and socially responsible manner, using the most cost-effective methods available
| [22] | Is-haque, I. I., Huysman, M., 2013. Sustainable private sector solid waste collection \& transportation. The case of Kwesimintsim, STMA, Ghana. |
[22]
. Municipal Solid Waste (MSW) management is one of the most critical issues in contemporary urban environments, especially in developing countries
| [37] | Rai, R. K., Khadayat, M. S., Bhardwaj, B., 2019. Improving Municipal Solid Waste Collection Services in Developing Countries: A Case of Bharatpur Metropolitan City, Sustainability, 11(11), p. 3010. Nepal. https://doi.org/10.3390/su11113010 |
[37]
. According to
| [45] | Zohoori, M., Ghani, A., 2017. Municipal solid waste management challenges and problems for cities in low-income and developing countries. Int. J. Sci. Eng. Appl 6, 39-48. |
[45]
, inadequate human and financial resources, along with insufficient machinery, are among the primary challenges facing municipal solid waste management.
However, the management of solid waste generated is a problem facing both developing and developed countries. The generation of waste has become an increasingly significant environmental and public health issue worldwide
| [31] | Mohsin, M., Chinyama, A., 2016. Impacts of solid waste management practices on environment and public health: A case of Bahawalpur city, Pakistan. J. Environ. Agric. Sci. 9, 69-79. |
[31]
. Inappropriate management of solid waste in urban areas of developing countries causes environmental pollution and consequently impacts people's health
. Municipal solid waste management is a complex issue that involves political, socioeconomic, institutional, and environmental aspects. Due to rapid urban growth, it has become one of the most significant challenges faced by urban areas in developing countries
| [38] | Review, E., 2021. Raising Awareness on Solid Waste Management through Formal Education for Sustainability: A Developing Countries. Recycling, 6(1), p. 6. https://doi.org/10.3390/recycling6010006 |
| [40] | Salami, H. A., Adegite, J. O., Bademosi, T. T., Lawal, S. O., Olutayo, O. O., 2019. A Review on the Current Status of Munifile:///C:/Users/user/Downloads/residential +commercial. pdfcipal Solid Waste Management in Nigeria: Problems and Solutions 3, 1-16. https://doi.org/10.9734/JERR/2018/v3i416884 |
| [42] | Srivastava, V., Singh, P., Singh, R. P., 2014. Urban solid waste management in the developing world with emphasis on India: challenges and opportunities Urban solid waste management in the developing world with emphasis on India: challenges and opportunities. https://doi.org/10.1007/s11157-014-9352-4 |
[38, 40, 42]
. The lack of environmental knowledge among younger and older individuals in developing countries contributes to ecological and waste management problems, leading to unsustainable development and having significant consequences in low-income countries
. According to
, municipal solid waste management (MSWM) is a vital urban service that significantly impacts public health and the environment. To mitigate these effects, every town needs an effective MSW management plan. Such a plan is essential for ensuring a healthy living standard, as well as for protecting the environment and natural resources
| [18] | Gallardo, A., Carlos, M., Peris, M., Colomer, F. J., 2014. Methodology to design a municipal solid waste generation and composition map: A case study. Waste Manag. 34, 1920-1931. https://doi.org/10.1016/j.wasman.2014.05.014 |
[18]
.
Although it is essential to characterize and quantify solid waste for effective management, there is a significant lack of knowledge regarding the characteristics and quantity of solid waste generated from non-residential municipal sources such as commercial, institutional, industrial, agricultural, and street sweeping in urban areas worldwide
| [26] | Kuluse, M., Gure, A., 2022. Challenges and Opportunities in Municipal Solid Waste Management: In the Case of Shashemene Town, West Arsi Zone, Oromia Regional State, Ethiopia. J. Solid Waste Technol. Manag. 48, 1-12. https://doi.org/10.5276/JSWTM/2022.1 |
| [39] | Roy, H., Alam, S. R., Bin-Masud, R., Prantika, T. R., Pervez, M. N., Islam, M. S., Naddeo, V., 2022. A Review on Characteristics, Techniques, and Waste-to-Energy Aspects of Municipal Solid Waste Management: Bangladesh Perspective. Sustain. 14. https://doi.org/10.3390/su141610265 |
[26, 39]
. Many studies have focused on the characteristics and quantity of residential municipal solid waste and on assessing waste generators' awareness
| [17] | Fereja, W. M., Chemeda, D. D., 2022. Status, characterization, and quantification of municipal solid waste as a measure towards effective solid waste management: The case of Dilla Town, Southern Ethiopia. J. Air \& Waste Manag. Assoc. 72, 187-201. https://doi.org/10.1080/10962247.2021.1923585 |
[17]
. However, minimal research has been conducted on the non-residential municipal solid waste sector in most urban areas worldwide, even though these sources may generate the largest percentage of municipal solid waste and therefore may have a significant impact on environmental pollution and human health
| [43] | Warmadewanthi, I. D. A. A., Reswari, S. A., 2018. Potential reduction of non-residential solid waste in Sukomanunggal district West Surabaya. IOP Conf. Ser. Earth Environ. Sci. 106. https://doi.org/10.1088/1755-1315/106/1/012071 |
[43]
.
In Africa, there has been more research on the amount and characteristics of solid waste produced by households compared to non-residential waste generators
| [24] | Kasozi, A., 2010. Applications of systems thinking in integrated solid waste management planning for African cities: the case of Nairobi, Kenya. |
[24]
. However, there has been limited investigation into the quantity, characteristics, and awareness of non-residential solid waste generators. As the continent's countries are developing, the number and variety of non-residential solid waste generators are increasing, leading to a growing amount of non-residential waste generated each year. This presents a challenging task for solid waste management, resulting in unattractive towns and cities. As stated by
| [26] | Kuluse, M., Gure, A., 2022. Challenges and Opportunities in Municipal Solid Waste Management: In the Case of Shashemene Town, West Arsi Zone, Oromia Regional State, Ethiopia. J. Solid Waste Technol. Manag. 48, 1-12. https://doi.org/10.5276/JSWTM/2022.1 |
[26]
, waste has a negative impact on the environment, economy, aesthetics, and health; therefore, it must be managed to maintain a clean environment, utilize resources wisely, and protect public health.
Managing the solid waste generated in Ethiopia, like in other developing countries, has become a major issue that leads to health damage and environmental contamination. According to
, the increasing amount of solid waste generated, coupled with the lack of a proper waste management system, is becoming a significant environmental and public health concern worldwide, particularly in major towns and cities in Ethiopia. A large proportion of the solid waste generated in the country's towns is left uncollected or disposed of in open spaces, ditches, and rivers
| [4] | Architecture, G., Ababa, A., Gelan, E., 2021. Municipal Solid Waste Management Practices for Achieving. |
[4]
. One of the reasons for this may be the poor management of municipal solid waste generated from non-residential sources. According to the reports by
| [19] | Goa, E., Sota, S. S., 2017. Generation rate and physical composition of solid waste in Wolaita Sodo Town, Southern Ethiopia 10, 415-426: https://dx.doi.org/10.4314/ejesm.v10i3.11 |
| [32] | Ng, A. Z. A. and K. T. W., 2015. Quantitative assessment of residential and non_residential solid waste generation in Alberta and British Columbia. Gen, 159, p. 1-8. |
[19, 32]
, the non-residential solid waste stream is the major generator of solid waste. A study in Alberta and British Columbia also found that non-residential waste generation was noticeably higher than residential waste generation
| [5] | Asha, A. Z., 2015. Analysis and Comparison of Solid Waste Management Systems and Diversion Practicies in Alberta and British Columbia. The University of Regina (Canada). |
[5]
. In addition, the increasing number of generators for this waste stream (non-residential) has made the management even worse. As stated by
| [43] | Warmadewanthi, I. D. A. A., Reswari, S. A., 2018. Potential reduction of non-residential solid waste in Sukomanunggal district West Surabaya. IOP Conf. Ser. Earth Environ. Sci. 106. https://doi.org/10.1088/1755-1315/106/1/012071 |
[43]
, the development of urban areas leads to increasing solid waste generation, especially waste from non-residential facilities. Most of the municipal solid waste disposed in town infrastructures and the environment may be from these sources. In addition, most of the generators of this waste stream (non-residential) are profitable. As a result, they only consider their profits, rather than the aesthetic value of the town, environment, and human health. Because of this, they dispose of or burn the solid waste that they produce everywhere within the town, without considering the health and environment. Consequently, the towns become unattractive and dirty, and lose their aesthetic value.
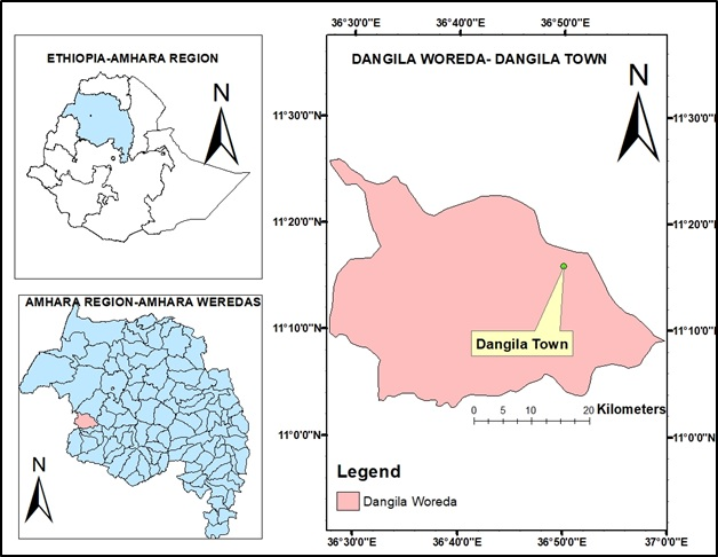
An analogous situation occurred in Dangila town (
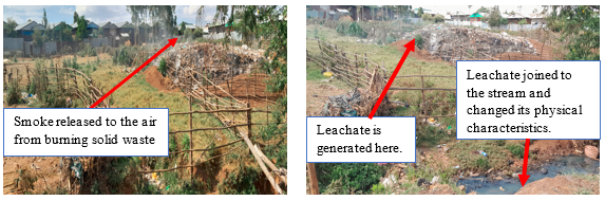
Figure 1). The researcher observed that solid waste from non-residential sources was not managed properly, either by the businesses themselves or by the municipality. It was being indiscriminately disposed of everywhere, including within the town's infrastructure. Since most of these waste generators are profit-driven businesses, they do not allocate funds for proper waste management, exacerbating the situation. The researcher's observations confirmed that banks (government), shops, and academic institutions were engaging in uncontrolled burning of their waste within their compounds. On the other hand, cafes and restaurants were indiscriminately disposing of their waste within the town. As a result, drainage lines, open spaces, street sides, and streams were filled with solid waste, negatively impacting the town's aesthetics, its residents' health, and the general environment. The researcher also observed that a large amount of solid waste is collected daily from hotels and dumped in open lands within the town by paid collectors. In addition to the previously mentioned issues, non-residential waste may be the primary source of smoke and leachate. It is crucial to determine the generation and composition of this waste stream to effectively manage it and reduce its impacts. However, in developing countries, little is known about the generation, characteristics, and management mechanisms of non-residential solid waste streams, highlighting a significant knowledge gap. Therefore, it is important to characterize, quantify, and understand the management practices of these waste generators to improve solid waste management strategies and reduce health and environmental impacts. This study aims to understand the characteristics and quantity of non-residential municipal solid waste generated in Dangila town and assess its management mechanisms to address the current situation and fill the knowledge gap regarding non-residential solid waste streams.
Figure 1. Solid waste dumped indiscriminately in open areas and its environmental pollution.
2. Materials and Methods
2.1. Study Area Description
Dangila town is situated at 11° 16' N latitude and 36° 50' E longitude, with an elevation of 2137 meters above mean sea level (
Figure 2). It is located approximately 80 km from Bahir Dar and 485 km from Addis Ababa. According to information provided by the municipality and town finance development office, there are 30 hotels, 300 shops, 150 cafes and restaurants, 14 government and private banks, 6 colleges, 11 primary schools (grades 1-8), and 3 preparatory schools (grades 9-12) in the area. In 2008, the total population of the town was estimated to be 24,827
| [34] | CSA., 2008. Summary and statistical report of the 2007 population and housing census: population size by age and sex. Federal Democratic Republic of Ethiopia, Addis Ababa. Central Statistical Agency. |
[34]
. However, the latest official estimation in 2020 showed that the population had increased to 82,654. The area of the Dangila town is about 10,403,237m
2 (
Figure 2). The average temperature is 21.26 °C. It has 97.52 mm of precipitation and 151.28 rainy days per year.
2.2. Study Design and Sampling Sources
The study was conducted between September 2022 and June 2023. Due to time, budget, and energy constraints, only commercial and institutional waste streams were analyzed. The composition, amount of solid waste generated and the way it was managed were all examined. The commercial solid waste stream was sampled only from hotels, cafes, restaurants, kiosks, and banks. The institutional solid waste stream was taken from colleges, preparatory and primary schools. The study did not cover the disposal of non-residential solid waste from agricultural, hospital, government, and private company offices, markets, health centers and street sweeping. In the town's current situation, hospitals and private company offices are negligible (they are not present in the town). Agricultural waste is somewhat important, but it is seasonal and only appears in small quantities in the town for a few months as a by-product of crop production. Market waste from non-residential solid waste streams is significant, but it was not included in this research due to time and resource constraints. In addition, the solid waste generated from health centers is significant, but it is already well managed by the health centers. They are immediately buried after use.
2.3. Identification of Sampling Sources
In order to collect a representative sample from non-residential generators for waste management purposes, the researcher conducted a key-informative interview with the municipality. This interview helped the researcher determine the types, numbers, and locations of non-residential generators that needed to be sampled. After the interview, the researcher conducted field observations to verify the information provided by the municipality. Based on this information, the researcher made decisions about the number and types of sample sources needed in each solid waste stream. The waste streams were primarily categorized as commercial and institutional, and the researcher took samples from banks, shops, hotels, cafes, and restaurants under the commercial category. For the institutional category, the researcher took samples from primary schools, secondary schools, and colleges.
2.4. Sample Size Determination
After analyzing the type, number, and distribution of non-residential facilities based on data collected from the municipality and field observation, it was determined that samples needed to be taken from a certain number of waste streams. A total of 26 sampling points were selected, with three from banks, two from colleges, two from preparatory schools (grades 9-12), two from primary schools (grades 1-8), three from hotels, nine from shops, and five from cafes and restaurants. Then, solid waste was collected from these sampling locations and further analyzed.
2.5. Sources of Data
The researcher collected necessary data from both primary and secondary sources. Primary data was obtained from field measurements, non-residential facility owner-managers, the municipality of the town, and observations made by researchers. On the other hand, secondary data was obtained by reviewing all relevant published and unpublished documents related to the topic.
2.6. Data Collection
In order to obtain data from the chosen waste stream sources, the researcher conducted key-informative interviews with the municipality to determine the type, number, and distribution in the town. To ensure accuracy, the researcher also conducted field observations. The number and type of sample sources in each waste stream were then determined. The researcher carried out key-informative interviews and focused group discussions with workers and owners at each sampling source, considering the average customers they serve, the type of waste they generate, the mechanisms they use to manage the waste, and their collaboration in sample collection at their workplaces. After identifying the sampling points, sacks were provided and coded with the source types. The sacks were replaced every day, and the collected solid waste was taken outside the town for segregation by trained collectors using a pulled cart. The segregated solid waste components’ weight and volume were then measured using a hand held balance and a graduated 1m*1m*1m defined carton box, respectively. This process was continued for seven days.
2.7. Segregation and Quantification
After being transported to the edge of the town, a segregation activity was carried out using a plastic blanket. Trained segregators, who were paid by the researcher, conducted manual hand segregation to classify the solid waste collected from selected sources. The waste was categorized into grass, food waste, bone, wood, paper, ash, plastic, and miscellaneous waste. After quantifying the weight and volume of each component, they were disposed of in a prepared burrow. The percentage composition of each component and the generation rate were then calculated using the following specific formulae:
Where, Wt.% is waste composition in percent, WSW is weight of separated waste and WMWS is weight of mixed waste sampled.
WG(kg/day)=(2)
Where, WG is waste generation, SWGS is the solid waste generated at each source, NSP is the number of sampling points and GD is generation days.
CG(kg/day)=(3)
Where, CG is the component generation, SWCGS is the solid waste component generated at each source, NSP is number of sampling points and GD is the generation days.
3. Result and Discussion
3.1. Physical Composition of Solid Waste
3.1.1. Bank and Academic Institution
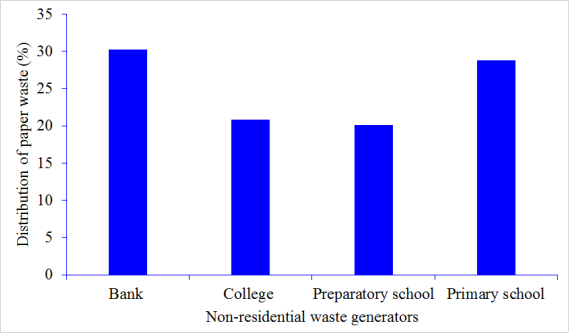
This research found that banks and academic institutions discharged paper only. Banks accounted for 30.25% of the total paper waste generated at these sources in 7 days (
Table 1,
Figure 3). Primary schools followed, comprising 28.78% of the total paper waste generated at these sources. Colleges were the third largest generators, contributing 20.86% of the paper waste, while preparatory schools generated the least amount of paper waste at 20.14%. These figures indicated that all the paper waste generated from these sources can either be recycled or decomposed. Therefore, it is crucial to implement an integrated solid waste management system to manage this waste and reduce its negative impact.
Figure 3. Distribution of paper waste generated in banks and academic institutions.
3.1.2. Hotel
According to
Table 1 and
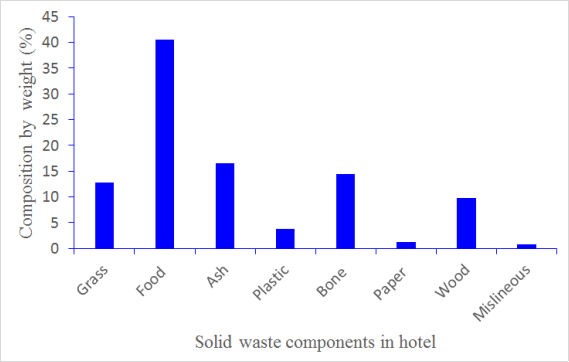
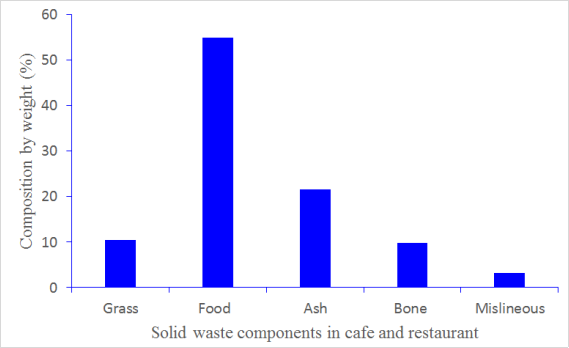
Figure 4, the waste generated in hotels consists of various components including grass, food, ash, plastic, bone, paper, wood, and miscellaneous items. Among these components, food waste accounted for the largest portion, weighing 149.06 kg (40.51%). Ash was the next largest portion, constituting 60.89 kg (16.55%) of the total waste in 7 days. Following ash was bone, which made up 52.88 kg (14.37%). Grass made up 47.13 kg (12.81%) of the total waste in 7 days. Wood waste contributed 36.09 kg (9.81%) of the total waste. Plastic was the fifth largest component, constituting 14.18 kg (3.85%). The miscellaneous items (mixtures of sweepings, dust, leaves, grass, and food waste) accounted for 2.89 kg (0.79%) of the total waste, while paper was the smallest component, comprising 4.81 kg (1.31%) of the waste.
The data indicated that 70.66% of the solid waste (food, ash, miscellaneous & grass) generated from hotels was biodegradable, while 5.16% of the solid waste was recyclable. This suggests that a total of 75.82% of the solid waste could be converted into usable resources by implementing an integrated solid waste management system. This would help to minimize its negative impact on human health and the environment and promote sustainable development.
The solid waste produced by the café and restaurant included various components such as grass, food waste, ash, bone, and miscellaneous items. According to
Table 1 and
Figure 5, 7.69 kg (10.40%) of the waste by weight was grass, and the majority of the waste, 40.65 kg (54.98%), was food waste in 7 days. Ash was the second major component, accounting for 16 kg (21.65%) of the waste, while bone and miscellaneous items made up 7.25 kg (9.81%) and 2.34 kg (3.16%) of the total waste, respectively.
Figure 4. Solid waste composition by weight in hotel.
3.1.3. Café and Restaurant
It was determined that 90.19% of the solid waste generated by these sources (cafés and restaurants) was biodegradable, while only 9.81% was non-biodegradable waste. Therefore, it would be more cost-effective to implement a suitable alternative solid waste management option for these sources to maximize benefits and minimize negative impacts.
Figure 5. Solid waste composition by weight in café and restaurant.
3.1.4. Shop
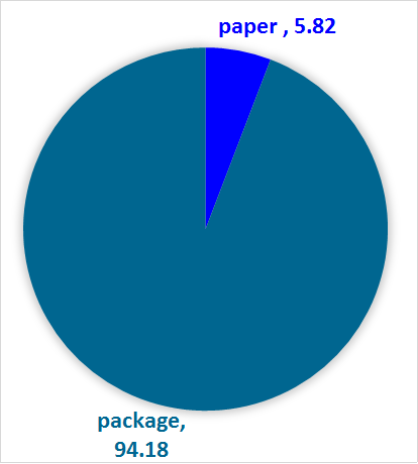
At the kiosk's sampling point, the types of solid waste were identified as paper and packaging material (thin plastics, aluminum and carton). Among these components, packaging materials accounted for the highest percentage, which was 57.46 kg (94.18%). On the other hand, paper comprised only 3.55 kg (5.82%) (
Table 1,
Figure 6). The results revealed that 37.66% of the solid waste generated by the kiosk was recyclable, while 63.44% (primarily consisting of cartons) was biodegradable. This indicates that the solid waste from the kiosks could be effectively managed through the implementation of an integrated solid waste management strategy.
Figure 6. Solid waste composition by weight in kiosk.
3.1.5. Overall Physical Composition
Based on
Table 1, food waste made up the largest portion of non-residential solid waste, accounting for 189.71 kg (37.01%). Following that, ash comprised 76.90 kg (15%) of the waste, with bone making up 60.13 kg (11.73%) and packaging material contributing 57.46 kg (11.21%). Grass and wood made up 54.82 kg (10.69%) and 36.09 kg (7.04%), respectively, while paper, plastic, and miscellaneous items accounted for 18.09 kg (3.53%), 14.18 kg (2.77%), and 5.23 kg (1.02%) of the total waste generated in 7 days.
Table 1. Physical composition in commercial and institutional generators in Dangila Town in 7 days.
Wcomponents (kg/7 days) | Hotel (kg) | Café and rest. (kg) | Bank (kg) | Shop (kg) | College (kg) | Pre. S (kg) | Prim. S (kg) | Sum (kg) | Weight (%) |
Grass | 47.13 | 7.69 | NA | NA | NA | NA | NA | 54.82 | 10.69 |
Food | 149.06 | 40.65 | NA | NA | NA | NA | NA | 189.71 | 37.01 |
Ash | 60.89 | 16.00 | NA | NA | NA | NA | NA | 76.90 | 15.00 |
Plastic | 14.18 | NA | NA | NA | NA | NA | NA | 14.18 | 2.77 |
Bone | 52.88 | 7.25 | NA | NA | NA | NA | NA | 60.13 | 11.73 |
Paper | 4.81 | NA | 2.94 | 3.55 | 2.03 | 1.96 | 2.80 | 18.09 | 3.53 |
Pmaterial | NA | NA | NA | 57.46 | NA | NA | NA | 57.46 | 11.21 |
Wood | 36.09 | NA | NA | NA | NA | NA | NA | 36.09 | 7.04 |
Mislenous | 2.89 | 2.34 | NA | NA | NA | NA | NA | 5.23 | 1.02 |
Total | 367.93 | 73.93 | 2.94 | 61.01 | 2.03 | 1.96 | 2.80 | 512.60 | 100.00 |
Hint: Wcomponents = Waste components, pre. and Prim. S = Preparatory and Primary school, NA = not available, Pmaterial = Packaging material, Café and rest. = Café and restaurant.
3.2. Solid Waste Generation Rate
3.2.1. Total Commercial and Institutional Waste Generation
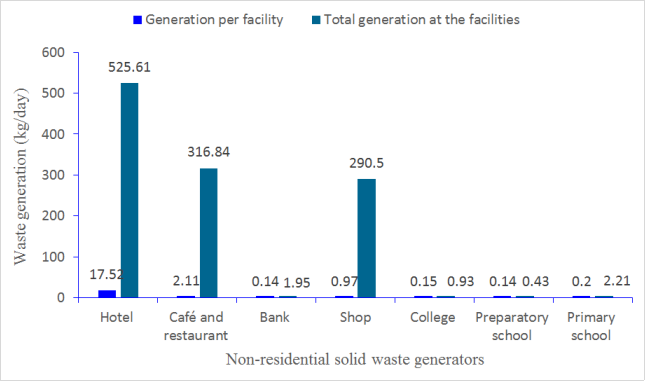
The per facility solid waste generation rate for hotels was 17.52 kg/day, resulting in a total daily generation of 525.61 kg in the town (
Figure 7 and
Table 2). For cafes and restaurants, the estimated per facility solid waste generation rate was 2.11 kg/ day, with a daily solid waste generation of 316.84 kg. The daily solid waste generated per bank was 0.14 kg. The per facility solid waste generation rate for kiosks was 0.97 kg/day, with a total generation rate of 290.50 kg/day. For colleges, preparatory and primary schools, the per facility solid waste generation rates were 0.15, 0.14, and 0.20 kg/day respectively, with a total solid waste generation rate of 0.93, 0.43, and 2.21 kg/day (
Figure 7). This results in a total solid waste generation rate of 1,136.52 kg per day in the town. From this total, the non-residential solid waste generated included 841.44 kg/day of biodegradable waste, 136.52 kg/day of recyclable waste, and 158.56 kg/day of non-biodegradable solid waste.
Figure 7. Solid waste generation rate per facility and estimated total generation in Dangila Town.
3.2.2. Waste Components Generation Across Facilities
The generation rate of grass fluctuated between 0 and 2.24 kg/day. The highest value of grass (2.24 kg/day) was observed from the hotel, followed by the café and restaurant (0.22 kg/day). Grass generation was negligible at the bank, kiosk, and college, preparatory and primary schools (
Table 2). Food waste generation was also negligible at these facilities, but it was 1.16 and 7.10 kg/day at the café & restaurant and hotel, respectively, with the highest value recorded at the hotel. Similarly, ash generation was negligible at the bank, shop, college, preparatory and primary school, whereas it was 0.46 kg/day at the café & restaurant and 2.90 kg/day at the hotel. Plastic generation was nil at all the facilities except the hotel, where it was recorded as 0.68 kg/day (
Table 2).
Table 2. Commercial and institutional waste components generation in Dangila Town.
Wcomponents (kg/facility/day) | Hotel | Café and rest. | Bank | Shop | College | Prepa_S | Prima_S |
Grass | 2.24 | 0.22 | NA | NA | NA | NA | NA |
Food | 7.10 | 1.16 | NA | NA | NA | NA | NA |
Ash | 2.90 | 0.46 | NA | NA | NA | NA | NA |
Plastic | 0.68 | NA | NA | NA | NA | NA | NA |
Bone | 2.52 | 0.21 | NA | NA | NA | NA | NA |
Paper | 0.23 | NA | 0.14 | 0.06 | 0.15 | 0.14 | 0.20 |
Packm | NA | NA | NA | 0.91 | NA | NA | NA |
Wood | 1.72 | NA | NA | NA | NA | NA | NA |
Mislenous | 0.14 | 0.07 | NA | NA | NA | NA | NA |
Hint: W = Waste, rest. = Restaurants, Prepa_S = Preparatory school, Prima_s = Primary school, Packm = Packaging material
The bone generation rate of the samples ranged from 0 to 2.52 kg/day, with the hotel having the highest value of 2.52 kg/day, followed by the café and restaurant (0.21 kg/day). The generation rate of paper ranged from 0 to 0.23 kg/day. The highest value was recorded at the hotel with 0.23 kg/day, followed by the primary school with 0.20 kg/day, college (0.15 kg/day), bank and preparatory school (0.14 kg/day), shop (0.06 kg/day), and negligible value at the café & restaurant. The packaging material was negligible at all the facilities except the shop, where it was recorded as 0.91 kg/day. Wood generation was 1.72 kg/day at the hotel, while it was negligible at the rest of the facilities. The miscellaneous generation rate of the samples varied between zero and 0.14 kg/day, with the highest value registered at the hotel (0.14 kg/day). The café and restaurant had a generation rate of 0.07 kg/day, while it was nil at the bank, shop, college, preparatory and primary schools (
Table 2).
3.3. Solid Waste Generators Management Mechanism
3.3.1. Waste Collection
According to the interview with the municipality, there was a fragmented and disorganized waste collection system. The service charge for collection for hotels was paid to the municipality even if it was not paid in conjunction with the water bill. Then the municipality paid for the individuals who collected daily from these waste sources (hotels) and disposed of it indiscriminately on open land left within the town. For instance, hotels were classified into three groups based on their income level (low, middle, and high income) hotels. High-income hotels paid 400 ETB (Ethiopian birrs) (3.29 USD) per month, middle-income hotels paid 200 ETB (1.65 USD) per month, and low-income hotels paid 100 ETB (0.82 USD) per month, collected daily. However, both governmental and non-governmental colleges organized kebele-level (the lowest administrative unit), which confirmed low-income students to collect the solid waste generated in their compound. These students collect the solid waste generated in the compound daily at the end of the day. Lower-grade academic institutions (grades 1-8 and 9-12) employed temporary solid waste collectors who were paid 500 ETB per month. These collectors collect the solid waste generated in the compound every week. Cafes and restaurants were not connected with the municipality's solid waste collection system. They had a single customer who transported the onsite collected solid waste daily and disposed of what is suitable only for him within the town (open land, ditch, forest, and stream). Government banks had formal or employed onsite solid waste collectors. These collectors collect the daily generated waste at the end of the working time and place it in the burial. Non-governmental banks also had a formal solid waste collector who collects the daily generated solid waste at the end of the working time. However, the collected waste is transported by a paid waste disposer who transports this waste and disposes it to the area that is suitable for him or her within the town without considering the aesthetic value of the town, environment, and human health. Shopkeepers collect and burn their waste onsite only without any transportation.
3.3.2. Sorting
In the interview, the municipality said that there was no sorting activity carried out by either the commercial or the institutional solid waste generators. This was also confirmed by the commercial and institutional center workers and owners during focused group discussions as they did not undertake any segregation activity. In addition, the researcher also proved that none of the waste stream sources carried out a sorting activity. They simply collected and stored all types of solid waste that they generated in a single sack as it is generated without a component separation.
3.3.3. Reuse
During a key informative interview, the municipality stated that no institutions or commercial centers in the town reused the solid waste they generated for any purpose. Instead, they collected and stored all of the waste onsite in sacks at a temporary location. The workers and owners of these establishments confirmed this during interviews with the researcher. Additionally, the researcher conducted a field survey and confirmed that none of the solid waste generators reused their waste.
3.3.4. Recycle
Neither the commercial center nor the institutions in the town recycled the solid waste they generated. The municipality claimed that the concept of recycling was new to them and would require time, effort, and resources to educate the generators and implement the idea. The generators also confirmed that they were not aware of this concept and had not discussed it in any meetings. The researcher observed that none of the solid waste generators recycled their waste, even if they generated recyclable materials. It is clear that there is a need for continuous awareness campaigns, and government budget to make recycling a reality in the town.
3.3.5. Composting
According to an interview with the municipality, none of the generators used the solid waste for compost. The institutional and commercial workers and owners also stated that they did not use the waste they generated for compost preparation. The researcher confirmed these claims through field observation, as no solid waste was being used for compost.
3.3.6. Waste Disposal
During an interview with the municipality, it was revealed that there is no formal disposal site for the town. As a result, the solid waste generated by hotels is disposed of in open areas and burned within the town without considering environmental, health, and aesthetic issues. However, the amount of deposited solid waste is huge and it is not completely burned, resulting in the release of a large amount of smoke in the area for several weeks. The researcher confirmed during a field observation that the solid waste generated by these sources were disposed of in an open land which has been left for future construction and green area development for recreation for the villagers. During a field survey, the researcher observed a conflict between the municipality and the villagers near an open land which is used for temporary disposal. The villagers complained that they become unhealthy due to the bad odor and the large smoke released from the solid waste deposited. The researcher also observed that the leachate formed from the deposited solid waste moved and joined the nearby stream, which is causing severe pollution of water bodies.
The municipality said that the waste produced by the cafes and restaurants was being disposed of by the generators themselves. Although the municipality did not monitor or control their disposal methods, it believed that cafés and restaurants were disposing of the waste outside the town's limits. However, during a focused group discussion with these generators' workers and owners, it was revealed that cafes and restaurants had a single customer who collected their waste once a week and disposed of it indiscriminately within the town, on open land, in ditches, forests, and at the bank stream. The researcher also confirmed that these individuals paid by the generators were disposing of the waste in these areas without any regard for the environment.
Colleges, both governmental and non-governmental, use uncontrolled burning as a method of waste disposal. The solid waste generated within the college compound is stored in small pits that are specifically prepared for this purpose and burned. Similarly, lower grade academic institutions (grades 1-8 and 9-12) also use uncontrolled burning for waste disposal. They prepare their own small pit within their compound and burn the waste weekly, leading to air pollution. The researcher has observed that these institutions used burning as a method of waste disposal.
Government-owned banks were found to be disposing of their solid waste by burning it within the bank compound. The waste generated each day was stored and then burned. Bank staff, including the manager, admitted to using uncontrolled burning methods to dispose of the solid waste generated in their workplace. On the other hand, non-governmental banks followed a similar waste disposal process as cafes and restaurants. They hired a waste disposal service to collect and transport their waste to an appropriate disposal site. Unfortunately, these waste collectors did not consider the aesthetic value of the town, environment, or human health. The bank workers also confirmed that they paid individuals to transport and dispose of their solid waste, but they did not know who these individuals were. However, the researcher found out that the paid waste collectors disposed of the waste indiscriminately within the town, including on roadsides, ditches, and near streams.
The municipality believed that the shopkeepers were getting rid of their waste outside of town. However, during a group discussion with the shopkeepers, they claimed that they disposed of their solid waste outside the town's edge every week for a fee. But as the researcher observed, the disposal of the shopkeepers' solid waste was depend on the location of their shop. Shops near ditches disposed of their waste in those ditches, while those near the main road would burn their waste on the road. Shops located near streams would dispose of their waste in those streams. For shops located outside of these areas, individuals were paid to transport and dispose of the waste indiscriminately within the town. All of this indicates that the solid waste generated by these streams is managed fragmentally and disposed of indiscriminately.