
Urban expansion has predominantly occurred in peri-urban areas rather than within the urban core. It is mainly determined by unorganised growth, increased immigration, and rapid population growth in the urban fringe areas. The present paper analyses the trend of urbanisation, the land use and land cover change (LULC), and growth of built-up area in the Barasat-Barrackpore urban areas over the last four decades since 1990. The LULC change was prepared by using the Landsat images for the years of 1990, 2000, 2010, and 2020 by applying the maximum likelihood algorithm of supervised classification with the help of Remote Sensing and GIS techniques in ArcGIS. The four urban landscapes viz. urban core area, peri-urban area, scatter settlements, and open spaces were categorised using the NDBI sprawl matrix for analysing the magnitude and direction of urban growth. It is found that the urban population, urban area and urban units increased by 54%, 32%, and 42%, respectively in the period of 2001- 2011. The built-up area increased in 102.50%, while agricultural, vegetation cover, fallow, and wetlands decreased in 23%, 59%, 60%, and 57%, accordingly. It is also known, by conversion matrix, that agricultural lands have been converted into built-up and fallow lands, vegetative cover into built-up, fallow lands and agriculture, fallow lands into built-up and agricultural, wetlands into fallow lands, agricultural and built-up area, respectively. This study may help the planners and policy-makers for sustainable urban development.
| Published in | American Journal of Remote Sensing (Volume 14, Issue 2) |
| DOI | 10.11648/j.ajrs.20261402.16 |
| Page(s) | 99-117 |
| Creative Commons |
This is an Open Access article, distributed under the terms of the Creative Commons Attribution 4.0 International License (http://creativecommons.org/licenses/by/4.0/), which permits unrestricted use, distribution and reproduction in any medium or format, provided the original work is properly cited. |
| Copyright |
Copyright © The Author(s), 2026. Published by Science Publishing Group |
Urbanisation, Land Conversion, NDBI, Urban Core, Peri-Urban Area
 (1)
(1) 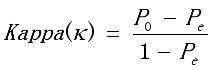 (2)
(2) Time 1 | Time 2 | Total Time 1 | Loss | ||
|---|---|---|---|---|---|
Category 1 | Category 2 | Category 3 | |||
Category 1 | P11 | P12 | P13 | P1+ | P1+ - P11 |
Category 2 | P21 | P24 | P23 | P2+ | P2+ - P22 |
Category 3 | P31 | P32 | P33 | P3+ | P3+ - P33 |
Total Time 2 | P+1 | P+2 | P+3 | 1 | |
Gain | P+1 - P11 | P+2 - P22 | P+1 - P33 | ||
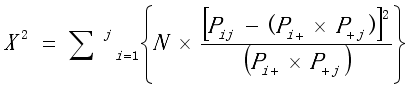 (3)
(3) 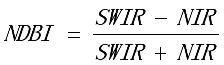 (4)
(4) Urban spatial pattern | Criteria |
|---|---|
Urban core area | The highest contiguous group of built-up pixels in which at least 50% of the surrounding neighbourhood is highly built up |
Peri-Urban area | Built-up pixels that have neighborhoods with 30 -50% built-up |
Scatter Settlement | Built-up pixels that have neighborhoods that are less than 30% built-up and not belonging to a ribbon development |
Open space | The non-urban patches surrounding urban core and peri-urban areas |
LULC Class | LULC classification (km2) | LULC Classification (%) | Change of LULC (%) | Total Change (1990-2020) | Avrage Rate of Change (1990-2020) | ||||||||
|---|---|---|---|---|---|---|---|---|---|---|---|---|---|
1990 | 2000 | 2010 | 2020 | 1990 | 2000 | 2010 | 2020 | 1990-2000 | 2000-2010 | 2010-2020 | |||
Agricultural | 126.6 | 133.1 | 120.0 | 97.3 | 35.3 | 37.1 | 33.5 | 27.1 | 5.2 | -9.8 | -18.9 | -29.2 | -23.1 |
Fallow Lands | 10.9 | 14.2 | 5.7 | 4.3 | 3.0 | 4.0 | 1.6 | 1.2 | 30.6 | -59.7 | -25.4 | -6.6 | -60.8 |
Built-up | 103.2 | 119.7 | 169.6 | 209.0 | 28.8 | 33.4 | 47.3 | 58.3 | 16.0 | 41.7 | 23.2 | 105.8 | 102.5 |
Vegetation | 103.4 | 79.3 | 55.9 | 41.7 | 28.8 | 22.1 | 15.6 | 11.6 | -23.3 | -29.5 | -25.3 | -61.6 | -59.6 |
Wetlands | 14.6 | 12.3 | 7.4 | 6.2 | 4.1 | 3.4 | 2.1 | 1.7 | -16.3 | -39.5 | -16.2 | -8.4 | -57.6 |
Overall Accuracy (%) | 85.51 | 88.49 | 86.25 | 87.21 | |||||||||
Kappa Co-efficient (k) | 0.86 | 0.88 | 0.86 | 0.87 | |||||||||
LULC Classification | LULC Class-2000 | |||||||
|---|---|---|---|---|---|---|---|---|
Agriculture | Fallow Lands | Built-up | River | Vegetation | Wetlands | Grand Total | ||
LULC Class-1990 | Agricultural | 74.88 | 6.41 | 22.97 | 0.07 | 19.71 | 2.5 | 126.56 |
Fallow Lands | 6.15 | 4.03 | 0.51 | 0.02 | 0.16 | 0.05 | 10.89 | |
Built-up | 17.56 | 3.36 | 75.72 | 0.06 | 5.12 | 1.39 | 103.19 | |
River | 0.01 | 0.03 | 0.1 | 10.33 | 0.01 | 0.69 | 11.13 | |
Vegetation | 33.86 | 0.39 | 11.91 | 0.01 | 53.38 | 3.82 | 103.37 | |
Wetlands | 0.67 | 0.02 | 8.49 | 0.76 | 0.89 | 3.81 | 14.64 | |
Grand Total | 133.12 | 14.22 | 119.71 | 11.22 | 79.26 | 12.26 | 369.77 | |
Change (km2) | 6.57 | 3.33 | 16.51 | 0.09 | -24.12 | -2.38 | ||
Change (%) | 5.19 | 30.59 | 15.97 | 0.81 | -23.33 | -16.26 | ||
LULC Classification | LULC Class-2010 | |||||||
|---|---|---|---|---|---|---|---|---|
Agriculture | Fallow Lands | Built-up | River | Vegetation | Wetlands | Grand Total | ||
LULC Class-2000 | Agricultural | 69.41 | 1.92 | 39.93 | 0.02 | 20.54 | 1.31 | 133.12 |
Fallow Lands | 7.63 | 1.35 | 4.37 | 0.01 | 0.81 | 0.05 | 14.22 | |
Built-up | 8.77 | 1.52 | 99.76 | 0.15 | 8.86 | 0.66 | 119.71 | |
River | 0.2 | 0.05 | 0.22 | 10.04 | 0.22 | 0.48 | 11.22 | |
Vegetation | 31.17 | 0.38 | 21.89 | 0.1 | 24.59 | 1.12 | 79.26 | |
Wetlands | 2.85 | 0.51 | 3.43 | 0.81 | 0.88 | 3.78 | 12.26 | |
Grand Total | 120.02 | 5.73 | 169.6 | 11.12 | 55.89 | 7.41 | 369.77 | |
Change (km2) | -13.1 | -8.49 | 49.89 | -0.09 | -23.37 | -4.85 | ||
Change (%) | -9.84 | -59.71 | 41.68 | -9.3 | -29.48 | -39.54 | ||
LULC Classification | LULC Class-2020 | |||||||
|---|---|---|---|---|---|---|---|---|
Agriculture | Fallow Lands | Built-up | River | Vegetation | Wetlands | Grand Total | ||
LULC Class-2010 | Agricultural | 69.28 | 0.33 | 34.68 | 0.02 | 13.64 | 0.09 | 118.02 |
Fallow Lands | 1.04 | 1.51 | 2.28 | 0.02 | 0.05 | 0.84 | 5.73 | |
Built-up | 12.95 | 2.34 | 150.81 | 0.01 | 3.42 | 1.08 | 169.6 | |
River | 0.01 | 0.03 | 0.1 | 11.01 | 0.03 | 0.05 | 11.12 | |
Vegetation | 12.96 | 0.05 | 18.37 | 0.01 | 24.44 | 0.05 | 55.89 | |
Wetlands | 1.07 | 0.03 | 0.83 | 0.23 | 0.15 | 5.11 | 7.41 | |
Grand Total | 97.32 | 4.27 | 206.96 | 11.29 | 41.72 | 6.21 | 369.77 | |
Change (km2) | -22.71 | -1.46 | 39.37 | 0.16 | -14.17 | -1.2 | ||
Change (%) | -18.92 | -25.44 | 23.21 | 1.46 | -25.35 | -16.2 | ||
Urban landscape pattern | Area in in km2 | Change in km2 | |||||
|---|---|---|---|---|---|---|---|
1990 | 2000 | 2010 | 2020 | 1990- 2000 | 2000-2010 | 2010-2020 | |
Urban core Area | 85.34 | 95.84 | 102.14 | 106.88 | 10.5 | 6.3 | 4.74 |
Peri-Urban Area | 56 | 71.74 | 124.79 | 165.3 | 15.74 | 53.05 | 40.51 |
Scatter Settlement | 189.86 | 173.6 | 113.23 | 85.11 | -16.26 | -60.38 | -28.12 |
Open Space | 38.36 | 29.37 | 20.43 | 15.3 | -8.99 | -8.94 | -5.13 |
GIS | Geographic Information System |
LULC | Land Use and Land Cover |
USGS | United States Geological Survey |
NDBI | Normalized Difference Built-up Index |
NIR | Near-infrared |
SWIR | Short-Wave Infrared |
TM | Thematic Mapper |
ETM+ | Enhanced Thematic Mapper Plus |
OLI | Operational Land Imager |
| [1] | Lambin, E. F., Geist, H. J., & Lepers, E. (2003). Dynamics of land-use and land-cover change in tropical regions. Annual Review of Environment and Resources, 28(1), 205–241. |
| [2] | Attua, E. M., & Fisher, J. B. (2011). Historical and future land-cover change in a municipality of Ghana. Earth Interactions, 15(9), 1–26. |
| [3] | Mohan, M., Pathan, S. K., Narendrareddy, K., Kandya, A., & Pandey, S. (2011). Dynamics of urbanisation and its impact on land-use/land-cover: A case study of megacity Delhi. Journal of Environmental Protection, 2(9), 1274–1283. |
| [4] | Farooq, S., & Ahmad, S. (2008). Urban sprawl development around Aligarh city: A study aided by satellite remote sensing and GIS. Journal of the Indian Society of Remote Sensing, 36(1), 77–88. |
| [5] | Deng, J. S., Wang, K., Hong, Y., & Qi, J. G. (2009). Spatio-temporal dynamics and evolution of land use change and landscape pattern in response to rapid urbanisation. Landscape and Urban Planning, 92(3–4), 187–198. |
| [6] | Weng, Q., Liu, H., & Lu, D. (2007). Assessing the effects of land use and land cover patterns on thermal conditions using landscape metrics in the city of Indianapolis, United States. Urban Ecosystems, 10(2), 203–219. |
| [7] | Herold, M., Couclelis, H., & Clarke, K. C. (2005). The role of spatial metrics in the analysis and modeling of urban land use change. Computers, Environment and Urban Systems, 29(4), 369–399. |
| [8] | United Nations. (2014). World urbanisation prospects: The 2014 revision. United Nations, Department of Economic and Social Affairs, Population Division. Retrieved May 2015. |
| [9] | Bhatta, B. (2009, February). Spatio-temporal analysis to detect urban sprawl using geoinformatics: a case study of Kolkata. In Proceedings of the 7th All India Peoples’ Technology Congress, Kolkata, India, 6-7. |
| [10] | Sahana, M., Hong, H., & Sajjad, H. (2018). Analyzing urban spatial patterns and trend of urban growth using urban sprawl matrix: A study on Kolkata urban agglomeration, India. Science of the Total Environment, 628–629, 1557–1566. |
| [11] | Sardar, J., & Hazra, S. (2015). Application of multi criteria analysis in delineation of peri-urban area: A case study of North 24 Parganas District, West Bengal. International Journal of Scientific Research, 4(11), 96–100. |
| [12] | Yeh, A. G. O., & Li, X. (2001). Measurement and monitoring of urban sprawl in a rapidly growing region using entropy. Photogrammetric Engineering & Remote Sensing, 67(1), 83–90. |
| [13] | Sudhira, H. S., Ramachandra, T. V., & Jagadish, K. S. (2004). Urban sprawl: Metrics, dynamics and modelling using GIS. International Journal of Applied Earth Observation and Geoinformation, 5(1), 29–39. |
| [14] | Xiao, J., Shen, Y., Ge, J., Ryutaro Tateishi, Tang, C., Liang, Y., & Huang, Z. (2006). Evaluating urban expansion and land use change in Shijiazhuang, China, by using GIS and remote sensing. Landscape and Urban Planning, 75(1–2), 69–80. |
| [15] | Cohen, J. (1960). A coefficient of agreement for nominal scales. Educational and Psychological Measurement, 20(1), 37–46. |
| [16] | Galton, F. (1892). Finger Prints MacMillan and Co. London and New York. |
| [17] | Parent, J., Civco, D., & Angel, S. (2008). Urban growth analysis: calculating metrics to quantify urban sprawl. University of Connecticut: Storrs, CT, USA. |
| [18] | Lu, D., Batistella, M., & Moran, E. (2004). Multitemporal spectral mixture analysis for Amazonian land-cover change detection. Canadian Journal of Remote Sensing, 30(1), 87–100. |
| [19] | Landis, J. R., & Koch, G. G. (1977). The measurement of observer agreement for categorical data. Biometrics, 33(1), 159–174. |
| [20] | Pontius, R. G., Shusas, E., & McEachern, M. (2004). Detecting important categorical land changes while accounting for persistence. Agriculture, Ecosystems & Environment, 101(2–3), 251–268. |
| [21] | Zha, Y., Gao, J., & Ni, S. (2003). Use of normalized difference built-up index in automatically mapping urban areas from TM imagery. International Journal of Remote Sensing, 24(3), 583–594. |
| [22] | Maingi, J. K., Kepner, W. G., & Edmonds, C. M. (2002). An accuracy assessment of 1992 Landsat-MSS derived land cover for the Upper San Pedro Watershed (U.S./Mexico) (EPA/600/R-02/040). National Exposure Research Laboratory, U.S. Environmental Protection Agency. |
| [23] | Das, S., & Angadi, D. P. (2020). Spatio-temporal Analysis of Urban Functional Development and its Zone of Influence: A Micro Level Study of Barrackpore Subdivision, West Bengal. Urban India, 40(2), 118-137. |
| [24] | Mondal, D., & Sen, S. (2020). Methodological dimensions of delineating peri-urban areas: The case of Kolkata metropolis. Environment and Urbanisation ASIA, 11(2), 183–194. |
| [25] | Anderson, J. R., Hardy, E. E., Roach, J. T., & Witmer, R. E. (1976). A land use and land cover classification system for use with remote sensor data (U.S. Geological Survey Professional Paper 964). U.S. Government Printing Office. |
| [26] | Dutta, D., Rahman, A., Paul, S. K., & Kundu, A. (2020). Estimating urban growth in peri-urban areas and its interrelationships with built-up density using earth observation datasets. The Annals of Regional Science, 65(1), 67–82. |
| [27] | Congalton, R. G., & Green, K. (2019). Assessing the accuracy of remotely sensed data: Principles and practices (3rd ed.). CRC Press. |
| [28] | Pramanick, M. Urban Sprawling in Barracpore Subdivision of North 24 Parganas District, West Bengal, Institute of Landsape, Ecology & Ekistics, 2018, 41(2), 81- 96, ISSN 0971- 4170. |
| [29] | Wandl, A., Rooij, R., & Rocco, R. (2017). Towards sustainable territories-in-between: a multidimensional typology of open spaces in Europe. Planning Practice & Research, 32(1), 55–84. |
| [30] | Mondal, B. K., Sarkar, D., Patra, R., Das, R., & Basu, T. (2024). Detecting urban sprawling and periurban land use dynamics in major satellite towns of Kolkata metropolitan area, India: A geospatial approach. In Modern Cartography Series (Vol. 11, pp. 247–291). Academic Press. |
| [31] | Hasnine, M., & Rukhsana. (2020). An analysis of urban sprawl and prediction of future urban town in urban area of developing nation: Case study in India. Journal of the Indian Society of Remote Sensing, 48(6), 909–920. |
| [32] | Bera, S., & Das Chatterjee, N. (2019). Mapping and monitoring of land use dynamics with their change hotspot in North 24-Parganas district, India: A geospatial- and statistical-based approach. Modeling Earth Systems and Environment, 5(4), 1529–1551. |
| [33] | Habibi, S., & Asadi, N. (2011). Causes, results and methods of controlling urban sprawl. Procedia Engineering, 21, 133–141. |
| [34] | Longley, P. A., Batty, M., Shepherd, J., & Sadler, G. (1992). Do green belts change the shape of urban areas? A preliminary analysis of the settlement geography of South East England. Regional Studies, 26(5), 437–452. |
| [35] | Coughlin, R. E. (1991). Formulating and evaluating agricultural zoning programs. Journal of the American Planning Association, 57(2), 183–192. |
| [36] | Alterman, R. (1997). The challenge of farmland preservation: Lessons from a six-nation comparison. Journal of the American Planning Association, 63(2), 220–243. |
| [37] | Sorensen, A. (2000). Land readjustment and metropolitan growth: An examination of suburban land development and urban sprawl in the Tokyo metropolitan area. Progress in Planning, 53(4), 217–330. |
| [38] | Mithun, S. et al. (2021). Monitoring metropolitan growth dynamics in Kolkata Metropolitan Area. Remote Sensing, 13(21), 4423. |
| [39] | Kannan, E., et al. (2020). Spatial economic analysis of agricultural land use changes: A case of peri-urban Bangalore, India. Journal of the Asia Pacific Economy. |
APA Style
Pramanick, M., Satpati, L. (2026). Evaluating the Dynamics of Urban Expansion and Land Use-Land Cover Change in the Inter-Urban Areas of Barasat and Barrackpore of West Bengal, India. American Journal of Remote Sensing, 14(2), 99-117. https://doi.org/10.11648/j.ajrs.20261402.16
ACS Style
Pramanick, M.; Satpati, L. Evaluating the Dynamics of Urban Expansion and Land Use-Land Cover Change in the Inter-Urban Areas of Barasat and Barrackpore of West Bengal, India. Am. J. Remote Sens. 2026, 14(2), 99-117. doi: 10.11648/j.ajrs.20261402.16
AMA Style
Pramanick M, Satpati L. Evaluating the Dynamics of Urban Expansion and Land Use-Land Cover Change in the Inter-Urban Areas of Barasat and Barrackpore of West Bengal, India. Am J Remote Sens. 2026;14(2):99-117. doi: 10.11648/j.ajrs.20261402.16
@article{10.11648/j.ajrs.20261402.16,
  author = {Madhusudan Pramanick and Lakshminarayan Satpati},
  title = {Evaluating the Dynamics of Urban Expansion and Land Use-Land Cover Change in the Inter-Urban Areas of Barasat and Barrackpore of West Bengal, India},
  journal = {American Journal of Remote Sensing},
  volume = {14},
  number = {2},
  pages = {99-117},
  doi = {10.11648/j.ajrs.20261402.16},
  url = {https://doi.org/10.11648/j.ajrs.20261402.16},
  eprint = {https://article.sciencepublishinggroup.com/pdf/10.11648.j.ajrs.20261402.16},
  abstract = {Urban expansion has predominantly occurred in peri-urban areas rather than within the urban core. It is mainly determined by unorganised growth, increased immigration, and rapid population growth in the urban fringe areas. The present paper analyses the trend of urbanisation, the land use and land cover change (LULC), and growth of built-up area in the Barasat-Barrackpore urban areas over the last four decades since 1990. The LULC change was prepared by using the Landsat images for the years of 1990, 2000, 2010, and 2020 by applying the maximum likelihood algorithm of supervised classification with the help of Remote Sensing and GIS techniques in ArcGIS. The four urban landscapes viz. urban core area, peri-urban area, scatter settlements, and open spaces were categorised using the NDBI sprawl matrix for analysing the magnitude and direction of urban growth. It is found that the urban population, urban area and urban units increased by 54%, 32%, and 42%, respectively in the period of 2001- 2011. The built-up area increased in 102.50%, while agricultural, vegetation cover, fallow, and wetlands decreased in 23%, 59%, 60%, and 57%, accordingly. It is also known, by conversion matrix, that agricultural lands have been converted into built-up and fallow lands, vegetative cover into built-up, fallow lands and agriculture, fallow lands into built-up and agricultural, wetlands into fallow lands, agricultural and built-up area, respectively. This study may help the planners and policy-makers for sustainable urban development.},
 year = {2026}
}
TY  - JOUR
T1  - Evaluating the Dynamics of Urban Expansion and Land Use-Land Cover Change in the Inter-Urban Areas of Barasat and Barrackpore of West Bengal, India
AU  - Madhusudan Pramanick
AU  - Lakshminarayan Satpati
Y1  - 2026/09/24
PY  - 2026
N1  - https://doi.org/10.11648/j.ajrs.20261402.16
DO  - 10.11648/j.ajrs.20261402.16
T2  - American Journal of Remote Sensing
JF  - American Journal of Remote Sensing
JO  - American Journal of Remote Sensing
SP  - 99
EP  - 117
PB  - Science Publishing Group
SN  - 2328-580X
UR  - https://doi.org/10.11648/j.ajrs.20261402.16
AB  - Urban expansion has predominantly occurred in peri-urban areas rather than within the urban core. It is mainly determined by unorganised growth, increased immigration, and rapid population growth in the urban fringe areas. The present paper analyses the trend of urbanisation, the land use and land cover change (LULC), and growth of built-up area in the Barasat-Barrackpore urban areas over the last four decades since 1990. The LULC change was prepared by using the Landsat images for the years of 1990, 2000, 2010, and 2020 by applying the maximum likelihood algorithm of supervised classification with the help of Remote Sensing and GIS techniques in ArcGIS. The four urban landscapes viz. urban core area, peri-urban area, scatter settlements, and open spaces were categorised using the NDBI sprawl matrix for analysing the magnitude and direction of urban growth. It is found that the urban population, urban area and urban units increased by 54%, 32%, and 42%, respectively in the period of 2001- 2011. The built-up area increased in 102.50%, while agricultural, vegetation cover, fallow, and wetlands decreased in 23%, 59%, 60%, and 57%, accordingly. It is also known, by conversion matrix, that agricultural lands have been converted into built-up and fallow lands, vegetative cover into built-up, fallow lands and agriculture, fallow lands into built-up and agricultural, wetlands into fallow lands, agricultural and built-up area, respectively. This study may help the planners and policy-makers for sustainable urban development.
VL  - 14
IS  - 2
ER  -
Department of Geography, Prabhu Jagatbandhu College, Howrah, India
Department of UGC-HRDC, University of Calcutta, Kolkata, India
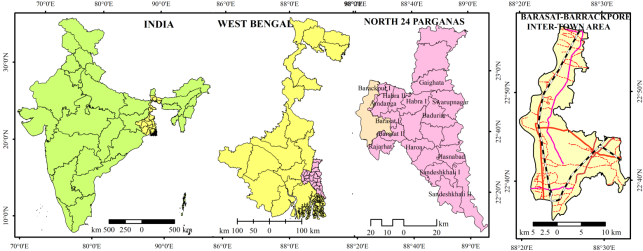
Figure 1. Location of the study area
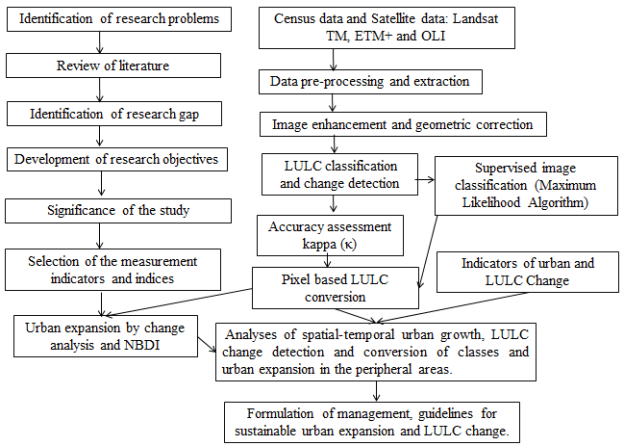
Figure 2. Methodological Framework of the study.
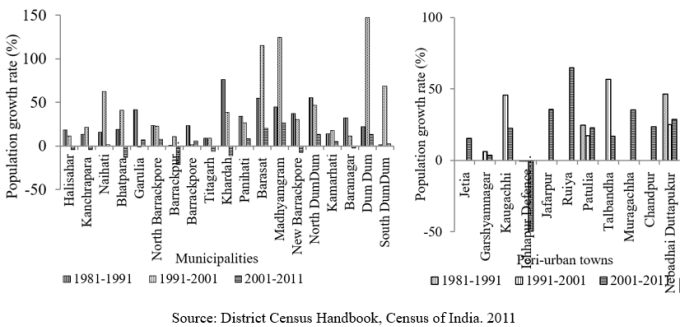
Figure 3. (a) Trend of population growth in munipalities towns (b) Trend of population growth in peri-urban towns
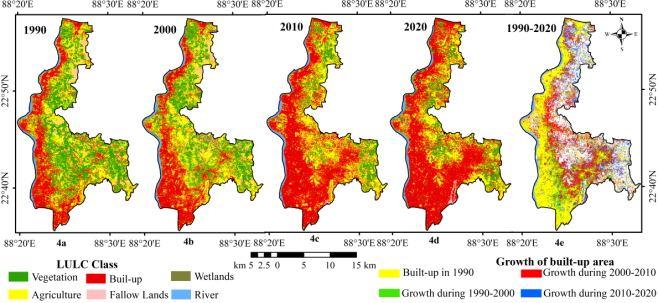
Figure 4. (a- d) Classification of land use land land cover maps (e) Growth of built-up area in the study area.
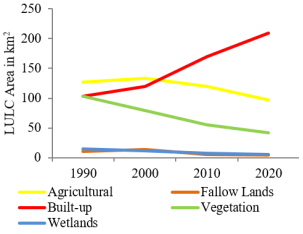
Figure 5. Trend of LULC class from 1990 to 2020.
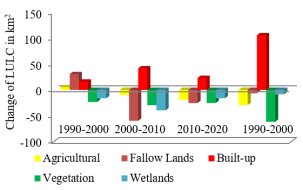
Figure 6. Change detection analysis of LULC classes from 1990 to 2020.
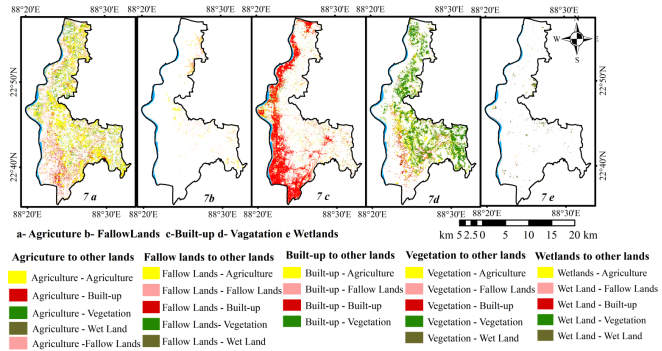
Figure 7. Pixel-based conversion of LULC classes during 1990-2000 (a-e).
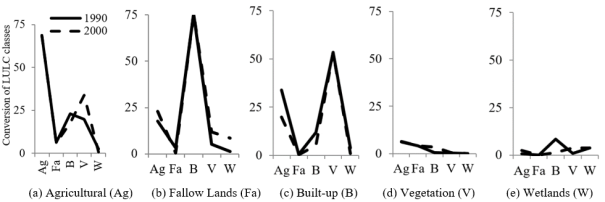
Figure 10. The trends in conversion of land use and land cover types in the period of 1990-2000.
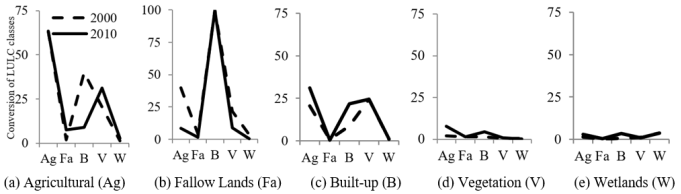
Figure 11. The trends in conversion of land use and land cover types during 2000-2010.
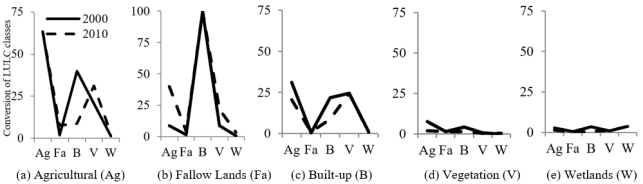
Figure 12. The trends in conversion of landuse and land cover types in the period of 2010-2020.
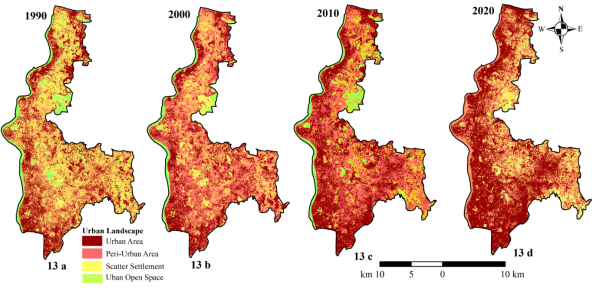
Figure 13. Temporal dynamics of urban built-up areas from 1990 to 2020 (a-d).

Information



 Share This Article
 Twitter
 Linked In
 Facebook
 Copy
Copy Download