2. Theoretical Background
2.1. Operation of Evacuated Tube Collectors
Evacuated tube collectors (ETCs) are solar thermal systems that use vacuum-sealed glass tubes to minimize heat losses while maximizing solar energy absorption. Several configurations of ETCs exist, each characterized by its heat transfer mechanism and system design. These configurations include U-pipe systems, thermosyphon systems, heat pipe systems, batch or integrated systems, and compound parabolic concentrator (CPC)-assisted systems
| [7] | Sabiha, M. A., Saidur, R., Mekhilef, S., & Mahian, O. (2015). Progress and latest developments of evacuated tube solar collectors. Renewable and Sustainable Energy Reviews, 51, 1038–1054. https://doi.org/10.1016/j.rser.2015.07.031 |
[7]
. U-pipe systems contain two pipes within each tube one for the inlet and the other for the outlet of the heat transfer fluid allowing efficient heat exchange without internal fluid mixing
. These systems are capable of capturing both direct and diffuse solar radiation without requiring solar tracking.
Heat pipe systems employ a sealed copper pipe containing a volatile working fluid that undergoes phase change during operation. This design provides high thermal efficiency and improved performance in cold or pressurized environments, owing to the vacuum insulation and efficient heat transfer mechanism.
Thermosyphon ETCs operate on the principle of natural convection. As water within the collector tubes heats up, it rises into an insulated storage tank positioned above the collector, while cooler water flows back into the tubes for reheating
| [7] | Sabiha, M. A., Saidur, R., Mekhilef, S., & Mahian, O. (2015). Progress and latest developments of evacuated tube solar collectors. Renewable and Sustainable Energy Reviews, 51, 1038–1054. https://doi.org/10.1016/j.rser.2015.07.031 |
[7]
. These systems are relatively simple, non-pressurized, and well suited to locations where complex plumbing or pumping systems are not available. However, their efficiency is generally lower than that of heat pipe or U-pipe designs, particularly in colder climates.
Batch-type or integrated ETC systems are among the most cost-effective designs, with water stored directly within the collector tubes or in an attached storage tank
. These systems are commonly used in rural or low-income settings and perform best in warm climates, although they may experience significant heat losses during cooler nights.
CPC assisted ETCs incorporate compound parabolic concentrators, which focus additional sunlight onto the absorber tubes. This design significantly enhances collector efficiency, even under diffuse solar radiation or imperfect collector orientation
| [8] | Alarnaout, G. A., Navarro-Esbrí, J., & Mota-Babiloni, A. (2024). Operational, economic, and carbon footprint feasibility of a moderately high-temperature heat pump as an alternative to conventional boilers. Energy Conversion and Management, 309, 118424. https://doi.org/10.1016/j.enconman.2024.118424 |
[8]
. CPC-assisted systems are typically suited for high-demand or industrial applications, although they involve higher costs and more complex installation requirements. Ultimately, the selection of an ETC system depends on several factors, including climatic conditions, budget constraints, operating pressure requirements, and application type. Heat pipe and CPC-assisted systems are particularly suitable for cold or variable climates requiring pressurized operation and high efficiency, while U-pipe systems perform reliably in moderate to warm climates. In contrast, thermosyphon and batch systems are more appropriate for sunny tropical regions where simplicity and affordability are key considerations
| [7] | Sabiha, M. A., Saidur, R., Mekhilef, S., & Mahian, O. (2015). Progress and latest developments of evacuated tube solar collectors. Renewable and Sustainable Energy Reviews, 51, 1038–1054. https://doi.org/10.1016/j.rser.2015.07.031 |
[7]
.
2.2. ETC Solar Water Heater Efficiency
The thermal efficiency of an Evacuated Tube Collector (ETC) is a key performance indicator used to determine how effectively the system converts incident solar radiation into useful thermal energy for water heating. The efficiency depends on several operational and environmental factors, including solar irradiance, ambient temperature, and collector characteristics.
The efficiency of an ETC can be expressed as shown in Equation (
1)
ɳ = Fr(τα) – FrUL(Ti – Ta)/G(1)
where:
η = thermal efficiency of the collector
(τα) = transmittance–absorptance product, representing the fraction of solar radiation transmitted through the glass cover and absorbed by the absorber surface
Ti = inlet fluid temperature
Ta = ambient temperature
G = solar irradiance (W/m2)
UL = overall heat loss coefficient (W/m2·K), representing heat losses from the collector to the environment
Fr = collector heat removal factor, indicating the effectiveness of transferring absorbed heat to the working fluid
| [9] | Gudeta, M. S., Atnaw, S. M., Shibeshi, M., & Gardie, E. (2022). Performance analysis of a solar water heater system with heat pipe evacuated tube collectors. Case Studies in Thermal Engineering, 36, 102211.
https://doi.org/10.1016/j.csite.2022.102211 |
[9]
.
These parameters are essential for accurately evaluating the thermal performance of an ETC system.
The total useful thermal energy collected by the system over a given period can be estimated by multiplying the daily solar radiation (kWh/m2/day) by the collector surface area (m2) and the collector efficiency. This provides an estimate of the actual energy available for water heating.
2.3. Literature Review
Several studies have evaluated the economic and technical performance of solar water heating systems, particularly those based on evacuated tube collectors.
In 2016, the National Renewable Energy Laboratory (NREL) examined the cost-efficiency of ETCs compared to flat-plate collectors across the United States. The study found that ETCs performed better economically in the southwestern states due to higher solar irradiance levels. However, in the northeastern regions where solar resources are limited, the systems were less competitive. These findings highlight the strong influence of geographical and climatic conditions on the economic performance of solar thermal technologies.
Similarly,
| [8] | Alarnaout, G. A., Navarro-Esbrí, J., & Mota-Babiloni, A. (2024). Operational, economic, and carbon footprint feasibility of a moderately high-temperature heat pump as an alternative to conventional boilers. Energy Conversion and Management, 309, 118424. https://doi.org/10.1016/j.enconman.2024.118424 |
[8]
investigated the financial benefits of ETC systems in India. Their results showed that ETC-based water heating systems produced annual savings of approximately 37.5% compared with electric heaters and 36.7% compared with gas heating systems. This suggests that ETCs are particularly advantageous in regions where conventional energy costs are high and solar radiation is abundant.
A study by
examined the economic feasibility of installing solar water heaters in Kenyan households equipped with instant electric showers. Their analysis indicated that a 200-liter solar water heating system could reach a breakeven point in approximately five years, depending on household hot water demand and prevailing electricity tariffs.
Further research conducted by
| [28] | Ertekin, C., Kulcu, R., & Evrendilek, F. (2020). Techno-economic evaluation of solar water heating systems in different climatic regions of Turkey. Renewable Energy, 145, 1290–1300. https://doi.org/10.1016/j.renene.2019.06.094 |
[28]
evaluated the economic performance of solar water heaters across different regions of Turkey. Their findings emphasized that ETC systems are most viable in locations with favorable solar resources and supportive market conditions. The study recommended site-specific analysis to improve the accuracy of financial feasibility assessments.
More recently, a 2023 global review indexed in PubMed Central analyzed strategies for improving the performance of ETC systems. The study highlighted several technological innovations aimed at enhancing collector efficiency. Improved efficiency was indirectly linked to lower operational costs and improved economic feasibility. However, the study primarily focused on technical improvements rather than detailed economic analysis.
Future projections suggest that ongoing advancements in collector materials and the implementation of government incentives may significantly reduce the cost of ETC systems. Preliminary projections indicate that improved system designs and financial support mechanisms could reduce the payback period to approximately 5–7 years in regions with high solar potential.
Despite these advances, a notable gap exists in the literature regarding the influence of water usage patterns and water quality on the economic performance of solar water heating systems. For example, the impact of bathtub usage, as well as chemical water treatment factors such as chlorine content, has rarely been investigated. This gap is particularly relevant for institutional facilities such as the **Multimedia University of Kenya Executive Hostel.
Additionally, several factors including government subsidies, installation and maintenance costs, system lifespan, and optimal installation configurations significantly influence the economic viability of ETC systems. There is therefore a need to develop localized financial evaluation models that institutions in Kenya can use to accurately estimate breakeven periods for solar water heating installations.
Furthermore, existing literature provides limited guidance on the optimal installation configuration required to maximize the return on investment for ETC systems. This study aims to address this gap by evaluating different installation configurations and determining the most economically viable option.
3. Methodology
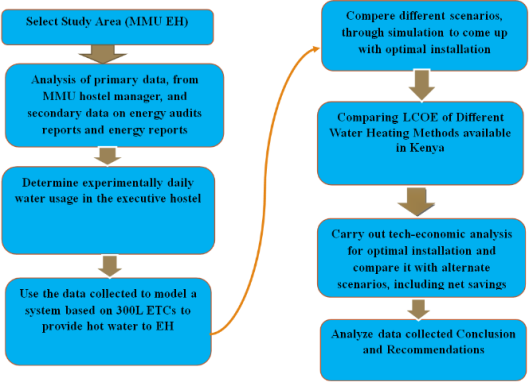
Figure 1 illustrates the procedures used to evaluate the feasibility and performance of the proposed solar water heating system.
Figure 1. System Evaluation Flow Chart.
3.1. Study Area
The study was conducted at the Multimedia University of Kenya Executive Hostels located within the university’s main campus in Nairobi, Kenya. The campus is situated along Magadi Road approximately 25 km southwest of Nairobi’s city center, at coordinates 1°22′53″S, 36°46′3″E. The Executive Hostel complex consists of two buildings—Nyati Hostel and Twiga Hostel with a combined accommodation capacity of 328 occupants, excluding staff.
3.2. Determining Running Costs of Immersion Heaters
Electricity consumption associated with the existing water heating system was determined using the rated power consumption of immersion heaters installed in the executive hostels. The original solar water heating system had previously been abandoned due to high operational costs. The cost of operating and maintaining the current electric water heating system was estimated using operational data obtained from the MMU estate management office.
3.3. Determination of Daily Energy Demand
Daily energy demand for hot water was determined experimentally using two complementary approaches. The first approach involved distributing a Google Form questionnaire to hostel occupants in order to collect information about water usage habits.
The second approach involved direct measurement of hot water consumption by a sample group of occupants over a seven day monitoring period.
The required sample size was determined using Cochran’s sample size formula (with finite population correction).
Hot water usage per shower and bath was monitored using energy meters installed in selected rooms. Additionally, water consumption associated with bathtub use was measured for 20 randomly selected occupants over one week. Participants who were unavailable during the study period were replaced with other randomly selected occupants.
The total thermal energy demand was calculated using equation (
2) below.
where
Q = total thermal energy required
m = mass of water heated
c = specific heat capacity of water (4.186 J/g°C)
ΔT = temperature difference between inlet and outlet water
The mass of water was estimated assuming a water density of 1000 kg/m³, consistent with typical water supplied to the MMU hostels.
Carbon emissions associated with the existing electric water heating system were estimated using the grid emission factor provided by the Energy and Petroleum Regulatory Authority (EPRA).
The grid emission factor used in the study was obtained using Equation (
3).
Grid emission factor = 0.04927 tCO2/MWh(3)
3.4. Modeling
After determining the daily hot water demand, a solar water heating system based on 300-liter evacuated tube collectors was designed and simulated using RETScreen Expert software. The system configuration included 300 liter ETC collectors with storage tanks, a control system, a backup electric heating system. The required number of collectors was determined through simulation based on daily hot water demand, solar radiation data for the location and collector thermal efficiency.
The model required input parameters including Fr(τα) and FrUL coefficients. These parameters were obtained from the technical manual of ETC systems manufactured by **Philips Kenya. These collectors were selected because they had already been procured by MMU for installation in the Executive Hostels and represent some of the most modern ETC technologies available in the Kenyan market.
3.5. Economic Evaluation
3.5.1. Economic Analysis Equations
Several financial indicators were used to evaluate the economic feasibility of the proposed system, including Net Present Value (NPV), Internal Rate of Return (IRR), Profitability Index (PI), Levelized Cost of Energy (LCOE), Annual Cash Inflows (ACI) and Discounted Payback Period.
Future annual cash inflows were calculated as the difference between annual costs and savings resulting from reduced electricity consumption. The present value of future cash flows was determined by discounting future income streams using the discount rate provided by the Central Bank of Kenya. Net Present Value (NPV) was then calculated to determine whether the investment would generate a positive return over its economic lifetime. The Internal Rate of Return (IRR) represents the discount rate at which the NPV equals zero, indicating the expected annual rate of return on the investment. The Profitability Index (PI) was calculated as the ratio between the NPV and the initial investment cost. A PI greater than 1 indicates a financially viable investment. The payback period both static and discounted was also calculated to estimate the time required for the system to recover its initial investment cost
| [10] | Obileke, K., & Mukumba, P. (2025). Techno-economic evaluation of wind and bio-energy systems for sustainable development: A systematic review. Energy Science & Engineering. Advance online publication. https://doi.org/10.1002/ese3 |
[10]
.
3.5.2. Comparing Different Water Heating Methods
The study compared five water heating technologies that included electric heaters, heat pumps, LPG gas systems, firewood heating systems and evacuated tube collector systems. The comparison was based on their economic performance over a seven-year analysis period in Nairobi. Key parameters considered included: capital cost, maintenance costs, fuel prices and system efficiencies
| [11] | Energy and Petroleum Regulatory Authority. (2025a). Bi-annual energy and petroleum statistics report: July–December 2024. Government of Kenya. |
[11]
.
A constant annual heat demand of 142,019 kWh and a discount rate of 10.75% were assumed. For each technology, total lifecycle costs were calculated using discounted cash flow analysis, and the Levelized Cost of Energy (LCOE) was determined. The system with the lowest LCOE was considered the most cost-effective option
| [12] | Sayed, K., Khamies, M., Abokhalil, A. G., Aref, M., Mossa, M. A., Almalki, M. M., & Alghamdi, T. A. (2024). Feasibility study and economic analysis of PV/wind-powered hydrogen production plant. IEEE Access, 12, 1–15.
https://doi.org/10.1109/ACCESS.2024 |
[12]
.
Simulation results indicated that the optimal installation configuration for fixed ETC collectors provided a solar fraction of 64.8%. However, alternative configurations showed potential performance improvements, including single-axis tracking collectors, dual-axis tracking collectors, insulated piping systems and collector systems without integrated storage. Economic analysis tools were used to evaluate whether these alternatives would provide better financial returns
| [13] | Singh, S. (2024). Technical and financial feasibility study of solar water heating systems (Doctoral dissertation, Rajiv Gandhi Institute of Petroleum Technology). |
[13]
.
Net savings were calculated by comparing the total discounted cost of operating each solar water heating system with the baseline cost of continuing to use grid electricity. First, the discounted cost of backup electricity required during the project lifetime was calculated for each system.
Second, the NPV of the solar water heating system was treated as the financial benefit generated by installing the system.
Finally, the net savings were obtained by subtracting the total adjusted system cost from the baseline electricity cost. This value represents the actual financial benefit achieved by installing the ETC-based solar water heating system.
4. Results and Discussion
4.1. Current Cost of Electricity
4.1.1. Immersion Heaters
The Executive Hostels (EH) consist of ten hot water storage tanks, each with a capacity of 3000 L, distributed across the two hostels: Nyati and Twiga. Each storage tank is fitted with four 3 kW immersion heaters, which operate for approximately 4 hours per day.
The immersion heaters operate as purely resistive loads, meaning they do not significantly influence the power factor of the electrical system. The daily electricity consumption was calculated using the heater power rating, the number of heaters, and their daily operating time.
The daily electricity consumption was calculated using the heater power rating, the number of heaters, and their daily operating time as follows:
Watts per heater x number of heaters x hours it operates per day
Or
14,400 Kwh per month or 172,800 Kwh per year
Using the current electricity tariff of USD 0.16 per kWh, the total electricity cost is estimated as:
14,400 kWh x 0.16 = $2304 Per month or $27,648 per year
Monthly cost:
14,400×0.16=2304 USD
Annual cost:
USD $27,648
These results demonstrate that electric immersion heating results in significant operational expenditure for the institution.
4.1.2. Maintenance Cost
The 3 kW immersion heaters are replaced on average every three months due to the high chlorine levels in the water. Each heater costs approximately $27.09.
With a total of 40 heaters replaced every three months, the maintenance cost amounts to approximately $1,083.59 per quarter, or $4,334.37 annually. This estimate excludes labor costs, as the replacements are carried out by university staff who are already employed in other departments.
Therefore, the total annual cost of using immersion heaters is:
$27,648+ $4,334.37 = $31982.37
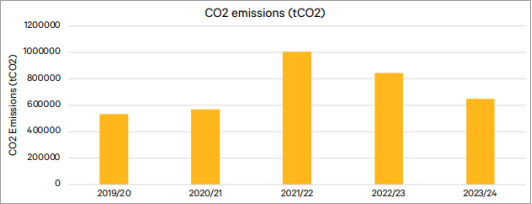
4.1.3. Carbon Dioxide Produced by Current Installation
The most recent data from EPRA was used to estimate the carbon dioxide (CO
2) emissions associated with the use of immersion heaters.
Figure 2 below illustrates the trend of CO
2 emissions from Kenya’s electricity grid from 2019 to December 2024.
From the graph, the grid emission factor is 0.04927 tCO2/MWh (EPRA, 2025a). Using this factor, the CO2 emissions were calculated as follows:
The total annual energy consumption is 175,200 kWh. Therefore, the estimated CO2 emissions are: = 8,628.7 kg CO2 per year.
4.2. Daily Hot Water Energy Demands in the Hostels
Using Cochran’s sample size formula (with finite population correction), the sample size was determined to be 40, assuming a confidence level of 90%, a margin of error of 5%, and a total population of 328.
The occupants of the executive hostels were found to use three main electric water heating methods. The majority (60%) used 200L bathtubs. About 10% of the occupants used instant water heating showerheads, while the remaining 30% relied on buckets and water basins.
Some occupants reported using a combination of methods alternating between showerheads, buckets, and bathtubs. However, for consistency and to minimize ambiguity in the analysis, such respondents were categorized according to the method they used most frequently.
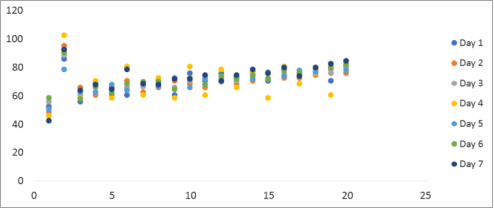
4.2.1. Water Usage Using Bathtubs
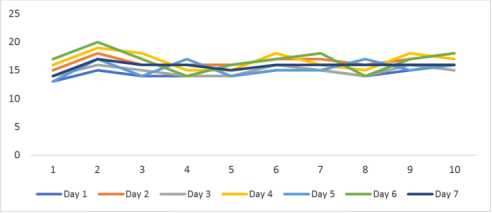
The collected data were analyzed and presented graphically to visualize the bathing patterns of occupants.
Figure 3 below illustrates the bathing patterns of occupants who use bathtubs.
Figure 3. Bathing patterns of occupants using bathtubs.Bathing patterns of occupants using bathtubs.
The results indicate that water usage for occupants using bathtubs ranged between 40 liters and 105 liters per use. Most occupants exhibited relatively consistent water usage patterns, typically varying within ±20 liters. The average water consumption among users of the 200 L bathtubs was found to be 70.10 liters.
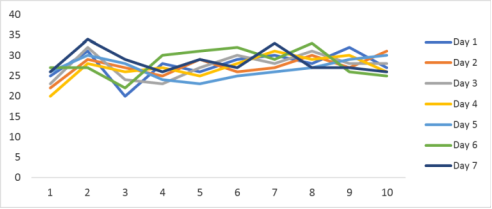
4.2.2. Water Usage Using Shower Heads
For showerheads, the average flow rate was approximately 5 liters per minute. Water usage was primarily determined by the duration for which the water was allowed to flow during showering.
To ensure privacy, water usage for showerhead users was measured using a water meter, similar to the approach used for bathtub users. Since only 10% of the occupants used showerheads, a sample of 10 occupants was considered for this category.
The
Figure 4 below presents a visualization of the showering patterns, as summarized in the table above.
Figure 4. Showering water usage patterns at MMU EH.Showering water usage patterns at MMU EH.
From the graph, the minimum amount of water used was 20 liters, while the maximum was approximately 34 liters. Unlike bathtub users, the bathing patterns of occupants using showerheads were highly variable. This variation can be attributed to the absence of a standardized measuring system (such as a bucket or bathtub), leading to inconsistent water usage.
The average water consumption for occupants using showerheads was estimated at 27.5 liters per person per bath.
4.2.3. Water Usage Using Buckets
For occupants using buckets, a sample of 10 students was selected. Within this group, some used basins while others used buckets. Typically, water was heated using electric kettles or water jugs and then transferred into the bucket or basin for bathing.
This method was used by approximately 30% of the occupants.
Figure 5 below was used to analyze and visualize the data presented in the table above.
Figure 5. Water usage patterns for occupants using buckets.
From the data, it was observed that occupants using buckets exhibited relatively consistent water usage patterns, with values ranging between 10 and 24 liters. The average water demand for this category was 15.2 liters per person per bath.
Considering all three categories of users bathtub users, showerhead users, and bucket users the overall average water consumption per occupant was determined to be 49.1 liters per bath. The next step involved determining the average number of baths taken per week. This information was collected by use of a Google Form survey, which received responses from 120 occupants.
Figure 6 below presents the distribution of responses regarding the number of baths taken per week.
Figure 6. Number of Baths per Week per Occupant at MMU EH.
From the data collected, the average number of baths per occupant per week was determined to be 6.725.
The highest inlet water temperature was recorded at 2:00 p.m. and was 22°C, while the lowest was observed in the morning at 14.8°C. The average inlet water temperature at MMU was therefore calculated to be 17.79°C.
The total hot water demand at a target temperature of 40°C was computed as follows:
(49.1𝑥328𝑥6.75)/7 = 15,529.6 liters per day
The corresponding energy demand was then calculated using the relation Q = mcΔT.
Q=4186J/kg°C×15,529.6×22.21=1,441,736,551J
This is equivalent to:
400.48 kWh per day, or146,175.2 kWh per year
4.3. Modeling Results
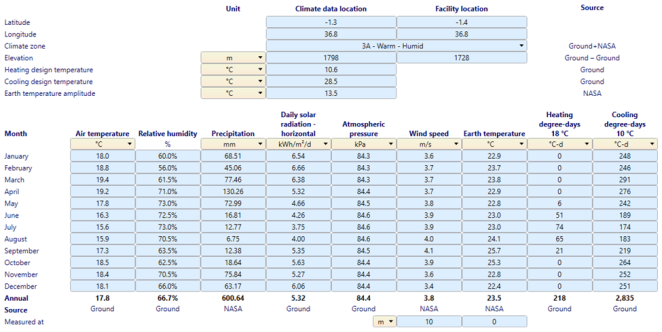
4.3.1. Climate Data
The climate data were obtained from NASA through the RETScreen Expert software.
Figure 7 below presents the key climate parameters for MMU.
It was established that MMU falls within a warm-humid climate zone. The average annual solar radiation is approximately 5.32 kWh/m2/day. The month of February experiences the highest solar radiation at about 6.6 kWh/m2/day, while July records the lowest at 3.75 kWh/m2/day.
As a result, during the month of July, backup systems supply up to 74% of the total energy demand. In contrast, during months such as February, the entire energy demand is met by evacuated tube collectors (ETCs).
Figure 7. Climatica lConditions at MMU EH.
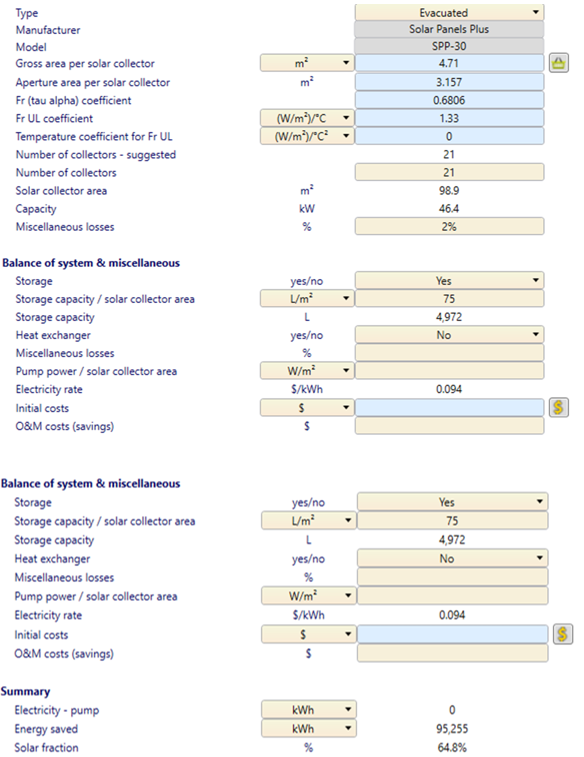
4.3.2. ETC Parameters
To ensure accurate simulation, the collector size and efficiency were first determined. The ETC used in this study was a 300 L pressurized collector manufactured by Philips.
From the user manual Fr (tau alpha) coefficient was 0.68 while Fr UL coefficient was 1.33. The collector has a storage capacity of 300 L, corresponding to 75 L/m2 of storage. It has a gross area of 4.71 m2 and an aperture area of 3.157 m2. Based on software recommendations, miscellaneous losses were assumed to be 2%.
Figure 8 below presents the simulation recommendations after inputting the above parameters.
Figure 8. RETScreen Recommendations for the Designed SWH System at EH.
From the data, the recommended solar fraction was 64.8%, corresponding to a system configuration of 21 evacuated tube collectors (ETCs).
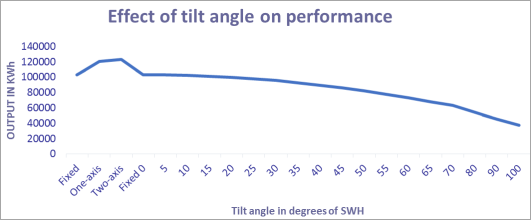
4.3.3. Impact of Tilt Angle
To optimize the performance of the collectors, the tilt angle was varied from 0° to 100°. In addition, the effect of solar tracking was evaluated by considering both single-axis and dual-axis tracking systems.
Figure 9 below illustrates how the energy output of the 21 ETCs varies with changes in the tilt angle.
Figure 9. Effect of tilt angle on the performance of evacuated tube collectors (ETCs).
From the graph, the highest energy output was achieved using dual-axis tracking, followed by single-axis tracking, and then a fixed tilt at 0°. However, the model recommended an optimal tilt angle of 15°.
This recommendation aligns with the collector frame provided by the manufacturer. According to
| [15] | Aggarwal, S., Kumar, R., Lee, D., Kumar, S., & Singh, T. (2023). A comprehensive review of techniques for increasing the efficiency of evacuated tube solar collectors. Heliyon, 9(4), e15215. https://doi.org/10.1016/j.heliyon.2023.e15215 |
[15]
, although a 0° tilt angle at the equator can yield maximum solar radiation, other practical factors must be considered when determining the optimal tilt angle
| [14] | Dabra, V., Yadav, L., & Yadav, A. (2013). Effect of tilt angle on the performance of evacuated tube solar collectors. International Journal of Engineering, Science and Technology, 5(4), 100–110. https://doi.org/10.4314/ijest.v5i4.11 |
[14]
. A slightly higher tilt angle, such as the recommended 15°, is advantageous as it allows for self-cleaning of the collectors during rainy seasons. Additionally, it provides a more stable and robust support structure, enhancing the system’s resistance to wind and other physical stresses.
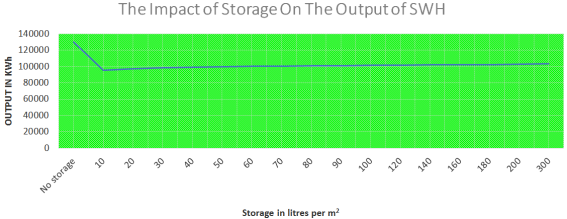
4.3.4. Storage
To determine the optimal hot water storage capacity for the system, the effect of varying storage capacities (expressed in liters per square meter) on collector output was simulated.
Figure 10 below illustrates how different storage capacities influence the performance of the collectors.
Figure 10. Effect of Tilt Angle on the Performance of ETCs.
The system without storage exhibited the highest energy output compared to systems with storage. This is due to the elimination of losses associated with storage
| [16] | Sadeghi, G., Pisello, A. L., Safarzadeh, H., Poorhossein, M., & Jowzi, M. (2020). Effect of storage tank type on the performance of evacuated tube solar collectors. Energy, 198, 117331. https://doi.org/10.1016/j.energy.2020.117331 |
[16]
. Moreover, the absence of storage prevents increases in system temperature, which can inversely affect ETC efficiency
| [17] | Sasikumar, S. B., Santhanam, H., Noor, M. M., Devasenan, M., & Ali, H. M. (2025). Experimental investigation of parallel-type evacuated tube solar collectors using nanofluids. Energy Sources, Part A: Recovery, Utilization, and Environmental Effects, 47(1), 1341–1353.
https://doi.org/10.1080/15567036.2023 |
[17]
.
Smaller storage systems showed very low output due to overheating, which increases system losses. As storage capacity increased, output also increased gradually and proportionally. Although larger storage systems, such as 300 L/m
2, achieved very high output, the simulation recommended a storage capacity of 75 L/m
2. Larger storage tanks would increase costs, occupy more space, and the water stored might not reach the optimal temperature for bathing
| [17] | Sasikumar, S. B., Santhanam, H., Noor, M. M., Devasenan, M., & Ali, H. M. (2025). Experimental investigation of parallel-type evacuated tube solar collectors using nanofluids. Energy Sources, Part A: Recovery, Utilization, and Environmental Effects, 47(1), 1341–1353.
https://doi.org/10.1080/15567036.2023 |
[17]
.
Therefore, the simulation optimized both cost and system reliability, resulting in the recommended 75 L/m2, which aligns with the manufacturer’s specifications.
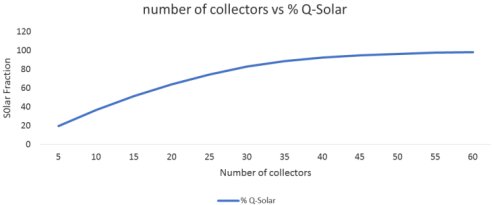
4.3.5. Impact of Number of Collectors on Solar Fraction
It was expected that increasing the number of collectors would lead to a corresponding increase in solar fraction. However, the data in
Figure 11 show variations from this expectation.
Figure 11 illustrates how changes in the number of collectors affect the solar fraction of the system.
Figure 11. How Number of Collectors Affect the Solar Fraction.
The solar fraction graph begins to plateau at around 30 collectors, representing approximately 82.7%. Beyond this point, increasing the number of collectors does not produce a proportional increase in solar fraction.
However, the simulation recommended 21 collectors, corresponding to a solar fraction of 64.8%. This recommendation takes into account several factors
1. Seasonal Variations: Complete reliance on solar energy is difficult due to seasonal fluctuations. Oversizing the system to meet energy demand during the cold season would result in wasted excess energy during the hot season
| [17] | Sasikumar, S. B., Santhanam, H., Noor, M. M., Devasenan, M., & Ali, H. M. (2025). Experimental investigation of parallel-type evacuated tube solar collectors using nanofluids. Energy Sources, Part A: Recovery, Utilization, and Environmental Effects, 47(1), 1341–1353.
https://doi.org/10.1080/15567036.2023 |
[17]
.
2. Storage Limitations: Excess heat generated during sunny periods cannot always be stored for later use. Increasing storage capacity for every collector would raise both costs and space requirements. Therefore, the simulation optimized storage to meet only the daily energy demand
| [18] | Mugabi, J., Aigbavboa, C. O., & Thwala, W. D. (2018). Economic feasibility of solar water heating systems in Kenya: Cost–benefit analysis. International Journal of Built Environment and Asset Management, 2(1), 1–14. |
[18]
.
3. Economic Optimization: The recommendation of 21 collectors balances the initial and maintenance costs with the cost of backup power. Attempting to achieve a 100% solar fraction would significantly increase costs, potentially making the project economically unfeasible.
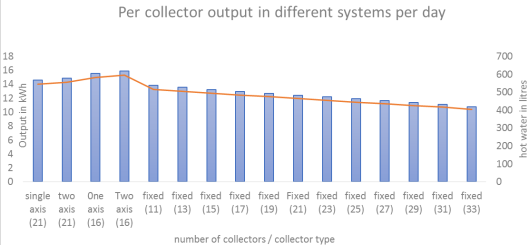
4.3.6. Average Output per Collector
ETCs can be connected in either series or parallel configurations. For series connections, it was observed that increasing the number of collectors reduces the output per collector. This occurs because higher temperatures in downstream collectors decrease their efficiency, resulting in lower performance for collectors positioned later in the series
| [18] | Mugabi, J., Aigbavboa, C. O., & Thwala, W. D. (2018). Economic feasibility of solar water heating systems in Kenya: Cost–benefit analysis. International Journal of Built Environment and Asset Management, 2(1), 1–14. |
[18]
.
While this effect is less pronounced in parallel connections, it is not entirely eliminated.
Figure 12 below illustrates how increasing the number of collectors connected in parallel affects the output of each collector, both in terms of kWh and liters of hot water produced per day.
Figure 12. Output per Collector as Number of Collectors Increases.
From the graph, increasing the number of installed collectors reduces the output per collector, even in parallel connections. Several factors contribute to this effect:
1. Increased Pipe Heat Losses: As the number of collectors increases, more piping is required to interconnect them, leading to greater heat losses through the pipes.
2. Higher System Operating Temperatures: Increasing the number of collectors slightly raises the overall system temperature. Higher system temperatures reduce collector efficiency
| [19] | Theis, S., Herrmann, C., & Aichele, T. (2017). Economic analysis of evacuated tube and flat plate solar collectors for domestic hot water production. Energy and Buildings, 150, 71–80.
https://doi.org/10.1016/j.enbuild.2017.05.080 |
[19]
.
3. Heat Wastage on Peak Solar Days: During periods of high solar radiation, many collectors generate maximum power, but some energy is wasted due to limited storage capacity. In systems with fewer collectors, this wastage is minimized because the generated heat is insufficient to exceed daily energy demand
.
4. Diminishing Returns: According to the economic principle of diminishing returns, when an input is increased against a fixed input, there comes a point where additional units produce a smaller impact. In this case, adding more collectors leads to progressively smaller gains in solar energy output
| [21] | Zhang, W., Duan, L., Wang, J., Ba, X., Zhang, Z., & Tian, R. (2022). Influences of tracking and installation errors on the optical performance of a parabolic trough collector with heat pipe evacuated tubes. Sustainable Energy Technologies and Assessments, 50, 101721. https://doi.org/10.1016/j.seta.2021.101721 |
[21]
.
4.4. Comparison of Different Installations
Cost estimates for different system configurations were determined based on current Kenyan market prices.
Table 1 below presents the estimated costs of purchasing ETCs along with their respective tracking systems and the total initial investment required.
Table 1. Cost of Purchase and Installing ETC.
Item | Unit Price (KES) | Quantity | Total Cost (KES) |
Evacuated tube collector | 168,000 | 21 | 3,528,000 |
Fixed ETC installation | 15,000 | 21 | 315,000 |
Single-axis installation | 141,599 | 16 | 2,265,584 |
Double-axis installation | 270,199 | 16 | 4,323,184 |
From
Table 1, it is clear that the initial cost of the system varies significantly depending on the type of collector installation. While the evacuated tube collectors themselves account for a major portion of the investment, adding tracking systems especially double-axis tracking substantially increases the total cost.
This highlights the importance of balancing collector performance with economic feasibility, as higher-cost installations may provide greater energy output but could reduce the overall cost effectiveness of the system
| [21] | Zhang, W., Duan, L., Wang, J., Ba, X., Zhang, Z., & Tian, R. (2022). Influences of tracking and installation errors on the optical performance of a parabolic trough collector with heat pipe evacuated tubes. Sustainable Energy Technologies and Assessments, 50, 101721. https://doi.org/10.1016/j.seta.2021.101721 |
[21]
.
Other key values used in the economic analysis were obtained from official government sources.
Table 2 below summarizes these values.
Table 2. Key Economic Analysis Values.
Parameter | Value |
Discounting rate | 10.75% |
Cost of electricity (SC1) | KES 20.15 |
Pipe insulation cost | KES 500/m |
Treasury bond rate | 13.48% |
Inflation rate | 4.11% |
The values presented in
Tables 1 and 2 were used to calculate future income, the Net Present Value (NPV), the Internal Rate of Return (IRR), Profitability Index (PI), and static and dynamic amortization periods. The results are presented in the following graphs, which are aimed at identifying the optimal system configuration.
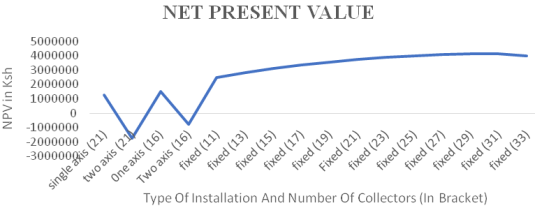
4.4.1. Net Present Value (NPV)
Simulation data were used to determine the outputs for different levels and types of ETC systems. These outputs, combined with economic analysis tools were used to generate the graphs below.
Figure 13 shows the Net Present Value for different ETC installation levels and configurations.
Figure 13. NPV of Different Levels & Types of ETC Installations.
From
Figure 13, fixed ETC installations demonstrate significantly higher Net Present Values (NPVs), which increase with the number of collectors. The optimal NPV occurs at approximately 29 collectors, after which returns slightly decline, likely due to system saturation or diminishing marginal returns)
| [22] | Njeru, E. M., Musonye, F. S., & Wekesa, D. (n.d.). Modeling, simulation and techno-economic analysis of electrical steam boilers in manufacturing industries in Kenya. SSRN Electronic Journal. https://doi.org/10.2139/ssrn |
[22]
. Tracking systems, particularly two-axis trackers, exhibit low or even negative NPV, mainly due to their high capital and maintenance costs
| [23] | Etcheverry, J. (2021). Assessing the cost feasibility of solar projects in Canada using RETScreen Expert software. (Report). |
[23]
.
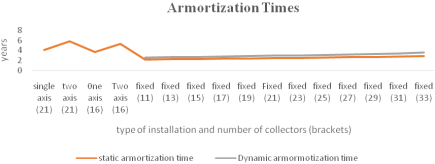
4.4.2. Amortization Time
Both static and dynamic amortization times were calculated for the same set of ETC configurations to indicate how long it would take to recover the initial investment.
Figure 14 shows that fixed systems outperform tracking systems, offering the shortest payback periods. Two-axis tracking systems are the least favorable, requiring longer to recover the investment and yielding poor NPV. Static amortization times are consistently lower than dynamic times, which account for the time value of money and cash flow delays.
Figure 14. Amortization Time.
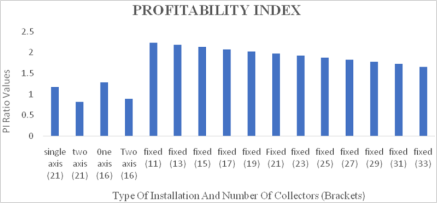
4.4.3. Profitability Index (PI)
The Profitability Index (PI) measures the ratio of benefits to costs, indicating the financial attractiveness of a project. A higher PI indicates a more favorable return per unit of investment.
Figure 15 shows that the configuration with 11 fixed collectors achieves the highest PI, reflecting optimal returns at smaller system scales
| [24] | Tao, J. Y., & Finenko, A. (2016). Moving beyond LCOE: Impact of various financing methods on PV profitability for small island developing states. Energy Policy, 98, 749–758.
https://doi.org/10.1016/j.enpol.2016.09.011 |
[24]
. This trend aligns with the shortest amortization times observed in
Figure 14, confirming faster investment recovery.
Figure 15. Profitability Index.
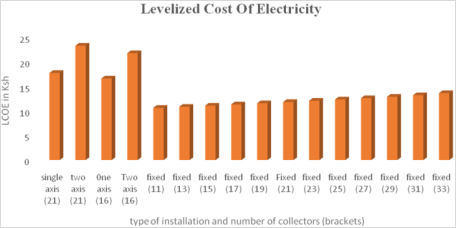
4.4.4. Levelized Cost of Energy (LCOE)
The LCOE compares the average cost of energy over a system’s lifetime, indicating cost effectiveness.
Figure 16 shows that the 11 fixed ETC configuration achieves one of the lowest LCOE values, reinforcing its economic viability at smaller scales.
Figure 16. LCOE of different ETC configurations.
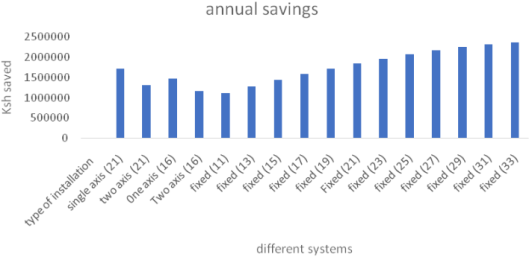
Figure17 illustrates the net savings from different ETC installations at MMU. Annual savings increase with the number of collectors, reaching a maximum at the 31-collector configuration. However, this contrasts with RETScreen Expert’s recommendation of 21 collectors (approximately 64% solar fraction), which considers holistic economic factors such as capital cost, system utilization efficiency, and seasonal variability rather than annual savings alone.
Figure 17. Net Savings of Different ETC Installations at MMU.
4.5. Economic Analysis of Optimal Installation
From
Figures 14-16, systems with fewer fixed collectors particularly the 11 collector configuration demonstrate superior economic performance, including the highest PI, lowest LCOE, and shortest amortization time. While higher solar fractions theoretically reduce backup energy requirements, increasing collector numbers does not linearly improve economic returns, illustrating diminishing returns and potential oversizing
| [26] | Singh, H., Yadav, A., & Singh, R. (2017). Economic analysis of solar water heating systems for residential applications in India. Renewable and Sustainable Energy Reviews, 79, 1011–1020. https://doi.org/10.1016/j.rser.2017.05.126 |
[26]
.
A balanced analysis across amortization time, NPV, and LCOE indicates that a system with 21 fixed collectors (≈64% solar fraction) provides the most practical and economically optimal performance under the studied conditions.
Table 3 presents the detailed economic analysis for this configuration.
Table 3. Results of Economic Analysis.
Time (Years) | 0 | 1 | 2 | 3 | 4 | 5 | 6 | 7 |
ETC Purchase | -3,528,000 | | | | | | | |
Installation Cost | 315,000 | | | | | | | |
Maintenance Cost | | 315,000 | 315,000 | 315,000 | 315,000 | 315,000 | 315,000 | 315,000 |
Fin | -3,864,000 | 1,604,388 | 1,604,388 | 1,604,388 | 1,604,388 | 1,604,388 | 1,604,388 | 1,604,388 |
PV Factor | 1 | 0.903 | 0.815 | 0.736 | 0.665 | 0.600 | 0.542 | 0.489 |
PV | | 1,448,762 | 1,307,576 | 1,180,830 | 1,066,918 | 962,632 | 869,578 | 784,546 |
Payback Period (Static) | -3,864,000 | -2,259,612 | -655,224 | 949,164 | 2,553,552 | 4,157,940 | 5,762,328 | 7,366,716 |
Payback Period (Dynamic) | -3,864,000 | -2,415,238 | -1,107,662 | 73,168 | 1,140,086 | 2,102,718 | 2,972,296 | 3,756,842 |
Nominal Discount Rate | | | | 10.75% | | | | |
NPV | | | | 3,757,647.3 | | | | |
IRR | | | | 24% | | | | |
Amortization Time (Static) | | | | 2.4 | | | | |
Amortization Time (Dynamic) | | | | 2.9 | | | | |
Profitability Index | | | | 1.97 | | | | |
1. The NPV of KES 3,757,647.3 (≈$29,083.96) is well above zero, indicating a profitable project within its economic lifetime.
2. The PI of 1.97 (>1) confirms the project’s financial viability in Kenya.
3. The IRR of 24% exceeds the discount rate of 10.75%, demonstrating strong expected annual returns
.
4. Static and dynamic amortization times are 2.4 and 2.9 years, respectively, much shorter than the system’s lifetime, indicating rapid investment recovery.
4.6. Techno-Economic Analysis: Comparison with Other Water Heating Methods
To compare different water heating methods, current data from Kenya were applied.
Table 4 summarizes the fuel rates and efficiencies of alternative systems
| [24] | Tao, J. Y., & Finenko, A. (2016). Moving beyond LCOE: Impact of various financing methods on PV profitability for small island developing states. Energy Policy, 98, 749–758.
https://doi.org/10.1016/j.enpol.2016.09.011 |
[24]
.
Table 4. Fuel Rates and Key Parameters for Water Heating Methods.
Heat Source | Size | Rate | Cost per Rate | Capacity Factor | Key Values | Efficiency (%) |
LPG | 80 kW | 12.7 kWh/kg | 256/kg | 0.6 | – | 92 |
Biomass | 60 kW | 3.2 kWh/kg | 20/kg | 0.8 | – | 85 |
Heat Pump | 4–6 kW | 20.15 kWh | 20.15 | 0.8 | SCOP 3.5 | 350 |
Electricity | 80 kW | 20.15 kWh | 20.15 | 0.6 | – | 96 |
From these rates, running costs were estimated, and as shown in
Table 5 presents LCOE calculations over 7 and 15 year periods, including installation and maintenance costs
| [25] | Lekombo, C. S., N’Tsoukpoe, K. E., Bahamonde, C. F., Dudita, M., Ko, G. K., & Agbokou, K. S. (2024). In situ performance evaluation of a solar water heating system for a hospital laundry in the Sahel. Energy for Sustainable Development, 81, 101499. https://doi.org/10.1016/j.esd.2024.101499 |
[25]
.
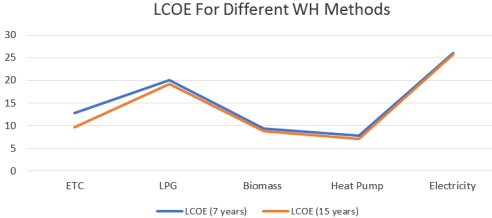
Table 5. Inputs for calculating LCOE for different WH methods in Kenya.
Heat Source | Initial Investment (KES) | Maintenance Cost/Year | Operating/Fuel Cost/Year | Energy Generated/Year | LCOE (7 yrs) | LCOE (15 yrs) |
ETC | 5,544,000 | 495,000 | 0 | 129,860 | 12.80 | 9.67 |
LPG | 1,800,000 | 50,000 | 2,516,600 | 147,019 | 20.03 | 19.14 |
Biomass | 1,400,000 | 28,000 | 1,080,000 | 148,920 | 9.42 | 8.73 |
Heat Pump | 1,560,000 | 124,800 | 846,401 | 168,192 | 7.73 | 7.05 |
Electricity | 700,000 | 560,000 | 3,118,742 | 147,019 | 26.02 | 25.68 |
Figure 18. LCOE for water heating systems.
From
Figure 18, heat pumps exhibit the lowest Levelized Cost of Energy (LCOE) over both 7- and 15-year periods, indicating high energy efficiency and low operating costs despite relatively high initial capital investment. This is attributed to their ability to produce approximately 3–4 kWh of heat for every 1 kWh of electricity consumed.
Biomass emerges as the second most cost-effective option in Kenya, consistent with its widespread use, particularly among rural households. However, its application is associated with significant environmental concerns, such as deforestation and emissions, as well as health risks arising from indoor air pollution.
Evacuated Tube Collectors (ETCs) require high upfront investment but demonstrate a substantial reduction in LCOE over a 15-year lifespan, highlighting strong long-term viability. Their advantages include zero fuel costs and relatively low maintenance requirements. Nevertheless, the high initial cost may limit their adoption among low-income households and financially constrained institutions. In contrast, LPG and electric water heating systems exhibit the highest LCOE values across both time horizons, primarily due to their high operating costs.