Research Article | | Peer-Reviewed

Characterization and Mapping of Soil Salinity Status at Small-Scale Irrigation Farm: The Case of Fantale Irrigation Project Sites

Received: 27 March 2024    Accepted: 16 April 2024    Published: 24 May 2024
Views:       Downloads:
Abstract

Agricultural production and productivity can be adversely affected by the presence of excessive salts in soils particularly in semi-arid and arid areas. Knowledge of the salinity/sodicity of the soil and the quality of the irrigation water is essential for managing agricultural fields effectively and increasing the output and productivity of the lands. This research was initiated with the objectives of characterizing and Mapping of soil salinity status at small scale irrigated areas of Fantale district and identifying the most affected irrigation scheme so as to design appropriate soil salinity management. The study was conducted at Fentale district of Galcha, Gola and Dire Sade irrigation schemes. Soil samples were collected from the surface using augur, and from pits at different depth interval and analyzed for pH, EC, Na+, ESP, SAR, Ca2+, Mg2+, K+, and CEC. The result was compared with the standards set by FAO system to classify soil and water salinity. Accordingly, it was identified that Galcha irrigation scheme was characterized as sodic due to very strong sodium concentration with average ESP of 53.2% and EC 3.95 mmhoms/cm and pH about 9.25. On the other hand, Gola and Dire Sade Irrigation schemes were characterized as moderately and slightly sodic respectively. Sodium was the dominant soluble cation, followed by calcium, magnesium, and potassium in all soil depths and schemes. Beside primary Salinization of natural processes such as physical or chemical weathering parent material, and discharge Basaka Lake to the downstream, was the main source of salt build-up in the upper layers of the soil at Galcha irrigation scheme. On the other hand, irrigation water analysis indicated that water used for irrigation at all irrigation schemes were slightly sodic. Therefore, the study underscores the need for a scientific reclamation of sodic soils primarily at Galcha Irrigation scheme where sodium concentration in the soil was very strong.

Published in International Journal of Science, Technology and Society (Volume 12, Issue 3)
DOI 10.11648/j.ijsts.20241203.12
Page(s) 108-119
Creative Commons

This is an Open Access article, distributed under the terms of the Creative Commons Attribution 4.0 International License (http://creativecommons.org/licenses/by/4.0/), which permits unrestricted use, distribution and reproduction in any medium or format, provided the original work is properly cited.

Copyright

Copyright © The Author(s), 2024. Published by Science Publishing Group

Keywords

Salinity, Sodicity, Irrigation, Mapping, Classification

1. Introduction
Salinization of land and water resources is a major landscape degradation issue worldwide, with serious salt related problems occurring in at least 75 countries . High concentration of salts in the root zone limits the productivity of nearly 953 million hectares (ha) of productive land in the World. Australia, followed by Asia, and Africa have the largest area under salinity and sodicity problems. According to the recent reports, the area of salt affected land coverage is estimated to be more than 60% in Australia which has continued to expand . In Africa also, it covers about 81 million ha of the dry land areas. Generally, in the irrigated areas, human-induced salinity and sodicity related land degradation is becoming a serious challenge for food and nutritional security in the developing world .
Ethiopia is the first in Africa and the ninth country in the World having more than 11 million ha of salt affected soils. Soil salinity and alkalinity problems are commonly found in the arid and semiarid regions of the earth due to insufficient annual rainfall to leach accumulated salts from the root zone. Moreover, heavy fertilizer application and use of poor quality irrigation water and inadequate drainage have contributed to the development of salt affected soils and productivity deterioration of many soils in irrigated arid and semi-arid regions . Following the establishment of large scale irrigated farms in Ethiopia, the problem become worse due to poor drainage system and inappropriate water management practices coupled with unsound reclamation procedures . The study indicated that the greatest concentration of water bodies in Ethiopia is located in the Rift Valley. Thus, there is a tendency to consider the use of this water for irrigation as a solution to alleviate the problem of the very unreliable rain fed agriculture and to the determinant for agricultural development and self-sufficiency with respect to food production. Realizing this options and opportunities, Ethiopia, which suffered from repeated droughts, famine, low soil fertility, low productivity of the rain fed agriculture and high population pressure in the highlands is currently increasing the need to extend the agricultural production using irrigation to the vast areas of the potentially irrigable lands in the arid and semi-arid lowlands of the country at which rain-fed production is difficult .
In this regard, the Oromia Regional State has started irrigation based development project for ensuring food security and increasing agro-pastoralists’ income in Fantale District of the East Shewa Zone. However, efforts to increase agricultural productivity with the help of irrigation, improved varieties, chemical fertilizers, better management practices and other agricultural inputs will be possible only when the irrigated agriculture is supported by research outputs on the soils and irrigation water qualities in order to practice effective control of soil salinity. Thus, knowledge of the salinity/sodicity of the soil and the quality of the irrigation water is essential for managing agricultural fields effectively and increasing the output and productivity of the lands. Nevertheless, in order to create intervention scenarios, the salinity state of the research area's soils and irrigation water quality have never been assessed and recorded. Consequently, the farming communities lack enough information about the salinity and sodicity of the soil, and the quality of irrigation water. This research was initiated with the objectives of characterize and Map soil salinity status at small scale irrigated areas of Fantale district and identifying the most affected irrigation scheme so as to design appropriate soil salinity management.
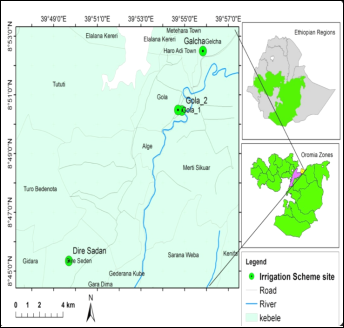
Figure 1. Location of irrigation schemes in Fantale district.
2. Materials and Methods
2.1. Description of the Study Area
Fantale District is located in East Shewa Zone of Oromia Regional State (Figure 1), in the Great Rift Valley of Ethiopia, which is about 190 km East of Addis Ababa. Specifically, the study was conducted at the Fantale Irrigation site formerly established by the Oromia governmental state. The area lies on altitude ranging from 950 at Lake Basaka to 1900 masl at Fantale Mountain.
According to the data obtained from the Fantale District Land Administration and Environmental Protection Office (FDLAEPO) (2009) and , the climate of the area is characterized as semiarid type with annual mean temperature of about 25°C, long dry period and short rain season, where the ET (annual mean of 1472 mm) that was always exceeds the rainfall amount except in July and August. The mean annual rainfall of the area is 553 mm which is insufficient and erratic in its distribution. Hence, irrigation has become an important in agricultural production activities.
2.2. Soil, Land Use and Vegetation
As the site is situated in the central Rift Valley region, it is vulnerable to the occurrences of different volcanic activities. As the result, the area is characterized with features of past and recent volcanic events, which is evident from the observation of vast lava extrusions at the foot slope of mountain Fantale. The dominant soil type of the study area is Andosols and its parent material may be grouped as volcanic materials and skeletal soils of recent alluvial and colluvial deposits. In line with this, reported that the Andosols are found along the Rift Valley of Ethiopia in which the study area is located. In the site, there are accumulations of medium to very coarse textured volcanic rocks covering the land surfaces and also accumulated in the underlying soil under the conditions where the soils moved down from hills and deposited on the rocky land surfaces.
2.3. Site Selection
General reconnaissance survey and field observation were carried out in collaboration with Agriculture and natural resource office of the district to determine the representative sampling sites. It was done on the basis of site history of irrigated and non-irrigated lands, white salt crust formation on land surface (indicator of saline soil), shining black crust soils on land surface (indicator of sodic soil), vegetation type (salinity and sodicity loving plant species or halophytic plants), surface and drainage condition which naturally hold water and crop stand status. Generally three irrigation sites (Gola, Galcha and Dire Sadi irrigation schemes) were selected based on heterogeneity of the sites like slope, duration of irrigation, land use system, drainage system and soil salinity hazard.
2.4. Soil Sampling
After site selection, three pit profile was opened at each selected site for soil sample collection. Soil samples were collected from rain fed agriculture as a control following similar procedure. All sampling points were Geo referenced. For this study, soil samples were collected to the depth of 120cm, that was classified in to three sampling depth (0-30cm, 31-60cm, and 61-90cm and 91-120cm). This depth is the most commonly used for soil salinity assessment .
2.5. Irrigation Water Sampling
Awash River is the main source of irrigation for Fantale irrigation project. Water samples were taken during the dry season. A sample was collected from the Awash River at the diversion weir for each selected site. The collecting, handling and analysis of the irrigation water samples were done according to the procedures outlined by the US Department of Agriculture, 1954. The extent of salinity in the study area was categorized based on four main parameters such as EC (electrical conductivity), pH, ESP (exchangeable sodium percentage), SAR (sodium adsorption ratio). These soil parameters were used in the guidelines for classification of salt affected soil.
2.6. Parameters for Classifications of Soil Salinity
2.6.1. Saline Soil
Saline soils are often recognized by the presence of white crusts of salts on the soil surface called “White alkali” (soluble salts) and irregular plant growth. Electrical conductivity of these soils when a solution extracted from saturated soil is greater than or equal to 4.0 mmhos/cm at 250C. The pH is generally less than 8.5, sodium makes up less than 15 percent of the exchangeable cations and the sodium adsorption ratio (SAR) is less than13 .
2.6.2. Saline-Sodic Soils
Saline Sodic soils contain large amounts of total soluble salts and exchangeable sodium. As long as excess soluble salts are present, the good physical properties (stable soil structure), the whitish appearance, the EC which is greater than 4 mmhos/cm at 25°C and the pH which is less than 8.5 are generally similar to those of saline soils. But they differ by the fact that more than 15 percent of the exchangeable cations are sodium and the sodium adsorption ratio is greater than 13.
2.6.3. Sodic Soils
Sodic soils are low in soluble salts than saline or saline-sodic soils but high in exchangeable sodium . The soil solution of sodic soils, although relatively low in soluble salts, has a composition that differs considerably from that of normal and saline soils. These soils contain (HCO32-), and CO32-as the dominant anion. At high pH readings and in the presence of carbonate ions, calcium (Ca++) and magnesium (Mg++) are precipitated and hence, the soil solutions of sodic soils usually contain only small amounts of these cations but high amount of sodium (Na+) being the predominant one. In addition, when the plants extract the water from the soil; the salts remain and become concentrated. This concentration causes the calcium to precipitate as calcium carbonate, while much of the sodium remains in the soil water. These soils have exchangeable sodium percentages of more than 15. This means that sodium occupies more than 15 percent of the soil cation exchange capacity (CEC) and the sodium adsorption ratio (SAR) is greater than 13. The electrical conductivity is less than 4 mmhos/cm at 25°C and the pH readings usually range between 8.5 and 10.
2.7. Soil Sample Preparation and Analysis
The collected soil samples were air dried, grinded to pass through 2 mm sieve and stored in clean sample bag for analysis . Following standard test procedures, soil samples were analyzed for selected chemical properties such as EC of soil solution (1:2.5 soil to water ratio), Soil pH, CEC, Exchangeable bases (Ca, Mg, Na and K). Soil pH and EC was measured using a digital pH-meter and EC-meter from soil solution. The EC of soil solution was then converted to EC of saturated soil extract, ECe using standard conversion factors established based on soil type and texture Cation exchange capacity (CEC) of the soils was extracted by excess ammonium acetate (1M NH4OAc at pH 7) solution and determined by atomic adsorption spectrophotometer while exchangeable bases (Ca, Mg, Na and K) were measured by flame photometer. CEC (cmol (+)/kg) of the soils was determined from the ammonium acetate saturated samples through distillation and measurement of ammonium using the modified Kjeldahl procedure. Finally, ESP was computed as the percentage of exchangeable Na to the CEC of the soil as follows
ESP %=Exchangeable sodium (Na+)CEC(1)
Table 1. Criteria for classifying salinity and sodicity levels in soil.

Salinity (ECe in dS/m)

Sodicity (ESP in %)

Intensity

FAO (2008)

Intensity

FAO (2008)

Non saline

0.75

Non-sodic

6

Slightly saline

0.75-2

Slightly sodic

6-10

Moderately saline

2-4

Moderately sodic

10-15

Strongly saline

4-8

Strongly sodic

15-25

Very Strongly saline

8-15

Extremely sodic

>25

Extremely saline

>15

2.8. Characterization of Salt Affected Soils
The soils were classified into the different salt affected soil classes based on the criteria established by the as follows:
Table 2. Characterization of salt affected soils based on their chemical properties.

Salt affected soil type

Electrical conductivity (EC) at 25°C (mmhos/cm)

Saturation of Exchange sodium percentage (ESP)

Soil reaction (pH value)

Saline

> 4

< 15

<8.5

Saline-sodic

> 4

> 15

<8.5 or >8.5

Sodic (Alkali)

< 4

> 15

8.5-10

Non-saline non-sodic

< 4

< 15

<8.5

2.9. Soil Salinity Mapping
Soil salinity/sodicity mapping was done using electrical conductivity and exchangeable sodium percentage by ArcGIS Ver.10.8. Kriging model was used to estimate the electrical conductivity and exchangeable sodium percentage values at un sampled sites whereas Inverse Distance Weight (IDW) was employed for spatial mapping of the other soil quality parameters .
2.10. Water Sampling and Analysis
Water samples were taken from different location along irrigation canal (upper, middle and lower) of the selected schemes. The water sample was collected using 2-litre clean glass or polyethylene (plastic) bottles. The samples were transported to the laboratory and analyzed for their chemical composition. Generally, the collection and handling of irrigation water samples were done in accordance with the procedures outlined by the . The collected water samples were subject for the analysis of pH, EC, dissolved cations (Ca, Mg, Na, K). EC and pH of the water samples were measured in a laboratory within 24 hours using conductivity meter and a digital pH meter, respectively. Soluble Ca and Mg were measured using EDTA titration, whilst exchangeable Na and K were analyzed using flame photometer. The General guidelines used for classification of salinity/sodicity hazard of irrigation water was based upon EC and Sodium Adsorption Ratio (SAR).
Table 3. General guidelines for salinity class of irrigation water USSL staff (1994).

No.

Salinity class

EC (mmhos/cm)

Sodicity class

SAR value

1

Low saline

0.1- 0.25

Low Sodicity

<10

2

Medium saline

0.25-0.75

Medium Sodicity

10 to 18

3

High saline

0.75 – 2.25

High Sodicity

18 to 26

4

Very high saline

>2.25

Very high Sodicity

>26

3. Result and Discussions
3.1. Characterization of Soil Salinity Status at Dire Sadi Irrigation Scheme
Except for soil pH, all chemical parameters were significantly different at (p<0.05) between the soil sampling depth. Maximum ESP and EC of 13.12% and 0.52mmhoms/cm respectively were observed at 0-30cm sampling depth (table 4). It showed moderately sodic on the first 30cm depth and became slightly sodic for sampling depth between 30-120cm. The average value of ESP, EC, and pH were 9.31, 0.31 and 8.31 respectively (table 4). Accordingly, based on soil salinity classification by , Soil at Dire Sadi irrigation scheme was characterized as none sodic and none saline. However, the level of ESP, EC and pH were higher near the surface showing a decreasing trend with an increasing sampling depth.Similar studies also indicated that soil salt concentration is higher near the surface in arid and semi-arid areas due to minimum rain fall to drain out soluble salt and high evaporation that makes sodium concentration to be increased on surface layer of the soil .
Table 4. Soil salinity status at Dire Sadi Irrigation schemes.

Depth(cm)

ESP (%)

SAR

EC

pH

Na+

Ca2+

Mg2+

CEC

Salinity class

Surface

12.76a

0.47b

0.26c

8.44

2.50b

12.5d

4.60b

19.60d

Moderately sodic

0-30

13.38a

0.58a

0.52a

8.43

2.69a

15.27c

2.17d

20.13d

Moderately sodic

31-60

6.62b

0.26d

0.37b

8.24

1.47c

14.88c

5.93a

22.28c

Slightly sodic

61-90

8.08b

0.38c

0.25c

8.32

2.20d

21.59b

3.50c

27.29b

Slightly sodic

91-120

5.70b

0.27d

0.17d

8.12

1.67e

24..51a

2.30d

29.38a

Slightly sodic

Mean

9.31

0.39

0.31

8.31

2.11

17.75

3.70

23.74

None sodic/saline

CV (%)

10.50

12.14

15.27

8.26

9.32

7.29

11.25

15.14

LSD (0.05)

0.67

0.014

0.05

1.01

0.12

0.65

2.12

1.04

P-value

<0.0001

0.022

0.001

0.075

0.003

0.015

0.042

0.002

ESP: Exchangeable sodium percentage, SAR: sodium absorption ratio, EC: Electrical conductivity, Na: sodium, Ca:calcium, CEC: cation exchange capacity
3.2. Distribution of ESP and EC at Dire Sadi Irrigation Scheme
Majority of scheme has ESP of 6-10% and EC 0.75-2mmhoms/cm (Figure 2). Therefore, based on , system of soil salinity classification, soil salinity of Dire Sadi irrigation scheme was categorized as slightly sodic and slightly saline.
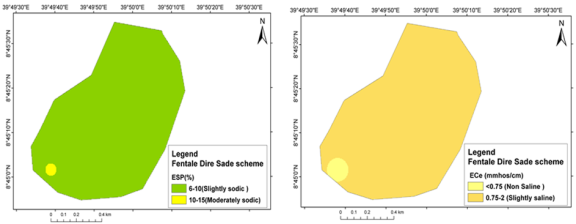
Figure 2. Map indicating the level of ESP and EC at Dire Sadi Irrigation scheme.
3.3. Characterization of Soil Salinity Status at Galcha Irrigation Scheme
The level of ESP, EC, exchangeable bases and CEC were significantly vary at (p<0.05) between the sampling depth (table 5). Maximum exchangeable sodium percentage (ESP) of 53.2% and EC 2.65 mmhoms/cm were observed in 0-30cm sampling depth. It was identified that soil at Galcha irrigation scheme was found to be very strongly sodic for the sampling depth between 0-60cm and becoming strong for the sampling depth from 61-120cm (table 5). The average ESP, EC and soil pH of the site were 35.15%, 2.9mmhoms/cm and 9.2 respectively indicating that the soil was classified as sodic soil. According to FAO system of sodic soil classification guideline, sodic soils are those that have an Exchangeable Sodium Percentage (ESP) greater than 15 and EC less than 4mmhoms/cm.
On the other hand, ESP, Na+ and EC level were decreasing as the sampling depth was increasing from the surface to 120cm indicating that sodium accumulations near the soil surface were higher (table 5). This is mainly due to high evaporation in the area that favors accumulation of sodium near the surface . High concentrations of Na+ in sodic soils displace cations such as Ca2+ and Mg2+ and remain attached to clay particles, causing severe structural deterioration . Other similar studies also indicated that high daily temperatures combined with low annual rainfall have increased water evaporation rates, which have raised the concentrations of soluble salts in the lowland areas .
Table 5. Soil salinity status at Galcha Irrigation schemes.

Depth (cm)

ESP (%)

SAR

EC

pH

Na+

Ca2+

Mg2+

CEC

Salinity class

Surface

38.02c

2.20b

3.04a

9.31

12.85a

16.34a

4.60a

33.79a

Very strongly sodic

0-30

53.20a

2.72a

2.65a

9.20

11.28b

5.77d

4.15b

21.20b

Very strongly sodic

31-60

44.69b

1.29c

3.77a

9.16

8.31c

8.04c

2.25e

18.60c

Very strongly sodic

61-90

20.74d

0.55e

2.24b

9.29

4.03e

11.79b

3.61c

19.43b

strongly sodic

91-120

19.12e

0.96d

0.78c

9.30

7.27d

8.00c

2.53d

17.80c

Strongly sodic

Mean

35.15

1.54

2.90

9.25

8.75

9.98

3.43

22.16

Sodic soil

CV (%)

14.25

16.24

17.29

8.25

11.38

12.36

13.47

17.25

LSD (0.05 )

1.01

0.03

0.12

0.18

0.15

2.13

0.09

0.38

3.4. Distribution of ESP and EC at Galcha Irrigation Scheme
Majority of scheme has ESP of 15-25% and EC 2-4mmhoms/cm (figure 3). Therefore, based on , system of soil salinity classification, soil salinity of Galcha irrigation scheme was categorized as strongly sodic (figure 3).
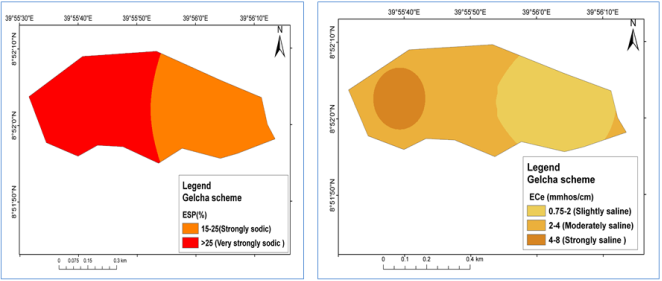
Figure 3. Map indicating the level of ESP and EC at Galcha Irrigation scheme.
3.5. Characterization of Soil Salinity Status at Gola Irrigation Scheme
Except for soil pH, all chemical parameters are significantly different at (p<0.05) between the sampling depth (table 6). Maximum ESP and EC of 10.0% and 1.37mmhoms/cm respectively were observed near the surface (<30cm). With average ESP of 8.85%, EC 0.95mmhoms/cm and pH value of 8.01, Gola irrigation scheme was classified as slightly sodic . On the other hand, ESP showed a decreasing trend with increased sampling depth but calcium concentration and CEC showed an increasing trend as the sampling depth was increasing mainly due to accumulation of volcanic ash that naturally exist in the area. Similar studies showed that presence of residual or fossil salts of former alluvial, and deposits of the weathered products from the volcanic regions were the main source for soil salinity development in the central highlands and the rift valley system of the country .
Table 6. Soil salinity status at Gola Irrigation schemes.

Depth (cm)

ESP (%)

SAR

EC

pH

Na+

Ca2+

Mg2+

CEC

Salinity class FAO (2008)

Surface

10.0a

0.38a

0.40d

8.43

1.96c

6.64b

5.50c

14.10b

slightly sodic

0-30

9.29a

0.18c

1.37a

7.82

0.97d

6.67b

6.53a

15.47b

slightly sodic

31-60

8.69b

0.35ab

1.25b

7.85

2.17a

9.54b

4.25d

24.96a

slightly sodic

61-90

8.85b

0.30b

0.85c

8.41

2.04b

17.90a

3.10e

23.04a

slightly sodic

91-120

3.50c

0.11c

0.87c

7.84

0.85e

17.62a

6.04b

24.51a

non sodic

Mean

8.85

0.27

0.95

8.07

1.60

31.52

5.08

20.42

slightly sodic

CV (%)

6.20

14.36

6.25

4.15

8.35

7.69

6.74

4.22

LSD (0.05)

1.18

0.07

0.07

0.69

0.07

6.88

0.42

2.31

ESP: Exchangeable sodium percentage, SAR: sodium absorption ratio, EC: Electrical conductivity, Na: sodium, Ca: calcium, CEC: cation exchange capacity
3.6. Distribution of ESP and EC at Gola Irrigation Scheme
Majority of scheme has ESP of 6-10% and EC 0.75-2 mmhoms/cm (figure 4). Therefore, based on , system of soil salinity classification, soil salinity of Gola irrigation scheme was categorized as slightly sodic (figure 4).
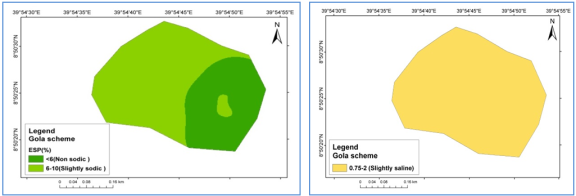
Figure 4. Map indicating the level of ESP and EC at Gola Irrigation scheme.
3.7. Differences in Soil Salinity Between Irrigation Schemes
Soil pH and accumulation of calcium in the soil showed an increasing trend as the sampling depth was increasing to 120cm. On the contrary, ESP and EC were decreasing as the soil depth was increasing (figure 6). This due the decrease in sodium accumulation while increased concentration of calcium with increased depth. Soil pH, EC, Ca+2 and ESP were higher at Galcha irrigation scheme as compared with other schemes (figures 5 & 6).
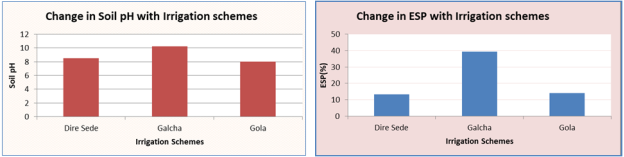
Figure 5. Level of soil pH and ESP at selected Irrigation schemes.
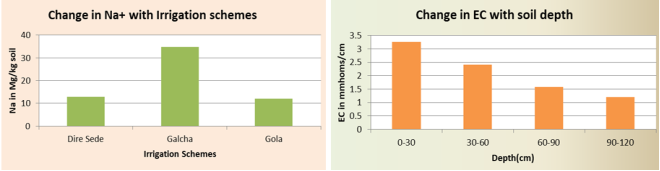
Figure 6. Level of soil EC, Na+ at selected Irrigation scheme.
3.8. Status of Irrigation Water Quality at Selected Irrigation Schemes
The quality of water for irrigation is an important component of the sustainable use of water for irrigated agriculture, especially when salinity development is expected to be a problem in an irrigated agricultural area. Different studies were used different types of measurements to classify the suitability of water for irrigation purposes but, according to Irrigation water quality standards and salinity management strategies, the sodium hazard of awash river, which is the main source of water for irrigation in the district, was classified from low to medium based on EC and SAR values (table 7). Result from irrigation water analysis indicated that water used for irrigation at all irrigation schemes were slightly sodic. This is strongly in agreement with previous results on water quality assessment made for Awash River who classified it as fresh water and most suitable for irrigation . However, continuous use of irrigation in arid and semi-arid region becomes the most common source of salts in irrigated soil . Previous studies also reported that prolonged use of irrigation water from the Awash River in June can create salinity-related difficulties only for susceptible crops . Generally, the salinity and combined impact of salinity and sodicity values were below the FAO recommendations if Awash River water is used for irrigation.
Table 7. The chemical analyses (EC and SAR) of water for irrigation.

Name of Scheme

Source of water

EC in mmhoms/cm

Salinity class

SAR

Sodicity Hazards (FAO, 2008)

Gola

River diversion

0.58

Medium Saline

17.71

Slightly sodic

Dire sade

River diversion

0.55

Medium Saline

13.59

Slightly sodic

Galcha

River diversion

0.57

Medium Saline

11.17

Slightly sodic

SAR: sodium absorption ratio, EC: Electrical conductivity
3.9. Source of Soil Salinity Problem at Irrigation Schemes
Primary Salinization occurred through natural processes such as physical or chemical weathering and transfer from the source material, geological deposits, rising of salt affected ground water and chemical weathering of soil minerals . In Awash river basin, where Fantale irrigation projects exist, the primary cause of salinity is the availability of residual or fossil salts from past alluvial, colluvial, lacustrine, and/or marine deposits of weathered primary minerals of igneous rocks which are rich in sodium . Secondary salinization is also known to be facilitated by poor drainage and in adequate irrigation water management Secondary salinization occurs at Gola and Dire Sadi irrigation scheme mainly as a result of poor drainage conditions, low rainfall and high evapotranspiration rates. Similar studies also indicated that Large-scale irrigation projects were developed in the Rift Valley without adequate drainage systems to control salinity, which led to the rapid and severe expansion of salinity and sodicity issues in the soil and the eventual loss of all land suitable for crop cultivation in these areas . In addition, increasing salt build-up in the upper soil layers at arid irrigated regions are important secondary salinization hotspots . Salt-affected areas generally occur in semi-arid and arid climates where precipitation is not adequate to leach salts, causing soils rich in some calcium carbonate and an accumulation of exchangeable sodium that can generate a high pH . Significant evaporation occurred on the surface soil during irrigation, which promoted the development of soil salinity. Galcha, Gola, and Dire Sade were found to be situated in low-lying, dry regions where salinity and sodicity of soil and water are frequent, according to . Discharge from Basaka Lake, which is saltwater, is the primary source of chronic or increasing salt build-up in the upper layers of the soil at Galcha irrigation scheme. It was occurred when water containing soluble salts were applied to the land over a prolonged period .
4. Conclusion
Soil in semi-arid and arid areas, where precipitation is not adequate to leach salts, are rich in some calcium carbonate and an accumulation of exchangeable sodium. Agricultural production and productivity can be adversely affected by the presence of excessive salts in soils. It affects biodiversity, moisture and nutrient availability to crop by disturbing the osmotic process. Therefore, characterization and mapping of salt affected areas before management interventions are very important.
Characterization and mapping were done for three irrigation schemes selected based on observations of salinity problems. To assess and characterize the extent, nature, and distribution of salinity and sodicity soil samples were collected from the surface using augur, and from pits at different depth interval (0–30cm, 31−60cm, 61−90cm and 91-120cm) Accordingly, soil samples were collected and analyzed for pH, EC, Na+, ESP, SAR, Ca2+, Mg2+, K+, and CEC. The result was compared with the standards set by FAO system to classify soil and water salinity. Accordingly, It was identified that Galcha irrigation scheme was characterized as sodic due to very strong sodium concentration with average ESP of 53.2% and EC 3.95 mmhoms/cm and pH about 9.25. On the other hand, Gola and Dire Sade Irrigation schemes were characterized as moderately and slightly sodic respectively. Sodium was the dominant soluble cation, followed by calcium, magnesium, and potassium in all soil depths and schemes. The soluble Na+ content of the soil was increased near the surface and decreases consistently with an increasing sampling depth mainly due to the movement of exchangeable Ca2+ to soil depth by leaching, displacing the exchangeable sodium. Beside primary Salinization of natural processes such as physical or chemical weathering parent material, discharge Basaka Lake to the downstream, was the main source of chronic or increasing salt build-up in the upper layers of the soil at Galcha irrigation scheme. On the other hand, irrigation water analysis indicated that water used for irrigation at all irrigation schemes were slightly sodic. Poor drainage system and irrigation water management practices by the farmers were expected to contribute soil salinity development at all irrigation schemes.
5. Recommendations
Sustainable soil and irrigation water management practices have a vital role in enhancing crop production and soil productivity of lowland irrigated lands. Therefore, the study underscores the need for a scientific reclamation of sodic soils primarily at Galcha Irrigation scheme where sodium concentration in the soil was very strong. Based on the above findings, the following recommendations were given:
1. Water used for irrigation (Awash River) is fresh and suitable for removal of the salts from the soil depth through drainage and leaching to improve the productivity of salt affected soil.
2. Selecting salt-tolerant crops and timber plants may be more appropriate.
3. Crop rotation and adding organic matter is also recommended to improve soil fertility and soil structure.
4. Integrated application of Gypsum and organic matter for sodic soil reclamation.
5. Adopting /generating irrigation water management technologies.
Abbreviations

EC

Electrical Conductivity

ESP

Exchangeable Sodium Percentage

SAR

Sodium Adsorption Ratio

CEC

Cation Exchange Capacity

IDW

Inverse Distance Weight

FDLAEPO

Fantale District Land Administration and Environmental Protection Office

FAO

Food and Agriculture Organization

Author Contributions
Kasahun Kitila Hunde: Conceptualization, Data curation, riting - original draftm, Writing - review & editing
Zelalem Shelemew: Data curation, Software, Supervision, Validation, Investigation, Writing - original draft, Methodology, Project administration, Writing - review & editing
Ambase Abomsa: Data curation, Writing - original draft, Methodology, Writing - review & editing
Mekonnen Workina: Data curation, Writing - original draft, Methodology, Writing - review & editing
Acknowledgments
The authors are grateful to Oromia Agricultural Research institute for providing finance, Adami Tulu Agricultural Research center for facilitating logistics during data collection and Batu Soil Research center for conducting soil and water analysis. Last but not least the authors are grateful to the anonymous reviewers for their valuable comments that improve this paper for publication.
Conflicts of Interest
The authors declare no conflicts of interest.
References
[1] Abebe, Y., Whitehead, P., Alamirew, T., Jin, L., & Alemayehu, E. (2023). Evaluating the effects of geochemical and anthropogenic factors on the concentration and treatability of heavy metals in Awash River and Lake Beseka, Ethiopia: arsenic and molybdenum issues. Environmental Monitoring and Assessment, 195(10), 1188.
[2] Asfaw, E., Suryabhagavan, K. and Argaw, M. (2018) Soil Salinity Modeling and Map ping Using Remote Sensing and GIS: The Case of Wonji Sugar Cane Irrigation Farm, Ethiopia. Journal of the Saudi Society of Agricultural Sciences, 17, 250-258.
[3] Chari, M. M., et al. (2013) Prediction of Evaporation from Shallow Water Table Using Regression and Artificial Neural Networks. Journal of Agricultural Science (Toronto), 5, 168-180.
[4] De la Paix, M. J., et al. "Physicochemical properties of saline soils and aeolian dust." Land Degradation & Development 24.6(2013): 539-547.
[5] Desta, Lakew. Land degradation and strategies for sustainable development in the Ethiopian highlands: Amhara Region. Vol. 32. ILRI (aka ILCA and ILRAD), 2000.
[6] Dubois, G., et al. (2011) Geoinformatics for Environmental Surveillance. Computers & Geosciences, 37, 277-279.
[7] Fantaw, A. (2007). An overview of Salt-affected soils and their management status in Ethiopia. A paper presented in the 3rd International Workshop on Water Management project, Haramaya University, Ethiopia.
[8] FAO (Food and Agriculture Organization), Guide Line for Soil Description, FAO (Food and Agriculture Organization), Rome, Italy, 2006.
[9] Golchin, A., and H. Asgari. "Land use effects on soil quality indicators in north-eastern Iran." Soil Research 46.1(2008): 27-36.
[10] Kumar, Sunjeet, et al. "Effect of salt stress on growth, physiological parameters, and ionic concentration of water dropwort (Oenanthe javanica) cultivars." Frontiers in plant science 12(2021): 660409.
[11] Li, Jin, and Andrew D. Heap. "A review of comparative studies of spatial interpolation methods in environmental sciences: Performance and impact factors." Ecological Informatics 6.3-4(2011): 228-241.
[12] Megersa, Bekele, et al. "Impacts of climate change and variability on cattle production in southern Ethiopia: Perceptions and empirical evidence." Agricultural systems 130(2014): 23-34.
[13] Qadir, Manzoor, and S. J. L. D. Schubert. "Degradation processes and nutrient constraints in sodic soils." Land Degradation & Development 13.4(2002): 275-294.
[14] Megersa, Moa, 2014. "Effect of salt solutions on coagulation performance of Moringa stenopetala and Maerua subcordata for turbid water treatment." Separation and Purification Technology 221(2019): 319-324.
[15] Megersa O., Willibald L. & Josef F., (2009) Effect of Lake Basaka expansion on the sustainability of Matahara SE in the Awash river basin, Ethiopia, Addis Ababa.
[16] Mateo-Sagasta, J. and Burke, J. (2011) Agriculture and Water Quality Interactions: A Global Overview. SOLAW Background Thematic Report-TR08, 46.
[17] Panagea, I., et al. (2016) Evaluation of Promising Technologies for Soil Salinity Ame lioration in Timpaki (Crete): A Participatory Approach. Solid Earth, 7, 177-190.
[18] Tessema, Negash, et al. "Soil and irrigation water salinity, and its consequences for agriculture in Ethiopia: a systematic review." Agriculture 13.1(2022): 109.
[19] Shirgire, S. T., et al. "Salinity and Sodicity Based Degradation Status of Cultivated Soils of Jamnagar District of Gujarat State." (2015).
[20] Singh, Kripal. "Microbial and enzyme activities of saline and sodic soils." Land Degradation & Development 27.3(2016): 706-718.
[21] Sileshi, A., Kibebew, K., & Amanuel, Z. (2015). Temporal and spatial variations in of salt-affected soils using GIS and remote sensing at Dubti/Tendaho state farm. [Ph. D. Dissertation thesis]. Haramaya University, Ethiopia.
[22] Gebrekidan, H.; Mishra, B. B. Salt Affected Soils of Middle Awash River Basin of Ethiopia: Appraisal, Characterization and Classification. Geoderma 2005, 15, 7–15.
[23] Haile, Lemma Mamo. "Soil Salinity and Irrigation Water Quality Status in Selected Areas of Awash River Basin of Ethiopia. A Review." Greener journal of soil science and plant nutrition 6.1(2019): 25-32.
[24] Qureshi, A. S.; Tesfaye, E. M.; Melese, M. G. (2020). Extent Characterization and Management Strategies for the Salt Affected Soils in Ethiopia; Project Report, No. 2; Dubai, United Arab Emirates, 2020; p. 94.
[25] Regional Salinity Laboratory (US). Diagnosis and improvement of saline and alkali soils. No. 60. US Department of Agriculture, 1954.
[26] Rhoades, Lesch, S. M., J. D., Lund, L. J., & Corwin, D. L. (1992). Mapping soil salinity using calibrated electromagnetic measurements. Soil Science Society of America Journal, 56(2), 540-548.
[27] Robertson, M. J., et al. "Temporal and spatial patterns of salinity in a catchment of the central wheatbelt of Western Australia." Soil Research 48.4(2010): 326-336.
[28] Singh, G. "Salinity‐related desertification and management strategies: Indian experience." Land Degradation & Development 20.4(2009): 367-385.
[29] Trnka, M., et al. (2013) Consequences of Climate Change for the Soil Climate in Cen tral Europe and the Central Plains of the United States. Climatic Change, 120, 405- 418.
[30] USDA, FAO. "112 CLASSIFICATION OF SOILS: FAO." ENCYCLOPEDIA of SOIL SCIENCE: 2006.
[31] Wallender, W. W. and Tanji, K. K. (2011) Agricultural Salinity Assessment and Man agement. American Society of Civil Engineers (ASCE), Reston.
[32] Wahab, M. A., M. A. Rasheed, and R. A. Youssef. "Degradation hazard assessment of some soils north Nile Delta, Egypt." Journal of American Science 6.6(2010): 156-161.
[33] Worku, Ashenafi, Bobe Bedadi, and Muktar Mohammed. Assessment and Mapping of Fertility Status of Salt Affected soils Amibara Area, Central Rift Valley of Ethiopia. Diss. MSc Thesis, School of Graduate Studies, Haramaya University, Haramaya, Ethiopia, 2015.
[34] Zinabu, Gebre-Mariam, and Nicholas JG Pearce. "Concentrations of heavy metals and related trace elements in some Ethiopian rift-valley lakes and their in-flows." Hydrobiologia 492(2003): 171-178.
[35] Zhang, M., et al. (2017) Characteristics of Soil Salinity in the Typical Area of Yellow River Delta and Its Control Measures. IOP Conference Series: Earth and Environ mental Science, 64, Article ID: 012078.
[36] Jim M,. Pam, P. (2002). How to interpret if your soil is sodic, using soil physical & chemical test results, Sheet number 11, Chrysalis Landscape Consultants Australia.
[37] Jackson, M. L. (1973) Soil Chemical Analysis. Prentice Hall of India Pvt. Ltd., New Delhi, 498.
Cite This Article
  • APA Style

    Hunde, K. K., Shelemaw, Z., Ambomsa, A., Workina, M. (2024). Characterization and Mapping of Soil Salinity Status at Small-Scale Irrigation Farm: The Case of Fantale Irrigation Project Sites. International Journal of Science, Technology and Society, 12(3), 108-119. https://doi.org/10.11648/j.ijsts.20241203.12

    Copy | Download

    ACS Style

    Hunde, K. K.; Shelemaw, Z.; Ambomsa, A.; Workina, M. Characterization and Mapping of Soil Salinity Status at Small-Scale Irrigation Farm: The Case of Fantale Irrigation Project Sites. Int. J. Sci. Technol. Soc. 2024, 12(3), 108-119. doi: 10.11648/j.ijsts.20241203.12

    Copy | Download

    AMA Style

    Hunde KK, Shelemaw Z, Ambomsa A, Workina M. Characterization and Mapping of Soil Salinity Status at Small-Scale Irrigation Farm: The Case of Fantale Irrigation Project Sites. Int J Sci Technol Soc. 2024;12(3):108-119. doi: 10.11648/j.ijsts.20241203.12

    Copy | Download

  • @article{10.11648/j.ijsts.20241203.12,
      author = {Kasahun Kitila Hunde and Zelalem Shelemaw and Ambase Ambomsa and Mekonnen Workina},
      title = {Characterization and Mapping of Soil Salinity Status at Small-Scale Irrigation Farm: The Case of Fantale Irrigation Project Sites
    },
      journal = {International Journal of Science, Technology and Society},
      volume = {12},
      number = {3},
      pages = {108-119},
      doi = {10.11648/j.ijsts.20241203.12},
      url = {https://doi.org/10.11648/j.ijsts.20241203.12},
      eprint = {https://article.sciencepublishinggroup.com/pdf/10.11648.j.ijsts.20241203.12},
      abstract = {Agricultural production and productivity can be adversely affected by the presence of excessive salts in soils particularly in semi-arid and arid areas. Knowledge of the salinity/sodicity of the soil and the quality of the irrigation water is essential for managing agricultural fields effectively and increasing the output and productivity of the lands. This research was initiated with the objectives of characterizing and Mapping of soil salinity status at small scale irrigated areas of Fantale district and identifying the most affected irrigation scheme so as to design appropriate soil salinity management. The study was conducted at Fentale district of Galcha, Gola and Dire Sade irrigation schemes. Soil samples were collected from the surface using augur, and from pits at different depth interval and analyzed for pH, EC, Na+, ESP, SAR, Ca2+, Mg2+, K+, and CEC. The result was compared with the standards set by FAO system to classify soil and water salinity. Accordingly, it was identified that Galcha irrigation scheme was characterized as sodic due to very strong sodium concentration with average ESP of 53.2% and EC 3.95 mmhoms/cm and pH about 9.25. On the other hand, Gola and Dire Sade Irrigation schemes were characterized as moderately and slightly sodic respectively. Sodium was the dominant soluble cation, followed by calcium, magnesium, and potassium in all soil depths and schemes. Beside primary Salinization of natural processes such as physical or chemical weathering parent material, and discharge Basaka Lake to the downstream, was the main source of salt build-up in the upper layers of the soil at Galcha irrigation scheme. On the other hand, irrigation water analysis indicated that water used for irrigation at all irrigation schemes were slightly sodic. Therefore, the study underscores the need for a scientific reclamation of sodic soils primarily at Galcha Irrigation scheme where sodium concentration in the soil was very strong.
    },
     year = {2024}
    }
    

    Copy | Download

  • TY  - JOUR
    T1  - Characterization and Mapping of Soil Salinity Status at Small-Scale Irrigation Farm: The Case of Fantale Irrigation Project Sites
    
    AU  - Kasahun Kitila Hunde
    AU  - Zelalem Shelemaw
    AU  - Ambase Ambomsa
    AU  - Mekonnen Workina
    Y1  - 2024/05/24
    PY  - 2024
    N1  - https://doi.org/10.11648/j.ijsts.20241203.12
    DO  - 10.11648/j.ijsts.20241203.12
    T2  - International Journal of Science, Technology and Society
    JF  - International Journal of Science, Technology and Society
    JO  - International Journal of Science, Technology and Society
    SP  - 108
    EP  - 119
    PB  - Science Publishing Group
    SN  - 2330-7420
    UR  - https://doi.org/10.11648/j.ijsts.20241203.12
    AB  - Agricultural production and productivity can be adversely affected by the presence of excessive salts in soils particularly in semi-arid and arid areas. Knowledge of the salinity/sodicity of the soil and the quality of the irrigation water is essential for managing agricultural fields effectively and increasing the output and productivity of the lands. This research was initiated with the objectives of characterizing and Mapping of soil salinity status at small scale irrigated areas of Fantale district and identifying the most affected irrigation scheme so as to design appropriate soil salinity management. The study was conducted at Fentale district of Galcha, Gola and Dire Sade irrigation schemes. Soil samples were collected from the surface using augur, and from pits at different depth interval and analyzed for pH, EC, Na+, ESP, SAR, Ca2+, Mg2+, K+, and CEC. The result was compared with the standards set by FAO system to classify soil and water salinity. Accordingly, it was identified that Galcha irrigation scheme was characterized as sodic due to very strong sodium concentration with average ESP of 53.2% and EC 3.95 mmhoms/cm and pH about 9.25. On the other hand, Gola and Dire Sade Irrigation schemes were characterized as moderately and slightly sodic respectively. Sodium was the dominant soluble cation, followed by calcium, magnesium, and potassium in all soil depths and schemes. Beside primary Salinization of natural processes such as physical or chemical weathering parent material, and discharge Basaka Lake to the downstream, was the main source of salt build-up in the upper layers of the soil at Galcha irrigation scheme. On the other hand, irrigation water analysis indicated that water used for irrigation at all irrigation schemes were slightly sodic. Therefore, the study underscores the need for a scientific reclamation of sodic soils primarily at Galcha Irrigation scheme where sodium concentration in the soil was very strong.
    
    VL  - 12
    IS  - 3
    ER  - 

    Copy | Download

Author Information
  • Oromia Agricultural Research Institute, Adami Tulu Agricultural Research Center, Soil Fertitlity Research Team, Ziway, Ethiopia

  • Oromia Agricultural Research Institute, Adami Tulu Agricultural Research Center, Irrigation, Drainage and Water Harvesting Engineering Research Team, Ziway, Ethiopia

  • Oromia Agricultural Research Institute, Adami Tulu Agricultural Research Center, Irrigation, Drainage and Water Harvesting Engineering Research Team, Ziway, Ethiopia

  • Oromia Agricultural Research Institute, Adami Tulu Agricultural Research Center, Soil Fertitlity Research Team, Ziway, Ethiopia

  • Abstract
  • Keywords
  • Document Sections

    1. 1. Introduction
    2. 2. Materials and Methods
    3. 3. Result and Discussions
    4. 4. Conclusion
    5. 5. Recommendations
    Show Full Outline
  • Abbreviations
  • Author Contributions
  • Acknowledgments
  • Conflicts of Interest
  • References
  • Cite This Article
  • Author Information