Abstract
Concrete structures are frequently exposed to elevated temperatures during fire incidents, leading to significant degradation of mechanical and durability properties. This study experimentally investigates the thermo-mechanical performance of reinforced concrete beams incorporating geosynthetic reinforcement when subjected to elevated temperature exposure. Concrete cubes and reinforced beams, with and without embedded geotextile layers, were cast and tested under ambient conditions and after thermal exposure at temperatures up to 300°C for cubes and 600°C for beams. Both destructive and non-destructive tests, including compressive strength, rebound hammer, ultrasonic pulse velocity, and flexural strength tests, were conducted to evaluate residual mechanical performance. The results indicate that geosynthetic-reinforced concrete exhibited higher compressive and flexural strength retention compared to conventional reinforced concrete after thermal exposure. At 300°C, geotextile-reinforced concrete showed a compressive strength reduction of approximately 9.6%, compared to 20.4% for plain concrete. Similarly, flexural strength loss at 600°C was reduced from about 40% in control beams to 25% in geosynthetic-reinforced beams. Increased ductility and reduced stiffness were observed at elevated temperatures due to polymer softening and microstructural changes. Overall, the findings demonstrate that geosynthetic reinforcement can enhance post-fire mechanical performance of reinforced concrete members, although its thermal limitations must be carefully considered in fire-resistant structural design.
Keywords
Geosynthetics, Reinforced Concrete, Elevated Temperature, Fire Resistance, Compressive Strength
1. Introduction
Concrete remains a primary structural material in construction due to its strength, durability, ease of fabrication, and non-combustibility
| [13] | Fib. (2022). Fire design of concrete structures. Federation international of Bulletine. |
[13]
. Structural concrete members must satisfy rigorous temperature safety requirements in modern building codes, as elevated temperatures represent one of the most severe environmental exposures for structures
| [15] | Kodur, V. (2023). Engineering Structures, 278, 115502. |
[15]
. Temperature resistance – defined as the duration a structural member maintains integrity, stability, and thermal protection – is now evaluated through performance-based design approaches
| [7] | Bisby, L. (2021). Fire Technology, 57(3), 1119–1150. |
[7]
. Concrete's exceptional temperature resistance stems from its low thermal conductivity, high heat capacity, and gradual strength degradation at elevated temperatures
| [2] | Aslani, F., & Samali, B. (2021). Construction and Building Materials, 283, 122730. |
[2]
.
The behavior of concrete structural members under thermal exposure depends on temperature-dependent changes in thermophysical, mechanical, and deformation properties
| [15] | Kodur, V. (2023). Engineering Structures, 278, 115502. |
[15]
. These properties vary significantly with concrete composition, where high-strength concrete (HSC) exhibits distinct thermal responses compared to normal-strength concrete (NSC), particularly regarding strength retention, moisture migration, and spalling susceptibility
| [14] | Jansson, R., & Boström, L. (2021). Fire Technology, 57(4), 1687–1712. |
[14]
. Modern temperature resistance assessment combines standardized testing
| [3] | ASTM International. (2022). ASTM E119-22: Standard test methods for fire tests of building construction and materials. ASTM International. |
[3]
with advanced numerical modeling
| [13] | Fib. (2022). Fire design of concrete structures. Federation international of Bulletine. |
[13]
. Computational methods enable prediction of temperature distributions, material property degradation, and structural performance under fire exposure (Kodur et al., 2021). Accurate characterization of temperature-dependent properties – including thermal-induced spalling phenomena – is essential for reliable performance predictions
| [1] | Annerel, E., & Taerwe, L. (2021). Fire Safety Journal, 123, 103361. |
[1]
.
2. Materials and Methods
2.1. Materials
The materials for this research work were carefully sourced and selected from both Ogun and Lagos States in order to ensure absolute compliance with relevant codes and specifications.
2.1.1. Cement
The cement used for this research was Dangote 3X 42.5N Ordinary Portland Cement purchased from a distributor. The N meant that the cement brand is a normal setting and that it could reach a minimum compressive strength of 42.5MPa (megapascal) at 28 days. The initial setting time is within the range of 130 to 150 (min) and expansion < 4mm. The cement comprises of 85% limestone, 5% silica, 5% gypsum, and 5% clay.
2.1.2. Fine Aggregate
Clean river sharp sand in accordance to BS 882 was obtained from Sagamu in Ogun State for this research.
2.1.3. Coarse Aggregate
Clean crushed granite of 19mm diameter maximum particle size obtained from a construction site was used used in batching of the concrete samples for this research work.
2.1.4. Water
Clean, drinkable water in accordance to
| [4] | ASTM International. (n.d.). ASTM C39: Standard test method for compressive strength of cylindrical concrete specimens. ASTM International. |
[4]
was obtained from Makun City and used for this research.
2.1.5. Geotextile
PET woven geotextile with 200 – 400 KN/m strength and stable up to 150⁰C in accordance to
| [5] | ASTM International. (n.d.). ASTM C78/C78M: Standard test method for flexural strength of concrete (using simple beam with third-point loading). ASTM International. |
| [6] | ASTM International. (n.d.). ASTM C805: Standard test method for rebound number of hardened concrete. ASTM International. |
[5, 6]
was obtained from Polage Infravest, in Lagos for this research.
2.1.6. Reinforcement
The steel used for this research were 12mm and 10mm diameter main bar and stirrup in beam in conformity to
| [7] | Bisby, L. (2021). Fire Technology, 57(3), 1119–1150. |
[7]
. The reinforcement bars were high tensile steel TNT of PSL brand obtained from a construction site at Makun City. The tensile strength of the steel bars were within 410 – 460N/mm
2.
2.2. Methods
The test carried out on the cubes was compressive test (combination of non-destructive and destructive tests)
| [8] | British Standards Institution. (2002). BS EN 1008: 2002: Mixing water for concrete — Specification for sampling, testing and assessing the suitability of water, including water recovered from processes in the concrete industry, as mixing water for concrete. BSI. |
| [9] | British Standards Institution. (2016). BS 4449: 2005 + A3: 2016: Steel for the reinforcement of concrete — Weldable reinforcing steel — Bar, coil and decoiled product — Specification. BSI. |
| [10] | British Standards Institution. (2017). BS EN 12620: 2013+A1: 2017: Aggregates for concrete. BSI. |
[8-10]
while flexural test
| [11] | British Standards Institution. (n.d.). BS EN 12390-3: Testing hardened concrete — Compressive strength of test specimens. BSI. |
| [12] | British Standards Institution. (n.d.). BS EN 12390-5: Testing hardened concrete — Flexural strength of test specimens. BSI. |
[11, 12]
was carried out on the beams specimen. Also, there was visual observations to establish changes in colour and crack patterns.
2.2.1. Concrete Batching
The concrete batching for the specimen was by volume, using cement-fine aggregate-coarse aggregate ratio (1: 1: 2) with a target compressive strength of 30N/mm2 in 28 days. The cement-water ratio was 0.5 for the mix. The concrete cubes were casted in 100mm x 100mm x 100mm cube sizes. There are two groups of specimen, the first group of specimen with had geotextile sheets cut and placed at the middle of the cubes and also in the steel reinforced beams. The second group of specimen is the conventional plain concrete cubes and steel reinforced concrete beams.
All the beams were cast in 150mm x 150mm x 1000mm size (
Figure 1), properly vibrated and cured in water.
Figure 1. Image Showing Concrete Cubes with Geotextile at the Middle.
2.2.2. Determination of Mechanical Properties of Reinforced Concrete
In this research, both compressive and flexural test were carried out on the specimen at different temperature condition in order to investigate mechanical properties of the conventional specimen and the geotextile reinforced specimen.
(i). Compressive Strength Test on Concrete Samples at Elevated Temperature (Non-Destructive and Destructive Tests)
Concrete compressive strength was measured using both destructive and non-destructive methods. NDT methods was used for in-situ assessments without any damage to the structure.
Objective
The objective was to determine the compressive strength of concrete samples using both non-destructive (ultrasonic pulse velocity and rebound hammer) and destructive (crushing) testing methods.
Materials and Apparatus
i. Concrete cubes (100 mm x 100 mm x 100 mm)
ii. Compression testing machine
iii. Schmidt rebound hammer
iv. Vernier caliper
v. Weighing balance
vi. Heat treatment furnace
Methods for Elevated Temperature Procedure
1. The cubes were measured and weighed.
2. The cubes were placed in a furnace and heated to 300°C.
3. At the optimum temperature, the cubes was left in the oven for 2 hours.
4. The cubes was allowed to cool to room temperature (air cooling).
5. Proceeded to NDT
Non-Destructive Test
Rebound Hammer Test
1. The rebound hammer was calibrated.
2. The hammer was held perpendicular to the surface of the cube.
3. 10 rebound readings was taken on the surfaces and the average recorded.
4. The compressive strength was determined through the correlation chart.
Destructive Test
1. The cubes were measured, weighed and checked for any visible defects.
2. Each cube was placed at the center of the compression testing machine.
3. Load was gradually applied without shock
4. The maximum load at failure was recorded and compressive strength calculated.
Summary of Testing
1. Total Concrete Cubes: 32 (100 mm x 100 mm x 100 mm)
2. Cubes with Geotextile: 16
3. Cubes without Geotextile: 16
4. Heating Protocol: Cubes were heated at 300°C on a Vecstar Heat-Treatment Furnace machine for 2 hours on days 7, 14, 21, and 28.
Formula for Calculating Compression Strength
Where:
Fc = compressive strength (N/mm2)
P = maximum load (N)
A = cross-sectional area (mm2)
Heated Cube Schedule
Table 1. Tabular Representation of Oven Heating Schedule.
Day | Geotextile Sample | Non-geotextile Sample |
7 | 2 | 2 |
14 | 2 | 2 |
21 | 2 | 2 |
28 | 2 | 2 |
Non-heated Cube Schedule
Table 2. Tabular Representation of Non-Heated Cube Schedule.
Day | Geotextile Sample | Non-geotextile Sample |
7 | 2 | 2 |
14 | 2 | 2 |
21 | 2 | 2 |
28 | 2 | 2 |
Figure 2. Image Showing a Weighing Machine.
Figure 3. Image showing Vecstar Heat-Treatment Furnace machine.
Figure 4. Images Showing Laboratory Activities by the Researcher.
Figure 5. Image Showing Crushing Test of The Concrete Cube Samples.
(ii). Flexural Strength Test on Reinforced Concrete Beam with Geotextile at Elevated Temperature
Evaluation of flexural strength of reinforced concrete beam (embedded with and without geotextile) at elevated temperature
Objectives
To determine the flexural strength (modulus of rupture) of a reinforced concrete beam (embedded with and without geotextile) at ambient and elevated temperature conditions.
Materials and Apparatus
1) Reinforced concrete beam (150 × 150 × 1000 mm)
2) Flexural testing machine
3) One-point loading apparatus
4) Thermocouple and furnace (for elevated temp.)
5) Geotextile
6) Steel rollers and supports
7) Measuring tape, thermometer
8) Dial gauge
Elevated Temperature Procedure
1. Rebound hammer test was done and recorded at the L/2, L/4 to the right, and at L/4 to the left of the beam. (L = beam span)
2. The beams were heated on a burner and the heat change at 20minutes intervals recorded.
3. The beams were heated to the optimal temperature of 600°C.
4. Allowed to cool to room temperature (air cooling).
5. Proceeded to flexural testing.
Flexural Strength Test Procedure
1. Rebound hammer test was done and recorded at the L/2, L/4 to the right, and at L/4 to the left of the beam. (L = beam span)
2. The beams were placed on two steel rollers, the mid-span and end supports were marked.
3. Loading was applied gradually at the mid-span using hydraulic actuator.
4. Visual observation and marking of the cracks was done at different loadings.
5. Deflection against different loading intervals were recorded.
6. Maximum load at failure was recorded.
Formula for Calculating Flexural Strength
For one-point loading:
Where:
FSF = flexural strength
F = maximum load (N/mm2)
L = span length (mm)
b = width of beam (mm)
d = depth of beam (mm)
Summary of Testing
1) Total Concrete Cubes: 4 (150 mm x 150 mm x 1000 mm)
2) Beams with Geotextile: 2
3) Beams without Geotextile: 2
4) Heating Protocol: One beam specimen each (with and without geotextile) were heated on a burner at 28 days.
5) Control: One beam specimen each (with and without geotextile) were tested at ambient temperature.
Figure 6. Image Showing Concrete Beam Heated to 600°C For 2 Hours Using an Open Fire.
Figure 7. Rebound hammer test on concrete beam before flexural test.
Figure 8. Beam Sample Undergoing Flexural Testing.
Figure 9. Visible Cracks on Concrete Beam During Flexural Strength Testing.
3. Results and Discussion
3.1. Presentation of Results
Concrete samples were evaluated through both compressive and flexural test to understand the effect of geosynthetic system in a reinforced concrete structure when exposed to an elevated temperature. The result is presented in the form of table, graph, and text for effective data and results presentation.
3.2. Compressive Strength Result
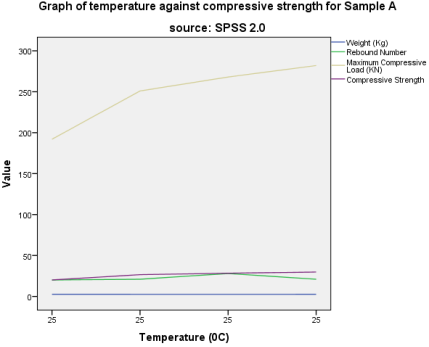
Table 3. Average compressive strength of Sample A.
Days of Curing | Temperature (°C) | Weight (Kg) | Rebound Number | Maximum Compressive Load (KN) | Compressive Strength (N/mm2) |
7 | 25 | 2.60 | 20 | 201 | 20.1 |
14 | 25 | 2.57 | 21 | 266 | 26.6 |
21 | 25 | 2.55 | 28 | 283 | 28.3 |
28 | 25 | 2.58 | 21 | 298 | 29.8 |
Figure 10. Diagram showing graph of temperature compressive strength for sample A.
Figure 10 illustrates the relationship between temperature and compressive strength for sample A. Typically, as temperature increases, the compressive strength of concrete decreases due to thermal degradation. The graph showed a decline in compressive strength with rising temperatures, indicating that sample A experiences significant strength loss at elevated temperatures. The rate of strength reduction may vary, with a more pronounced drop at higher temperatures, possibly due to the decomposition of hydration products or the degradation of geosynthetic reinforcement present.
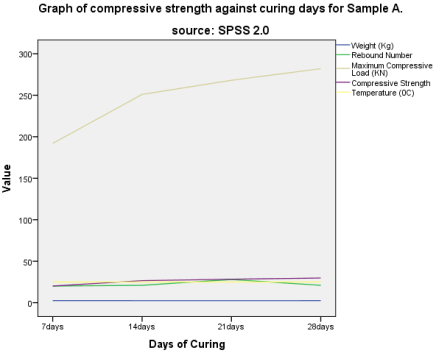
This graph depicts the development of compressive strength in sample A over curing days. Concrete typically gained strength rapidly in the initial days (7-14 days) and then at a slower rate up to 28 days and beyond.
Figure 11. Diagram showing graph of compressive strength against curing days for sample A.
The curve showed an exponential growth pattern, leveling off as curing progresses. This behavior is attributed to the ongoing hydration process, where cement reacts with water to form strength-giving compounds. Any deviation (e.g., slower strength gain) might be due to the inclusion of geosynthetics.
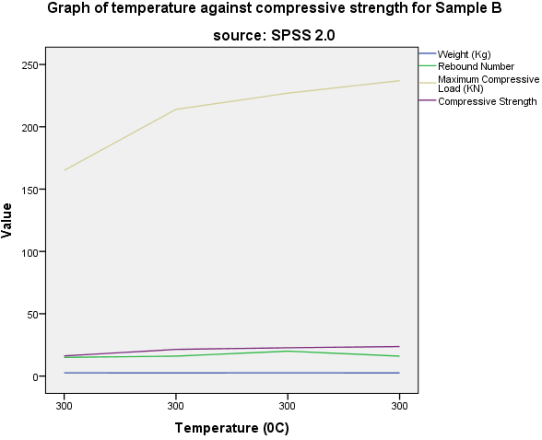
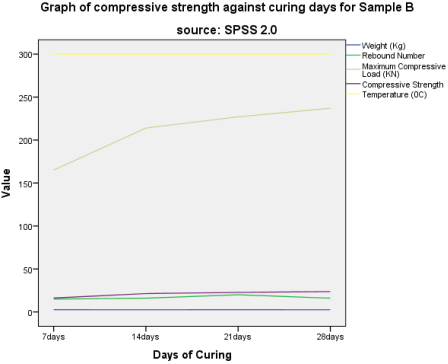
Table 4. Average compressive strength of Sample B.
Days of Curing | Temperature (°C) | Weight (Kg) | Rebound Number | Maximum Compressive Load (KN) | Compressive Strength (N/mm2) |
7 | 300 | 2.58 | 15 | 165 | 16.5 |
14 | 300 | 2.55 | 16 | 214 | 21.4 |
21 | 300 | 2.59 | 20 | 227 | 22.7 |
28 | 300 | 2.55 | 16 | 237 | 23.7 |
Figure 12. Diagram showing graph of temperature compressive strength for sample B.
Figure 12 presents the effect of temperature on the compressive strength of sample B. The trend is expected to show a reduction in strength with increasing temperature. However, the rate and extent of strength loss may differ from sample A, possibly due to variations in the geosynthetic reinforcement type, content, or concrete mix design. A comparative analysis with sample A would reveal the relative thermal stability of sample B.
Figure 13. Diagram showing graph of compressive strength against curing days for sample B.
This Figure shows the compressive strength development of sample B over curing time. The pattern resembled that of sample A (
Figure 13) but exhibit differences in early or late strength due to the geosynthetic used. For instance, sample B showed enhanced early strength as the geosynthetic accelerated hydration and provided immediate reinforcement.
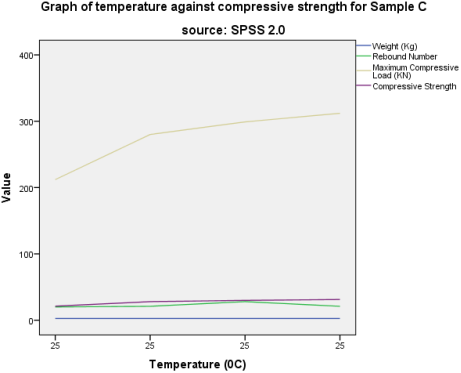
Figure 14. Diagram showing graph of temperature compressive strength for sample C.
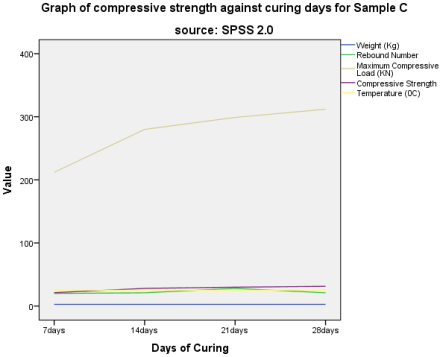
Table 5. Average compressive strength of Sample C.
Days of Curing | Temperature (°C) | Weight (Kg) | Rebound Number | Maximum Compressive Load (KN) | Compressive Strength (N/mm2) |
7 | 25 | 2.60 | 20 | 212 | 21.2 |
14 | 25 | 2.58 | 21 | 280 | 28.0 |
21 | 25 | 2.60 | 28 | 299 | 29.9 |
28 | 25 | 2.58 | 21 | 312 | 31.2 |
This graph demonstrates how the compressive strength of sample C responds to elevated temperatures. The degradation trend is anticipated, but the critical temperature thresholds (e.g., where strength loss becomes drastic) might differ from samples A and B. The geosynthetic in sample C may have better thermal resistance, leading to a slower rate of strength reduction, or vice versa.
Figure 15. Diagram showing graph of compressive strength against curing days for sample C.
The compressive strength progression of sample C during the curing days is displayed here. Compared to samples A and B, sample C shows unique curing characteristics, such as delayed strength gain due to the geosynthetic used. The 28-day strength is a key indicator of long-term performance.
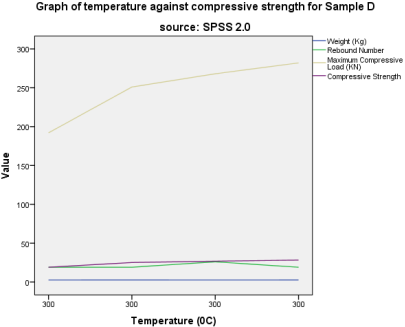
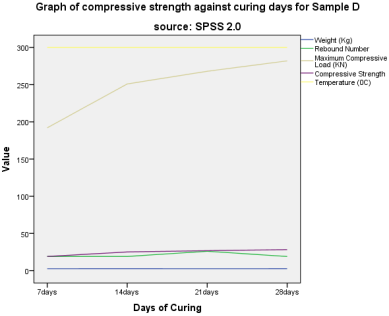
Table 6. Average compressive strength of Sample D.
Days of Curing | Temperature (°C) | Weight (Kg) | Rebound Number | Maximum Compressive Load (KN) | Compressive Strength (N/mm2) |
7 | 300 | 2.55 | 19 | 192 | 19.2 |
14 | 300 | 2.60 | 19 | 251 | 25.1 |
21 | 300 | 2.55 | 26 | 268 | 26.8 |
28 | 300 | 2.58 | 19 | 282 | 28.2 |
Figure 16. Diagram showing graph of temperature compressive strength for sample D.
This Figure presents the thermal performance of sample D in terms of compressive strength. As with the other samples, strength decreases with rising temperatures. The behavior of sample D is crucial for evaluating the effectiveness of its specific geosynthetic reinforcement under high temperatures. A flatter curve would indicate better thermal stability.
Figure 17. Diagram showing graph of compressive strength against curing days for sample D.
The development of compressive strength in sample D over time is shown. This graph allows for a direct comparison with samples A, B, and C to assess the impact of different geosynthetics on the rate of strength gain and ultimate strength.
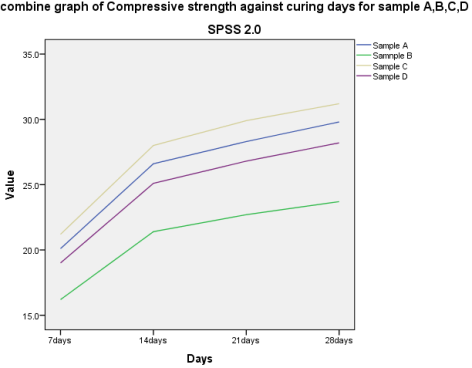
Figure 18. Diagram showing combine graph of compressive strength against curing days for sample A, B, C, and D.
This combined graph provides a comparative view of compressive strength development across all samples (A, B, C, and D) over the curing period. Differences in the slopes of the curves and the final strengths highlight the influence of the geotextile on hydration and reinforcement efficiency. For instance, sample C show superior early strength development, and excels in long-term strength in all the curing days in comparison to other samples.
3.3. Discussion Based on the Control Samples and the Elevated Temperature Samples
1. Significant Reduction in Mechanical Strength
The material exhibited a substantial decline in mechanical robustness when exposed to elevated temperatures. Control samples had a significant drop in flexural strength from 33.33 MPa to 20 MPa when tested for flexural strength after exposure to 600⁰C temperature (a 40% decrease). In contrast, the GRC samples tested under high-temperature of 600⁰C showed markedly reduced drop in flexural strength from 35.56 MPa at 25°C to 26.67 MPa (a 25% decrease).
This indicates a decline in thermal degradation of structural integrity which could be further reduced with a selection of a more suitable geosynthetic type and better application.
Observation of the compressive strength indicates that plain concrete (sample A and B) had a drop of compressive strength from 29.8 MPa at room temperature of 25°C to 23.7 MPa at 300°C (a 20.4% decrease). Geotextile reinforced concrete (sample C and D) had a drop of compressive strength from 31.2 MPa at room temperature of 25°C to 28.2 MPa at 300°C (a 9.6% decrease). Although there is thermal degradation of structural integrity in both samples at elevated temperature, it is less severe in the geotextile reinforced concrete samples. Also, the geotextile reinforced samples had a significantly higher compressive strength in contrast to the plain concrete samples.
2. Increased Ductility and Deformation
Elevated temperatures induced greater plasticity at the expense of stiffness. Strain-to-failure the deformation capacity before fracture surged from 5% in control samples to 15% in heat-exposed samples, reflecting a 200% increase in ductility. Concurrently, the elastic modulus (material stiffness) collapsed from 3.3 GPa to 1.8 GPa, a 49% reduction. This shift suggests molecular changes that enhanced flexibility but compromised load-bearing capacity.
3. Accelerated Degradation and Mass Loss
Thermal exposure drastically accelerated material breakdown. After 2 hours, mass loss escalated from 0.2% (control) to 2.1%—a 950% increase, signaling rapid evaporation or decomposition. Surface integrity also deteriorated: while control samples remained crack-free, heat-treated samples developed microcracks, providing pathways for further degradation.
4. Electrical Conductivity Changes
Resistivity measurements revealed significant change in electrical property. Volume resistivity dropped from 10¹⁵ Ω·cm (control) to 10¹2 Ω·cm under thermal stress a three-order-of-magnitude decline. This showed enhanced conductivity which was likely due to microstructural changes facilitating smoother electron flow.
5. Thermal Expansion Effects
The coefficient of thermal expansion (CTE) rose from 70 ppm/°C (control) to 95 ppm/°C after the thermal exposurea 36% increase. The heightened expansion implies greater dimensional instability under temperature variations, potentially affecting fit, function, and stress distribution. The drastic reduction in mechanical properties at 300°C indicates thermal degradation of the polymer matrix. This is typical of thermoplastics (e.g., polypropylene) approaching glass transition temperatures (TgT_gTg), where molecular chain mobility increases, reducing load-bearing capacity. Applications in high-temperature environments (e.g., automotive components) require reformulation with heat-stabilizing additives or alternative materials. The increased strain capacity and reduced stiffness confirm a transition from brittle to ductile behavior at 300°C. This aligns with polymer viscoelasticity theory, where elevated temperatures reduce intermolecular forces, allowing greater chain slippage under stress. While enhanced ductility may benefit impact resistance, it compromises dimensional stability in precision components.
Mass loss and microcracking suggest thermo-oxidative degradation, likely due to chain scission and volatile byproduct release. For long-term high-temperature use, antioxidants or inorganic fillers (e.g., silica) are recommended to inhibit oxidation pathways.
Reduced resistivity at 300°C is attributed to increased ion mobility and free volume in the polymer. This poses risks for insulating applications (e.g., cable jackets), necessitating ceramic-based coatings or cross-linking to maintain dielectric performance. Higher CTE exacerbates mismatches with adjacent materials (e.g., metals), risking delamination or warping. Design solutions include using low-expansion fillers (e.g., carbon fiber) or segmented structures to absorb stress.
Based on result, the decision to batch geosynthetic reinforcement alongside or instead of conventional steel is not just a substitution based on corrosion or economy. It fundamentally alters the structure's fire response profile. While offering advantages in corrosion resistance and ease of placement during batching, geosynthetics introduce a critical vulnerability threshold at low temperatures (300-600°C) due to polymer softening and degradation. Therefore, Batching is intrinsically linked to the thermal performance limitations. The convenience or specific functional benefit of geosynthetics during construction must be rigorously analyzed against their inherent thermal limitations in order to mitigate challenges to structural integrity and safety during and after fire events.
3.4. Flexural Strength Results
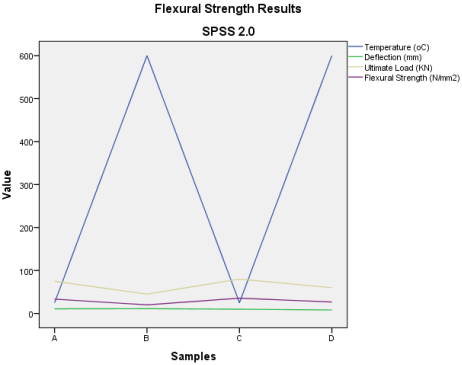
Figure 19. Diagram showing graph of flexural strength result.
Table 7. Flexural strength result.
Beam Sample | Temperature (°C) | Deflection (mm) | Ultimate Load (KN) | Flexural Strength (N/mm2) |
A | 25 | 10.8 | 75.00 | 33.33 |
B | 600 | 11.2 | 45.00 | 20.00 |
C | 25 | 9.9 | 80.00 | 35.56 |
D | 600 | 8.2 | 60.00 | 26.67 |
For one-point loading
Figure 19 compares the flexural strength of the Beam gropus (A, B, C, D). Flexural strength is critical for structural elements subjected to bending. The graph shows that geosynthetic reinforcement enhances flexural strength compared to control samples. Variations among the samples indicate the effectiveness of different geosynthetics in bridging cracks and improving tensile resistance.
4. Conclusion
This study successfully evaluated the influence of geosynthetic reinforcement on the mechanical properties and analyzed the durability/long-term performance of reinforced concrete beams under elevated temperature exposure, meeting its core objectives. The key findings are:
Concrete batching is a critical stage in construction, as it directly influences the quality, strength, and durability of the hardened material. Traditionally, concrete is batched using the conventional method, where the primary ingredients: cement, fine aggregate, coarse aggregate, water, and sometimes chemical admixtures are measured and mixed in specific proportions to achieve the desired workability and strength. In this conventional process, the reinforcement of concrete is primarily achieved through the placement of steel rebars or steel meshes after the batching and casting process. While this method has been widely adopted and proven effective, it also presents challenges such as susceptibility to corrosion of reinforcement, thermal incompatibility at elevated temperatures, and limited crack resistance under specific loading and environmental conditions.
This research show that concrete batching with geosynthetic reinforcement produced better strength than the conventional concrete batching method. Geosynthetic reinforcement significantly enhances mechanical performance under normal conditions. However, elevated temperatures, particularly approaching 80°C, drastically reduce key mechanical properties (stiffness, strength) due to thermal degradation of the polymer matrix (e.g., approaching Tg, increased chain mobility). This degradation shifts failure modes at high temperatures (e.g., 600°C) from flexural to combined shear/flexural, critically impacting structural behavior. The observed transition to ductile behavior at 80°C, while potentially beneficial for impact resistance, compromises load-bearing capacity and dimensional stability.
Abbreviations
CTE | Coefficient of Thermal Expansion |
NDT | Non Destructive Test |
kN | Kilo Newton |
Author Contributions
Akande Adeyemi: Data curation, Methodology
John Wasiu: Supervision
Ibrahim Abdulrazaq Olayinka: Validation
Conflicts of Interest
The authors declare that there is no conflicts of interest.
References
| [1] |
Annerel, E., & Taerwe, L. (2021). Fire Safety Journal, 123, 103361.
|
| [2] |
Aslani, F., & Samali, B. (2021). Construction and Building Materials, 283, 122730.
|
| [3] |
ASTM International. (2022). ASTM E119-22: Standard test methods for fire tests of building construction and materials. ASTM International.
|
| [4] |
ASTM International. (n.d.). ASTM C39: Standard test method for compressive strength of cylindrical concrete specimens. ASTM International.
|
| [5] |
ASTM International. (n.d.). ASTM C78/C78M: Standard test method for flexural strength of concrete (using simple beam with third-point loading). ASTM International.
|
| [6] |
ASTM International. (n.d.). ASTM C805: Standard test method for rebound number of hardened concrete. ASTM International.
|
| [7] |
Bisby, L. (2021). Fire Technology, 57(3), 1119–1150.
|
| [8] |
British Standards Institution. (2002). BS EN 1008: 2002: Mixing water for concrete — Specification for sampling, testing and assessing the suitability of water, including water recovered from processes in the concrete industry, as mixing water for concrete. BSI.
|
| [9] |
British Standards Institution. (2016). BS 4449: 2005 + A3: 2016: Steel for the reinforcement of concrete — Weldable reinforcing steel — Bar, coil and decoiled product — Specification. BSI.
|
| [10] |
British Standards Institution. (2017). BS EN 12620: 2013+A1: 2017: Aggregates for concrete. BSI.
|
| [11] |
British Standards Institution. (n.d.). BS EN 12390-3: Testing hardened concrete — Compressive strength of test specimens. BSI.
|
| [12] |
British Standards Institution. (n.d.). BS EN 12390-5: Testing hardened concrete — Flexural strength of test specimens. BSI.
|
| [13] |
Fib. (2022). Fire design of concrete structures. Federation international of Bulletine.
|
| [14] |
Jansson, R., & Boström, L. (2021). Fire Technology, 57(4), 1687–1712.
|
| [15] |
Kodur, V. (2023). Engineering Structures, 278, 115502.
|
Cite This Article
-
APA Style
Adeyemi, A., Wasiu, J., Olayinka, I. A., Enoguan, O. D. (2026). Influence of Geosynthetic Reinforcement on the Thermal and Structural Performance of Reinforced Concrete Beams. Journal of Civil, Construction and Environmental Engineering, 11(3), 105-118. https://doi.org/10.11648/j.jccee.20261103.15
 Copy
|
Copy
|
 Download
ACS Style
Adeyemi, A.; Wasiu, J.; Olayinka, I. A.; Enoguan, O. D. Influence of Geosynthetic Reinforcement on the Thermal and Structural Performance of Reinforced Concrete Beams. J. Civ. Constr. Environ. Eng. 2026, 11(3), 105-118. doi: 10.11648/j.jccee.20261103.15
Copy
|
Download
AMA Style
Adeyemi A, Wasiu J, Olayinka IA, Enoguan OD. Influence of Geosynthetic Reinforcement on the Thermal and Structural Performance of Reinforced Concrete Beams. J Civ Constr Environ Eng. 2026;11(3):105-118. doi: 10.11648/j.jccee.20261103.15
Copy
|
Download
-
@article{10.11648/j.jccee.20261103.15,
  author = {Akande Adeyemi and John Wasiu and Ibrahim Abdulrazaq Olayinka and Osegbowa Douglas Enoguan},
  title = {Influence of Geosynthetic Reinforcement on the Thermal and Structural Performance of Reinforced Concrete Beams},
  journal = {Journal of Civil, Construction and Environmental Engineering},
  volume = {11},
  number = {3},
  pages = {105-118},
  doi = {10.11648/j.jccee.20261103.15},
  url = {https://doi.org/10.11648/j.jccee.20261103.15},
  eprint = {https://article.sciencepublishinggroup.com/pdf/10.11648.j.jccee.20261103.15},
  abstract = {Concrete structures are frequently exposed to elevated temperatures during fire incidents, leading to significant degradation of mechanical and durability properties. This study experimentally investigates the thermo-mechanical performance of reinforced concrete beams incorporating geosynthetic reinforcement when subjected to elevated temperature exposure. Concrete cubes and reinforced beams, with and without embedded geotextile layers, were cast and tested under ambient conditions and after thermal exposure at temperatures up to 300°C for cubes and 600°C for beams. Both destructive and non-destructive tests, including compressive strength, rebound hammer, ultrasonic pulse velocity, and flexural strength tests, were conducted to evaluate residual mechanical performance. The results indicate that geosynthetic-reinforced concrete exhibited higher compressive and flexural strength retention compared to conventional reinforced concrete after thermal exposure. At 300°C, geotextile-reinforced concrete showed a compressive strength reduction of approximately 9.6%, compared to 20.4% for plain concrete. Similarly, flexural strength loss at 600°C was reduced from about 40% in control beams to 25% in geosynthetic-reinforced beams. Increased ductility and reduced stiffness were observed at elevated temperatures due to polymer softening and microstructural changes. Overall, the findings demonstrate that geosynthetic reinforcement can enhance post-fire mechanical performance of reinforced concrete members, although its thermal limitations must be carefully considered in fire-resistant structural design.},
 year = {2026}
}
Copy
|
Download
-
TY  - JOUR
T1  - Influence of Geosynthetic Reinforcement on the Thermal and Structural Performance of Reinforced Concrete Beams
AU  - Akande Adeyemi
AU  - John Wasiu
AU  - Ibrahim Abdulrazaq Olayinka
AU  - Osegbowa Douglas Enoguan
Y1  - 2026/06/23
PY  - 2026
N1  - https://doi.org/10.11648/j.jccee.20261103.15
DO  - 10.11648/j.jccee.20261103.15
T2  - Journal of Civil, Construction and Environmental Engineering
JF  - Journal of Civil, Construction and Environmental Engineering
JO  - Journal of Civil, Construction and Environmental Engineering
SP  - 105
EP  - 118
PB  - Science Publishing Group
SN  - 2637-3890
UR  - https://doi.org/10.11648/j.jccee.20261103.15
AB  - Concrete structures are frequently exposed to elevated temperatures during fire incidents, leading to significant degradation of mechanical and durability properties. This study experimentally investigates the thermo-mechanical performance of reinforced concrete beams incorporating geosynthetic reinforcement when subjected to elevated temperature exposure. Concrete cubes and reinforced beams, with and without embedded geotextile layers, were cast and tested under ambient conditions and after thermal exposure at temperatures up to 300°C for cubes and 600°C for beams. Both destructive and non-destructive tests, including compressive strength, rebound hammer, ultrasonic pulse velocity, and flexural strength tests, were conducted to evaluate residual mechanical performance. The results indicate that geosynthetic-reinforced concrete exhibited higher compressive and flexural strength retention compared to conventional reinforced concrete after thermal exposure. At 300°C, geotextile-reinforced concrete showed a compressive strength reduction of approximately 9.6%, compared to 20.4% for plain concrete. Similarly, flexural strength loss at 600°C was reduced from about 40% in control beams to 25% in geosynthetic-reinforced beams. Increased ductility and reduced stiffness were observed at elevated temperatures due to polymer softening and microstructural changes. Overall, the findings demonstrate that geosynthetic reinforcement can enhance post-fire mechanical performance of reinforced concrete members, although its thermal limitations must be carefully considered in fire-resistant structural design.
VL  - 11
IS  - 3
ER  -
Copy
|
Download