2. Materials and Methods
2.1. Study Area Description
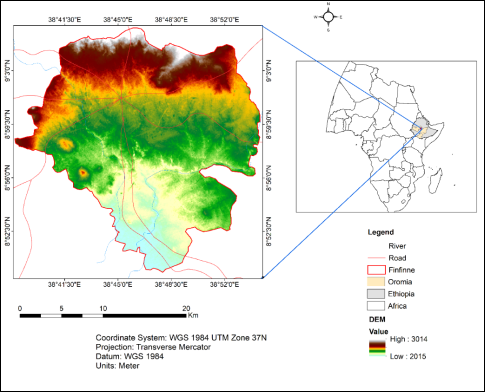
Finfinne, the capital city of Ethiopia & Oromia National Regional State, is located in the central highlands between 8°52’30’’–9°3’0’’ N and 38°41’30’’–38°52’0’’ E, covering about 521 km². The city lies at elevations ranging from 2,015 m in the south to over 3,014 m along the Entoto ridge in the north. It has a subtropical highland climate (Cwb) with mild temperatures (annual average 15–20°C) and seasonal rainfall totaling 1,000–1,200 mm, concentrated during June–September. Rapid urban expansion has transformed large areas of vegetation and farmland into built-up surfaces, intensifying environmental challenges such as land-use change, reduced green space, and urban heat island effects. Administratively, Finfinne consists of 11 sub-cities, with dense development in the core and more mixed land uses toward the periphery.
Figure 1. Locational Map of Finfinne.
2.2. Data Sources
Table 1. Data Sources used in the Study.
Data Type | Dataset / Source | Year(s) | Spatial/Temporal Resolution | Purpose / Application |
Satellite Imagery | Landsat 5 TM | 1995 | 30 m (VNIR/SWIR), 120 m (Thermal) | LULC classification, LST extraction, UHI analysis & intensification evaluation |
Landsat 7 ETM+ | 2005 | 30 m (VNIR/SWIR), 60 m (Thermal) |
Landsat 8 OLI/TIRS | 2015 | 30 m (Bands), 100 m (Thermal) |
Landsat 9 OLI/TIRS | 2025 | 30 m (Bands), 100 m (Thermal) |
Ancillary Spatial Data | Administrative Boundaries (CSA) | — | Vector | Masking, zonal analysis |
Google Earth Imagery | 1995–2025 | <1 m | Ground truthing for accuracy assessment |
Reference Data |
Population Data | CSA Population Data | 1995–2025 | Annual/census | Urban growth analysis |
2.3. Analytical Tools and Software Used
This study used analytical tools (well-known geospatial and remote sensing software). Image preprocessing, supervised LULC classification, raster analysis, change detection, zonal statistics, and map creation were all done with ArcGIS. Landsat data gap masking for Landsat 7 ETM+ of 2005, visualization, vector editing, and cartographic refining were all done using QGIS. Remote sensing capabilities within ArcGIS were used for radiometric calibration, atmospheric correction, NDVI computation, emissivity estimation, and LST retrieval. Microsoft Excel was utilized for statistical analysis and table and graph production, while Google Earth Pro facilitated the gathering of training samples and accuracy assessment. When taken collectively, these technologies made it possible to do multi-temporal LULC, LST, UHI, and UTFVI analysis in Finfinne in a consistent and reliable manner.
2.4. Image Preprocessing
To ensure radiometric consistency, spatial accuracy, and temporal comparability among sensors, a standard procedure was applied to all Landsat images (TM, ETM+, OLI/TIRS) obtained for 1995, 2005, 2015, and 2025. The selected years of 1995, 2005, 2015, and 2025 correspond to key milestones in Landsat satellite missions, providing a structured timeline for analyzing urban development and land use changes. Data from these periods, collected via Landsat 5, 7, 8, and 9 satellites, enable consistent comparisons over time. The earlier data (1995), spanning approximately a decade apart, captures significant phases of urban growth, while the 2025 data offers an up-to-date, precise view of Finfinne's current urban landscape. This temporal framework facilitates long-term trend analysis, supports urban planning, and enhances understanding of city expansion patterns. The inclusion of recent high-quality images from Landsat 9 ensures that analyses are based on current, reliable data, helping researchers and planners make informed decisions about future development trajectories. In accordance with USGS guidelines, radiometric correction was carried out using absolute calibration, converting digital numbers (DN) to top-of-atmosphere (TOA) radiance and reflectance using sensor-specific rescaling coefficients derived from the metadata files (MTL.txt)
| [4] | Chander, G., & Markham, B. (2003). Revised Landsat radiometric calibration procedures and postcalibration dynamic ranges. IEEE Transactions on Geoscience and Remote Sensing, 41(11), 2674–2677.
https://doi.org/10.1109/TGRS.2003.818464 |
| [32] | Voogt, J. A., & Oke, T. R. (2003). Thermal remote sensing of urban climates. Remote Sensing of Environment, 86(3), 370–384. https://doi.org/10.1016/S0034-4257(03)00079-8 |
[4, 32]
. This stage reduced inter-sensor variability, illumination variations, and sensor noise.
A metadata-based correction method in line with long-term multi-temporal analysis was used to lessen atmospheric effects for reflecting bands
| [12] | Jiménez-Muñoz, J. C., & Sobrino, J. A. (2003). A generalized single‐channel method for retrieving land surface temperature from remote sensing data. Journal of Geophysical Research: Atmospheres, 108(D22), 4688.
https://doi.org/10.1029/2003JD003480 |
[12]
. When retrieving LST, thermal bands were radiometrically calibrated and then adjusted for surface emissivity using an NDVI-based emissivity model
| [13] | Landis, J. R., & Koch, G. G. (1977). The measurement of observer agreement for categorical data. Biometrics, 33(1), 159–174. https://doi.org/10.2307/2529310 |
[13]
.
Each scene was acquired as a Level-1 Terrain-Corrected (L1T) product, which corrects geometric distortions using digital elevation models, ground control points, and sensor geometry
. There was no need for further geometric adjustment because the image was supplied in UTM projection (WGS 84, Zone 37N). Administrative boundaries and high-resolution Google Earth images were used to validate sub-pixel precision in spatial alignment. The Landsat Quality Assessment (QA) bands were used to mask clouds and cloud shadows in order to remove polluted pixels that can skew LST calculations and classification. After that, every image was clipped to the boundary of Finfinne City. To guarantee spatial consistency with multispectral data, thermal bands were resampled to 30 m using nearest-neighbor interpolation.
Multispectral images were improved using linear contrast stretching and histogram equalization for visual interpretation and training sample selection; thermal bands used for quantitative analysis were not enhanced in order to maintain radiometric integrity
| [16] | Liu, L., & Zhang, Y. (2011). Urban heat island analysis using the landsat TM data and ASTER Data: a case study in Hong Kong. Remote Sensing, 3(7), 1535–1552.
https://doi.org/10.3390/rs3071535 |
[16]
. To guarantee methodological consistency and reproducibility, all preprocessing procedures were carried out in ArcGIS (Spatial Analyst) and QGIS using the same parameters for every year.
2.5. LULC Classification
A pixel-based supervised classification approach was used to classify LULC in multi-temporal Landsat images from 1995, 2005, 2015, and 2025. Because of its strong statistical foundation and ability to integrate class variance and covariance data, the MLC algorithm was used, which makes it appropriate for diverse urban and peri-urban environments
| [5] | Chen, X., et al. (2020). Maximum likelihood image classification in heterogeneous landscapes. Remote Sensing Applications. (Details not provided in manuscript; kept as included).
https://doi.org/10.15446/esrj.v24n3.89750 |
| [12] | Jiménez-Muñoz, J. C., & Sobrino, J. A. (2003). A generalized single‐channel method for retrieving land surface temperature from remote sensing data. Journal of Geophysical Research: Atmospheres, 108(D22), 4688.
https://doi.org/10.1029/2003JD003480 |
| [14] | Lillesand, T., Kiefer, R. W., & Chipman, J. (2015). Remote sensing and image interpretation (7th ed.). Wiley.
https://doi.org/10.14358/PERS.81.8.615 |
| [16] | Liu, L., & Zhang, Y. (2011). Urban heat island analysis using the landsat TM data and ASTER Data: a case study in Hong Kong. Remote Sensing, 3(7), 1535–1552.
https://doi.org/10.3390/rs3071535 |
[5, 12, 14, 16]
. Based on Bayesian decision theory, the classifier assigns each pixel to the class with the highest prior probability, assuming a normal distribution of spectral values within each land-cover class.
The study area's characteristics led to the classification of five prominent LULC classes: built-up areas, croplands, forest lands, other lands (such as grasslands, bare land, and shrublands), and water bodies. Using a combination of high-resolution Google Earth data, expert knowledge of local land-cover features, and visual interpretation of Landsat false-color composites, training samples were independently gathered for each study year. In order to capture within-class spectral diversity and guarantee sufficient representation of all LULC classes throughout the study area, a stratified random sampling method was used
. To lessen classification bias, training data were digitized as regions of interest (ROIs), and sample sizes were kept as evenly distributed across classes as feasible. Since the Landsat 9 image gives us new information (recent LULC visual appearance) with modified visibility compared to the other Landsat series utilized in this study, a total of 100 GCP (ground control points) were gathered for validation of the classified LULC using the image as a reference. With the exception of water land, which only collected eight GCPs due to its smaller area, 23 GCPs were gathered for each class.
To guarantee independent accuracy evaluation, the training and validation datasets were kept apart. Thirty percent of the samples were reserved for validation, while the remaining seventy percent were used for classifier training. The classification procedure did not make use of validation samples. In accordance with typical remote sensing accuracy assessment procedures, classification accuracy was assessed using error (confusion) matrices created by comparing classified LULC maps with reference data
. The confusion matrices were used to calculate standard accuracy metrics, such as the kappa coefficient, producer's accuracy, user's accuracy, and overall accuracy. While the user's accuracy measured commission errors, the producer's accuracy was used to evaluate omission errors. The kappa coefficient was computed to account for agreement that happened by chance, and overall accuracy offered a summary measure of classification correctness
| [7] | Congalton, R. G., & Green, K. (2019). Assessing the accuracy of remotely sensed data: Principles and practices (3rd ed.). CRC Press. https://doi.org/10.1201/9780429052729 |
| [15] | Liu, H., & Weng, Q. (2012). Enhancing temporal resolution of satellite imagery for public health studies: A case study of West Nile Virus outbreak in Los Angeles in 2007. Remote Sensing of Environment, 117, 57–71. https://doi.org/10.1016/j.rse.2011.06.023 |
[7, 15]
.
The confusion matrices were used to calculate standard accuracy metrics such as the kappa coefficient, producer's accuracy, user's accuracy, and total accuracy. While commission mistakes were measured using user accuracy, omission errors were evaluated using producer accuracy. The kappa coefficient was computed to account for agreement that occurred by chance, and overall accuracy served as a summary measure of classification correctness
| [7] | Congalton, R. G., & Green, K. (2019). Assessing the accuracy of remotely sensed data: Principles and practices (3rd ed.). CRC Press. https://doi.org/10.1201/9780429052729 |
| [15] | Liu, H., & Weng, Q. (2012). Enhancing temporal resolution of satellite imagery for public health studies: A case study of West Nile Virus outbreak in Los Angeles in 2007. Remote Sensing of Environment, 117, 57–71. https://doi.org/10.1016/j.rse.2011.06.023 |
[7, 15]
.
We evaluated the accuracy of the classified LULC maps using independently collected validation samples following established remote sensing accuracy assessment procedures
. Confusion matrices were generated for each study year to quantify classification performance, and standard accuracy measures were computed, including overall accuracy, producer’s accuracy, user’s accuracy, and the Kappa coefficient.
In addition to evaluating overall performance, class-specific accuracy was examined to identify sources of potential misclassification. Built-up areas generally exhibited clearer spectral separability, whereas croplands and mixed land categories were more prone to spectral confusion, particularly within transitional urban–rural zones. These steps ensured that the final LULC maps achieved sufficient thematic reliability to support subsequent analyses of multi-decadal LULC dynamics, LST variability, and UHI intensity.
Let the error matrix contain:
: number of samples observed in class and classified as class
: total number of samples
: row total for class
: column total for class
Producer’s Accuracy (PA)
User’s Accuracy (UA)
Kappa Coefficient
2.6. Change Detection
We performed change detection using the post-classification comparison approach, a reliable method for multi-temporal analysis that minimizes issues from sensor or date-specific radiometric differences by classifying each date independently before comparison
| [27] | Srivastava, P. K., Majumdar, T. J., & Bhattacharya, A. K. (2010). Study of land surface temperature and spectral emissivity using multi-sensor satellite data. Journal of Earth System Science, 119(1), 67–74.
https://doi.org/10.1007/s12040-010-0002-0 |
[27]
. First, we classified Landsat imagery from each study year: 1995 (Landsat 5 TM), 2005 (Landsat 7 ETM+), 2015 (Landsat 8 OLI/TIRS), and 2025 (Landsat 9 OLI-2/TIRS-2) independently. Then, we conducted a pixel-by-pixel comparison across four intervals: 1995–2005, 2005–2015, 2015–2025, and the full 1995–2025 period.
To map the specific pathways of change of how forest became cropland, or where built-up areas replaced other lands, we built detailed transition matrices. This standard approach gave us a clear ledger of every conversion between our five key classes: forest, built-up, cropland, other lands, and water bodies.
From these matrices, the major storylines of the landscape emerged. We could identify which transitions dominated, calculate net gains and losses, and spot evolving spatial patterns over the thirty-year span. This detailed accounting of what changed to what became the essential foundation for all subsequent analysis of Finfinne's dynamic landscape.
2.7. Land Surface Temperature Retrieval
For each of the four study years (1995, 2005, 2015, and 2025), LST was obtained using a standard multi-step procedure that ensures comparability between sensors. The workflow integrates radiometric calibration, thermal conversion, atmospheric correction, and emissivity adjustment derived from surface biophysical properties. For each scene, the red, near-infrared, and thermal bands were used: Band 3 (RED) and Band 4 (NIR) for Landsat 5 TM and Landsat 7 ETM+; Band 4 (RED) and Band 5 (NIR) for Landsat 8 and 9. The corresponding thermal bands were Band 6 for Landsat 5 and 7 and Band 10 for Landsat 8 and 9. Metadata (MTL.txt) was used to extract radiometric rescaling coefficients and thermal constants. The key retrieval steps are described below.
2.7.1. Conversion of Digital Numbers to Top-of-Atmosphere Radiance
Thermal bands from Landsat sensors were first converted from DN to TOA spectral radiance. The radiometric calibration equation provided in the metadata was applied
| [26] | Sobrino, J. A., Jiménez-Muñoz, J. C., & Paolini, L. (2004). Land surface emissivity retrieval from Landsat data. Remote Sensing of Environment, 90(4), 434–440.
https://doi.org/10.1016/j.rse.2004.02.003 |
[26]
:
For Landsat 8/9 TIRS, the radiance conversion uses:
where ML and AL represent radiance multiplicative and additive rescaling factors.
Rescaling factors varied by sensor: Landsat 5 TM (Band 6): ML and AL provided in MTL metadata. Landsat 7 ETM+ (Band 6): ML and AL provided in metadata.
Landsat 8 (Band 10): Lλ = 0.0003342 × B10 + 0.1. Landsat 9 (Band 10): Lλ = 0.00038 × B10 + 0.1
2.7.2. Conversion of TOA Radiance to Brightness Temperature
Radiance values were then converted into at-sensor brightness temperature using the inverse Planck function using the following formula
| [24] | Sekertekin, A., & Bonafoni, S. (2020). Land surface temperature retrieval from Landsat 5, 7, and 8 over rural areas: Assessment of different retrieval algorithms and emissivity models and toolbox implementation. Remote Sensing, 12(2), 294.
https://doi.org/10.3390/rs12020294 |
[24]
:
where
K₁ and K₂ are thermal calibration constants specific to each Landsat sensor. Brightness temperature represents the blackbody temperature and must be corrected for surface emissivity.
Thermal constants used: Landsat 5 TM Band 6: K1 = 607.76; K2 = 1260.56, Landsat 7 ETM+ Band 6: K1 = 666.09; K2 = 1282.71, Landsat 8 Band 10: K1 = 774.8853; K2 = 1321.0789, Landsat 9 Band 10: K1 = 799.0284; K2 = 1329.2405.
2.7.3. NDVI Computation
NDVI for all four Landsat missions was computed as follows using the formula as used by
| [17] | Mallick, J. (2014). Land characterization analysis of surface temperature of semi-arid mountainous City Abha, Saudi Arabia Using Remote Sensing and GIS. Journal of Geographic Information System. https://doi.org/10.4236/jgis.2014.66055 |
| [18] | Moisa, Y., & Gemeda, D. (2022). Land use/cover dynamics and urban heat island effects in Addis Ababa. (Cited in discussion; details not provided).
https://doi.org/10.1007/s10661-022-10414 |
| [19] | Mugiraneza, T., Haas, J., & Ban, Y. (2017). Spatio-temporal analysis of urban land cover changes in Kigali, Rwanda. ISPRS Archives, XLII-4/W2, 115–122.
https://doi.org/10.5194/isprs-archives-XLII-3-W2-137-2017 |
[17-19]
:
Where: Band 3 (RED) and Band 4 (NIR) for Landsat 5 TM and Landsat 7 ETM+;
Band 4 (RED) and Band 5 (NIR) for Landsat 8 and 9 OLI/TIRS
2.7.4. Proportion of Vegetation (PV)
PV, also known as the Fractional Vegetation Cover (FVC), quantifies the proportion of vegetation present within a pixel. Improve LST retrieval by accounting for emissivity differences. It ranges from 0 to 1, where PV = 0 → bare soil, and PV = 1 → full vegetation cover. PV is derived from the spectral characteristics of vegetation using NDVI. PV was obtained using
| [3] | Carlson, T. N., & Ripley, D. A. (1997). On the relation between NDVI, fractional vegetation cover, and leaf area index. Remote Sensing of Environment, 62(3), 241–252.
https://doi.org/10.1016/S0034-4257(97)00104-1 |
| [8] | Demisse, S., Hishe, S., & Getahun, K. (2024). LULC dynamics and the effects of urban green spaces in cooling and mitigating microclimate change and urban heat island effects: A case study in Addis Ababa City, Ethiopia. Water and Climate Change. https://doi.org/10.2166/wcc.2024.662 |
[3, 8]
:
Where:
1) = NDVI value of bare soil
2) = NDVI value of dense vegetation
The square improves the separation between low- and high-vegetation areas and follows the model of
.
2.7.5. Land Surface Emissivity (LSE)
LSE measures how efficiently a surface emits thermal radiation relative to an ideal blackbody at the same temperature. It is a unitless parameter with a range of 0 to 1, where ε < 1.0 → real surfaces, which release less energy, and ε = 1.0 → perfect blackbody emitter. Because thermal radiance recorded by sensors depends on both temperature and emissivity, LSE directly affects the accuracy of LST estimation. The percentage of vegetation (PV) is used to calculate emissivity (ε).
| [6] | Chibuike, E. M., Ibukun, A. O., Kunda, J. J., & Abbas, A. (2018). Assessment of green parks cooling effects on Abuja urban microclimate using geospatial techniques. Remote Sensing Applications: Society and Environment, 11, 11–21.
https://www.sciencedirect.com/science/article/pii/S2352938518301046 |
| [28] | Tadesse, T., & Mamo, B. (2024). Urban land use, land cover change, and urban microclimate dynamics in Finfinne, Ethiopia. Discover Environment, 2, 71.
https://doi.org/10.21203/rs.3.rs-4360064/v1 |
[6, 28]
first suggested this approach.
2.7.6. Final LST Generation and Unit Conversion
LST was estimated from TB and emissivity using the following formula as proposed by
| [25] | Singh, P., Kikon, N., & Verma, P. (2017). Impact of land use change and urbanization on urban heat island in Lucknow city, Central India. A remote sensing-based estimate. Sustainable Cities and Society, 32, 100–114.
https://doi.org/10.1016/j.scs.2017.02.018 |
| [29] | Tesfamariam, S., Govindu, V., & Uncha, A. (2023). Spatio-temporal analysis of urban heat island and its effect on urban ecology: The case of Mekelle City, Ethiopia. Heliyon, 9(2), e13098. https://doi.org/10.1016/j.heliyon.2023.e13098 |
[25, 29]
:
LST = TB / (1 + ((λ × TB) / ρ) × ln(ε))
Constants:
1) Effective wavelengths: Landsat 5/7 Band 6 ≈ 11.45 µm; Landsat 8/9 Band 10 ≈ 10.9 µm
2) ρ = 1.4388 × 10⁻² m·K
Final LST values were converted from Kelvin to Celsius using the formula:
LST(°C) =LST(K) −273.15
Where: LST(°C) = LST in degree Celsius, and LST(K) = LST in degree kelvin.
Outputs were resampled to 30 m spatial resolution to allow consistent temporal comparison of LULC-LST-UHI-UTFVI dynamics across the three decades.
2.8. UHI Computation
Surface UHI intensity was quantified to evaluate the thermal contrast between the rapidly urbanizing built-up areas of Finfinne and its surrounding rural/peri-urban regions. UHI was computed using spatially explicit LST outputs derived for each study year.
2.8.1. Definition of Urban and Rural Reference Zones
Urban and rural boundary delineation was based on classified LULC maps: Urban zones: Pixels classified as built-up (residential, commercial, industrial, transportation, and impervious surfaces).
Rural reference zones: Pixels classified as cropland, forest land, water bodies, and other non-urban natural/green surfaces located outside the urban core. In order to avoid thermal bias, rural areas were chosen from regions with reasonably uniform land cover and low anthropogenic disturbance.
2.8.2. Urban Heat Island (UHI) Intensity
The difference between the mean LST of urban and rural reference areas was used to calculate SUHI intensity
| [1] | Abutaleb, K. A. A., Ngie, A., Darwish, A., Ahmed, M. H., Arafat, S. M., Ahmed, F., 2015. Assessment of urban heat island using remote sensed imagery over greater Cairo Egypt. Adv. Rem. Sens. 4, 35–47. https://doi.org/10.4236/ars.2015.41004 |
[1]
:
Where:
= Mean LST of all built-up pixels
= Mean LST of selected rural reference pixels
In order to investigate temporal UHI amplification under accelerating land conversion and climatic warming, the equation was used for each research year (1995, 2005, 2015, and 2025).
2.8.3. Statistical Analysis of UHI Trends
Several metrics were computed: mean UHI intensity (°C), maximum UHI intensity (°C), standard deviation of UHI distribution, rate of UHI change (°C/decade), and correlation between UHI intensity and built-up expansion.
2.9. Urban Thermal Field Variance Index (UTFVI)
Urban thermal stress and ecological quality were evaluated using the UTFVI, which quantifies the deviation of pixel-level LST from the mean surface temperature of the study area
| [11] | Jensen, J. R. (2016). Remote sensing of the environment: An Earth resource perspective (2nd ed.). Pearson. |
| [18] | Moisa, Y., & Gemeda, D. (2022). Land use/cover dynamics and urban heat island effects in Addis Ababa. (Cited in discussion; details not provided).
https://doi.org/10.1007/s10661-022-10414 |
| [35] | Weng, Q., Sauvage, S., & Gong, P. (2019). Spatial analysis of surface urban heat islands in four rapidly growing African cities. Remote Sensing, 11(14), 1645.
https://doi.org/10.3390/rs11141645 |
[11, 18, 35]
. The UTFVI was computed for each study year using:
where is the LST of individual pixel and is the mean LST of the entire study area.
The resulting UTFVI values were classified into predefined ecological evaluation categories ranging from excellent to worst thermal conditions, showing increasing levels of thermal stress and environmental degradation. This classification allowed spatial identification of thermally stressed zones across the city. UTFVI maps were produced for all study years to detect the spatio-temporal progress of urban thermal conditions and to relate these patterns to observed LULC changes.
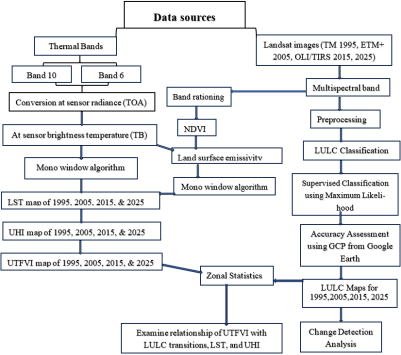
Figure 2. Methodological Flow Chart of the study.
3. Results
3.1. Dynamics of LULC (1995–2025)
The result of LULC analysis showed significant changes over the 30-year study period from 1995 to 2025.
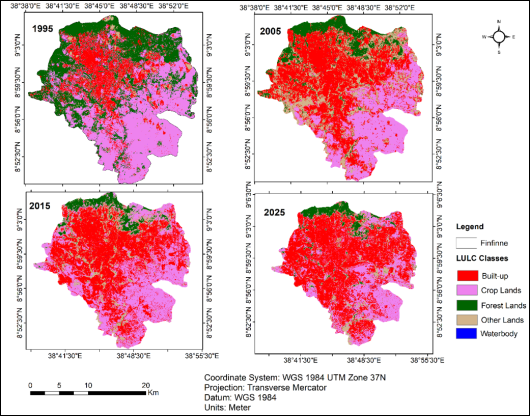
Figure 3 below shows the spatial distribution of LULC types for the four study periods. The associated
Table 2 reviews the area (ha) and percentage (%) of each LULC class, indicating temporal trends and facilitating comparison among intervals (1995–2005, 2005–2015, 2015–2025).
Figure 3. LULC Map of 1995, 2005, 2015, & 2025.
Table 2. LULC Types with their aerial distributions.
LU/LC Types | 1995 | 2005 | 2015 | 2025 |
Area (ha) | Area (%) | Area (ha) | Area (%) | Area (ha) | Area (%) | Area (ha) | Area (%) |
Built-up | 10106 | 19.4 | 22384 | 42.9 | 23896 | 45.9 | 28780 | 55.2 |
Croplands | 24021 | 46.1 | 14275 | 27.4 | 19641 | 37.7 | 15260 | 29.3 |
Forest Lands | 2148 | 4.1 | 4969 | 9.53 | 3002 | 5.8 | 3041 | 5.8 |
Other Lands | 15717 | 30.2 | 10525 | 20.2 | 5507 | 10.6 | 4955 | 9.5 |
Waterbody | 112 | 0.23 | 117 | 0.1 | 58 | 0.1 | 116 | 0.1 |
Total | 52104 | 100 | 52104 | 100 | 52104 | 100 | 52104 | 100 |
The LULC statistics presented in
Table 2 demonstrate a clear and consistent change of the landscape over the 30-year period between 1995 and 2025. The results indicate that Finfinne has experienced rapid and widespread urbanization, which has significantly reshaped the spatial distribution of all major land-cover types. Built-up land exhibits the most dramatic increase, expanding from 10,106 ha (19.4%) in 1995 to 28,780 ha (55.2%) in 2025 (
Figure 3,
Table 2). This more than twofold increase reflects the city’s accelerating urban growth, driven by population pressure, housing demand, infrastructure development, and economic activities. The most rapid expansion occurred between 1995 and 2005, when built-up area more than doubled, marking the period of most intense urban sprawl.
Cultivated land diminished from 46.1% of the total area in 1995 to 27.4% in 2005, showing how productive agricultural land became urban settlements. Curiously, farmland grew to 37.7% in 2015, likely due to peri-urban farming and including vegetated sections. But croplands dropped again to 29.3% by 2025, suggesting continued pressure from urban expansion. These changes show that land use is constantly changing in the peri-urban fringes, with farms regularly turning into homes and businesses.
Forest land exhibits a shifting trend. From 1995 to 2005, forest cover grew from 2,148 hectares to 4,969 hectares, which may reflect improved classification accuracy due to the better spectral resolution of Landsat 7 ETM+. But forest land shrank again in 2015 and stayed fairly constant until 2025, making up roughly 5.8% of the area. This decline after 2005 points to ongoing urban growth into green spaces and the loss of natural forest sections near the city.
One striking/notable pattern is the sharp drop in other lands, which cover open areas, bare soil, bushes, and grasslands. This category of land shrank from 15,717 hectares (30.2%) in 1995 to just 4,955 hectares (9.5%) by 2025 (
Table 2). This more than two-thirds decrease in this land type shows that open spaces and natural plant life, not forests, have been steadily turned into farmland or developed areas over the decades. Their reduction points to a decrease in ecological transition zones and natural surfaces that usually help regulate the local urban climate.
Water bodies consistently make up the smallest proportion of the area examined, never exceeding 0.3% over the study period. While there are minor fluctuations, such as 120 hectares in 1995 reducing to 117 hectares in 2005 and then a slow decrease to 116 hectares by 2025, these changes are small. These variations probably stem from seasonal shifts in water levels, the dimensions of any new ponds, or how precisely we can classify narrow river systems.
Table 2 shows a clear pattern: natural and farm lands are becoming more and more developed. The city keeps growing outwards, shrinking croplands, forests, and open spaces. This change impacts how sustainable the environment is, how heat behaves in the city, and the benefits we get from ecosystems. As more areas get paved over, it explains why land surface temperatures go up and why urban heat islands get stronger, as we discuss later in this paper.
3.2. Accuracy Assessment of LULC Classification Results (1995–2025)
Table 3. Error matrix Table for 1995.
Classified Data | Reference Data |
Croplands | Forest Lands | Other Lands | Waterbody | Built-up | Raw Total |
Croplands | 93.43 | 1.03 | 13.64 | 0 | 8.12 | 116.22 |
Forest Lands | 3.22 | 97.34 | 61.36 | 0 | 0.77 | 162.69 |
Other Lands | 0.41 | 0.87 | 17.74 | 0 | 2.99 | 22.01 |
Waterbody | 0.12 | 0.01 | 0.18 | 100 | 0.06 | 100.37 |
Built-up | 2.81 | 0.76 | 7.08 | 0 | 88.06 | 98.71 |
Column Total | 100 | 100 | 100 | 100 | 100 | |
Table 4. Error matrix Table for 2005.
Classified Data | Reference Data |
Built-up | Forest Lands | Other Lands | Croplands | Waterbody | Row Total |
Built-up | 90.78 | 1.27 | 1.6 | 3.9 | 0 | 97.55 |
Forest Lands | 0.02 | 96.59 | 1.98 | 0.04 | 0 | 98.63 |
Other Lands | 4.46 | 2.14 | 94.78 | 1.32 | 0 | 102.7 |
Croplands | 4.73 | 0 | 1.64 | 94.48 | 0 | 100.85 |
Waterbody | 0.01 | 0 | 0 | 0.25 | 100 | 100.26 |
Column Total | 100 | 100 | 100 | 100 | 100 | |
Table 5. Error matrix Table for 2015.
Classified Data | Reference Data |
Built-up | Forest Lands | Other Lands | Croplands | Waterbody | Row Total |
Built-up | 86.85 | 0 | 1.03 | 5.8 | 0 | 93.68 |
Forest Lands | 0 | 97.67 | 2.27 | 0.03 | 0 | 99.97 |
Other Lands | 1.19 | 2.05 | 93.88 | 1.45 | 0 | 98.57 |
Croplands | 11.76 | 0.29 | 2.82 | 92.68 | 0 | 107.55 |
Waterbody | 0.2 | 0 | 0 | 0.03 | 100 | 100.23 |
Column Total | 100 | 100 | 100 | 100 | 100 | |
Table 6. Error matrix Table for 2025.
Classified Data | Reference Data |
Built-up | Forest Lands | Croplands | Other Lands | Waterbody | Row Total |
Built-up | 87.26 | 0.21 | 4.51 | 2.12 | 0.1 | 94.2 |
Forest Lands | 0.02 | 95.76 | 1.03 | 2.18 | 0 | 98.99 |
Croplands | 11.53 | 0.44 | 90.15 | 21.44 | 0 | 123.56 |
Other Lands | 1.14 | 3.59 | 4.12 | 74.26 | 0.7 | 83.81 |
Waterbody | 0.05 | 0 | 0.2 | 0 | 99.2 | 99.45 |
Column Total | 100 | 100 | 100 | 100 | 100 | |
Tables 3-6 show the confusion matrices generated for the classified LULC for 1995, 2005, 2015, and 2025. These matrices give us a good look at how reliable each year's classification was. To do this, we compared our classified maps with what we knew to be accurate on the ground. For every year, the classifications were very accurate, meaning there was a close match between what our maps showed and the actual land cover data.
In 1995, the error matrix shows that water bodies, croplands, and forest lands were classified with relatively high accuracy, where 100%, 93.43%, and 97.34% of reference pixels, respectively, were correctly identified. Built-up areas also achieved strong accuracy (88.06%), although a noticeable level of confusion occurred between croplands, forest lands, and built-up areas, reflecting the spectral similarity of mixed edges and transitional zones typical of peri-urban areas in earlier decades. “Other lands,” which include bare soil and shrubland, show moderate accuracy, with 17.74% correct classification; this lower accuracy is expected due to wide spectral variability within the category.
By 2005, all classes' classification accuracy had greatly increased. Forest lands had a near-perfect accuracy of 96.59%, whereas built-up areas scored 90.78% right classification. "Other lands" achieved 94.78%, suggesting better spectrum separability, which was probably made possible by the Landsat 7 ETM+ sensor's enhanced radiometric capabilities in 2005. Waterbodies' unique spectral signature was reflected in their continuously excellent accuracy (100%). For this time period, stronger land-cover discrimination is demonstrated by the decreased confusion between classes.
Similar high accuracy levels can be seen in the 2015 error matrix. The mapping accuracy for forest lands was 97.67%, compared to 93.88% for other lands and 86.85% for built-up classes. Although some crop pixels were incorrectly assigned to built-up areas (11.76%), croplands also have a high classification rate (92.68%). This can be attributed to mixed pixels in agricultural zones at the city's periphery and seasonal vegetation changes.
The confusion matrix again shows strong classification performance in 2025. Built-up areas are 87.26%, water bodies are 99.2%, and forest lands are still quite accurate at 95.76%. Croplands (90.15%) exhibit a similar pattern to prior years; however, there is some misclassification into "other lands," which reflects the transitional and varied nature of agricultural plots under growing urban pressure. Specifically, due to the category's decreased spatial extent and greater fragmentation, which makes spectral difference more difficult, other lands earned 74.26% accuracy, which is lower than in previous years.
The LULC categories are generally dependable and appropriate for long-term landscape change analysis, according to the confusion matrices from 1995 to 2025. The small off-diagonal values show little class confusion, while the consistently high diagonal values throughout all year’s show substantial agreement between classified and reference data. The advances in sensor technology from Landsat 5 TM to Landsat 9 OLI, which led to improved land-cover category discrimination, are also reflected in the improvements seen over time. These accuracy levels give assurance for further investigations, such as assessments of urban heat islands, land surface temperature characterization, and LULC change detection.
Table 7. Accuracy Assessment report for 1995, 2005, 2015 & 2025.
LULC Classes | 1995 | 2005 | 2015 | 2025 |
UA | PA | UA | PA | UA | PA | UA | PA |
Croplands | 80.87% | 94.90% | 94.74% | 91.84% | 87.62% | 93.88% | 73.77% | 90.91% |
Forest Lands | 60.25% | 98.98% | 98.97% | 96.97% | 97.98% | 97.98% | 96.94% | 96.94% |
Other Lands | 89.48% | 17.35% | 93.07% | 96.91% | 95.876% | 94.90% | 90.24% | 74.75% |
Waterbody | 100% | 100% | 94.95% | 95.92% | 100% | 100% | 100% | 100% |
Built-up | 90.72% | 89.80% | 100% | 100% | 93.48% | 87.76% | 93.55% | 87.88% |
Overall accuracy | 80.29% | 96.34% | 94.93% | 90.08% |
Kappa | 0.75 | 0.95 | 0.94 | 0.88 |
Note: PA = Producer Accuracy, UA = User Accuracy |
The classification accuracy of LULC maps for 1995, 2005, 2015, and 2025 is compiled in
Table 7. Strong user and producer accuracy, high overall accuracy, and significant kappa statistics ranging from 0.75 to 0.95 all corroborate the results, which show a high degree of theme reliability throughout all years. As urbanization increased, sensor capacities improved and land-cover class separability increased, as seen by the accuracy's temporal evolution.
With a kappa coefficient of 0.75 and an overall accuracy of 80.29% in 1995, the classified outputs and reference data showed strong agreement. Due to spectral similarities with other plants, forest lands had poorer user accuracy (60.25%) but excellent producer accuracy (98.98%) compared to croplands (94.90%) (
Table 7). While built-up areas showed strong reliability (PA 89.80%), water bodies were perfectly classified (100% for both producer and user) (
Table 7).
By 2005, classification accuracy had significantly increased, reaching a kappa of 0.95 and an overall accuracy of 96.34%. Landsat 7 ETM+'s improved radiometric and geometric performance helped all classes, with built-up and waterbody classes achieving 100% accuracy. High accuracies (≥96%) were also attained by forests and other areas, indicating better class separability. Waterbodies and forest lands again achieved near-perfect classification in 2015, while total accuracy remained very good (94.93%, κ = 0.94). While other lands recorded a PA of 94.90% and a UA of 95.88%, indicating good mapping confidence under Landsat 8 OLI, croplands and built-up regions-maintained user accuracies above 87% (
Table 7).
Cropland and other lands had a minor decline in accuracy in 2025 (90.08%, κ = 0.88) due to fragmentation and spectral mixing, whereas built-up, water, and forest areas maintained high accuracy (>96% PA and UA). The LULC classifications are generally reliable for long-term change study, supporting subsequent interpretations of land surface temperature patterns, land cover dynamics, and urbanization effects, as demonstrated by the strong kappa values and outstanding producer and user accuracies.
3.3. LULC Change Detection
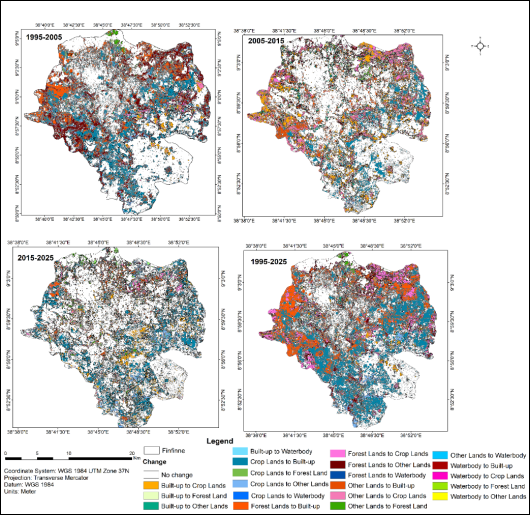
Between 1995 and 2025, there were 12,260 ha of major conversions from croplands to built-up, 6,843 ha from forest lands to built-up, 1,313 ha from other lands to built-up, and 1,291 ha from built-up to cropland (small reverse change). Transitions between years reveal rapid urban growth, particularly from forests and croplands. The spatial distribution of transitions that occurred between 1995 and 2025 is depicted in
Figure 4 below.
Figure 4. LULC change map of 1995, 2005, 2015, & 2025.
Table 8. LULC Changes in Finfinne (1995–2025).
From/To | 1995-2025 (ha) | 1995-2005 (ha) | 2005-2015 (ha) | 2015-2025 (ha) |
BU to CL | 1291 | 738 | 4760 | 3098 |
BU to FL | 87 | 135 | 89 | 21 |
BU to OL | 432 | 781 | 1360 | 711 |
BU to W | 11 | 3 | 40 | 33 |
CL to BU | 12260 | 8227 | 3997 | 6546 |
CL to FL | 146 | 197 | 0 | 220 |
CL to OL | 1875 | 2694 | 184 | 1976 |
CL to W | 41 | 23 | 4 | 24 |
FL to BU | 6843 | 4462 | 276 | 230 |
FL to CL | 3817 | 397 | 860 | 276 |
FL to OL | 2401 | 6450 | 1142 | 318 |
FL to W | 13 | 4 | 0 | 0 |
OL to BU | 1313 | 1128 | 3526 | 1927 |
OL to CL | 435 | 242 | 3925 | 1006 |
OL to FL | 171 | 231 | 227 | 621 |
OL to W | 1 | 1 | 13 | 9 |
W to BU | 75 | 65 | 11 | 44 |
W to CL | 26 | 21 | 9 | 8 |
W to FL | 3 | 6 | 0 | 0 |
W to OL | 16 | 26 | 13 | 5 |
The LULC transitions that took place in Finfinne over the course of three decades are shown in
Table 8, which illustrates how several classes changed from one type to another between 1995 and 2025 as well as within each intermediate period. The findings show that the landscape has undergone a significant and ongoing change, mostly due to urban growth and the conversion of crops and forests into populated areas.
Over the course of the study, 12,260 ha of croplands were converted to built-up areas, which is the most notable transformation. The fastest urban expansion occurred between 1995 and 2005, when 8,227 ha of croplands were urbanized. Between 2015 and 2025, there was another significant conversion (+6,546 hectares), which is indicative of the city's ongoing expansion into peri-urban agricultural areas. The conversion of 6,843 ha of forest land to built-up areas since 1995 is also noteworthy (
Figure 4;
Table 8). The majority of this (+4,462 ha) happened between 1995 and 2005, demonstrating how early urban expansion severely damaged the city's green areas. Together, these conversions show that built-up expansion is the main factor influencing LULC dynamics.
Transitions between non-urban classes show additional landscape change in addition to urban growth. Additionally, croplands noticed significant conversion into other lands (1,875 ha), especially between 1995 and 2005 and between 2015 and 2025, indicating changes toward disturbed or open land conditions prior to future urbanization. Over the course of the study, forest land showed significant transitions into other lands totalling 2,401 ha, with a notable 6,450 ha shift during the 2005–2015 decade, indicating times of clearing, deforestation, or degradation. Movement from forest to croplands (3,817 ha) demonstrates that, in some places, notably in the early stages of the study period, agricultural expansion coincided with deforestation. These changes demonstrate how forests have been susceptible to both open land creation and agricultural encroachment.
Over the period of 30 years, 1,313 ha of other land were converted to built-up areas, indicating that other lands were regularly changed into developed surfaces. This rise was greatest between 2005 and 2015, when 3,526 ha of previously open or thinly vegetated area became urban, indicating a rapid expansion of human settlement. Although these changes were much smaller and indicate localized land reclamation or vegetation establishment, other lands also changed into croplands (435 ha) and forest lands (171 ha).
Although there were a few minor adjustments, waterbodies had little impact on overall land changes. During its earliest period, a small area (75 ha) was converted from a water body to built-up land. In the same way, small amounts shifted into cropland and other land due to seasonal variations in water extent, wetland drainage, or local hydrological changes.
In general, there were few conversions from built-up land back into croplands, forests, or other types of property. For example, during the entire period, only 1,291 ha of built-up land were converted into croplands and 432 ha into other lands, suggesting that once a region gets urbanized, it seldom returns to natural or agricultural settings. This demonstrates Finfinne's ongoing geographical dominance and the irreversibility of urban growth.
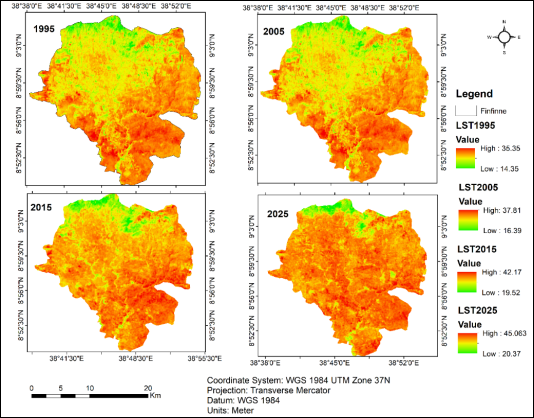
3.4. LST Trends (1995–2025)
The spatial distribution of LST and statistics of LST change for Finfinne City in 1995, 2005, 2015, and 2025 are shown in
Figure 5 and
Table 9 below.
Figure 5. LST Map of 1995, 2005, 2015, & 2025.
Table 9. LST value and changes from 1995 to 2025 (°C).
LST | 1995 | 2005 | 2015 | 2025 | 1995-2005 | 2005-2015 | 2015-2025 | 1995-2025 |
Minimum | 14.35 | 16.39 | 19.52 | 20.37 | 2.04 | 3.13 | 0.85 | 6.02 |
Maximum | 35.35 | 37.81 | 42.17 | 45.063 | 2.46 | 4.36 | 2.89 | 9.71 |
Mean | 28.24 | 32.23 | 34.99 | 35.65 | 3.99 | 2.76 | 0.66 | 7.41 |
A significant warming trend in minimum, maximum, and mean temperatures is shown by an analysis of LST during the 30-year period (1995–2025) (
Figure 5,
Table 9). The lowest areas' minimum LST increased from 14.35°C in 1995 to 20.37°C in 2025, a total increase of 6.02°C, with the greatest increase happening between 2005 and 2015 (+3.13°C). The replacement of vegetative or peri-urban areas with built-up surfaces and increased anthropogenic heat are responsible for this warming of previously moderate areas, suggesting that even cooler zones are becoming more and more stressed by heat.
Over the course of the study, the maximum LST, which corresponds to the hottest areas, rose from 35.35°C to 45.06°C, an overall rise of 9.71°C. The most rapid increase occurred between 2005 and 2015 (+4.36°C). The UHI effect is amplified by this tendency, which coincides with urban growth, an increase in impermeable surfaces, and a decrease in vegetation cover.
The mean LST also exhibits a significant higher trend, increasing from 28.24°C in 1995 to 35.65°C (+7.41°C) in 2025. The largest increase was between 1995 and 2005 (+3.99°C), followed by 2005 and 2015 (+2.76°C). The rise between 2015 and 2025 was very small (+0.66°C), indicating a tiny slowing in warming that may be the result of urban stabilization or small mitigating efforts.
The simultaneous rise in the minimum and maximum temperatures suggests that the thermal envelope is expanding, which exacerbates the UHI impact. This expansion of daytime and nighttime temperature ranges can change surface energy and moisture dynamics, impact local weather patterns, and worsen heat stress.
LULC changes, such as built-up growth, vegetation loss, and the conversion of crops into impermeable surfaces, are strongly correlated with observed LST trends. Concrete and asphalt are examples of urban materials that retain and reradiate heat, accelerating surface warming and producing localized hotspots.
These findings have significant implications for urban planning. Persistent LST raises environmental stress, heat-related health concerns, and energy demand. Increasing green areas, planting urban forests, installing green roofs, employing reflective materials, and improving water-sensitive design are examples of mitigation techniques that are essential for regulating surface temperatures, creating urban microclimates, and boosting climate resilience.
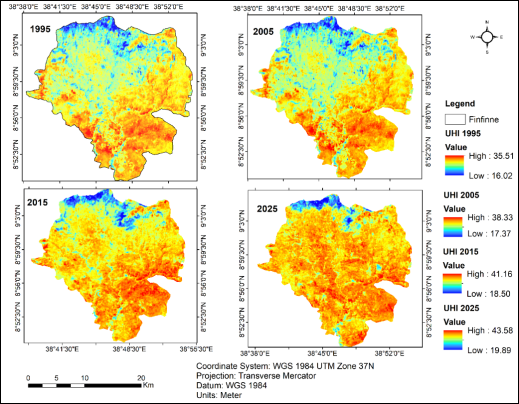
3.5. UHI Dynamics (1995–2025)
Over the years of the study, mean UHI intensities rose significantly, from 21.40°C in 1995 to 28.22°C in 2005, 33.98°C in 2015, and 35.16°C in 2025. This is a total increase of +13.76°C between 1995 and 2025 (
Figure 6;
Table 10). The spatial spread and intensification of UHI zones throughout the city are depicted in
Figure 6, which highlights areas situated in densely populated and poorly vegetated areas. The UHI intensities for each time are quantified in
Table 10, which illustrates how surface temperatures gradually increase in line with changes in LULC and urban expansion. These findings verify that the region's growing thermal stress is mostly caused by urbanization.
Figure 6. UHI Map of 1995, 2005, 2015, & 2025.
Table 10. UHI value and changes from 1995 to 2025.
UHI | 1995 | 2005 | 2015 | 2025 | 1995-2005 | 2005-2015 | 2015-2025 | 1995-2025 |
Minimum | 16.02 | 17.37 | 18.50 | 19.89 | 1.35 | 1.13 | 1.39 | 3.87 |
Maximum | 35.51 | 38.33 | 41.16 | 43.58 | 2.82 | 2.83 | 2.42 | 8.07 |
Mean | 21.40 | 28.22 | 33.98 | 35.16 | 6.82 | 5.76 | 1.18 | 13.76 |
Urban surface heating has clearly increased throughout the study area, according to an analysis of the UHI effect from 1995 to 2025. A total increase of 3.87°C can be seen in the minimum UHI values, which rose from 16.02°C in 1995 to 19.89°C in 2025 (
Figure 6;
Table 10). The largest rise in minimum UHI happened between 2015 and 2025 (+1.39°C), indicating that previously cooler urban areas are progressively accumulating more heat. This is probably because of ongoing urban growth and the encroachment of built-up surfaces into previously vegetated or low-density zones.
Over the duration of the study, the maximum UHI, which represents the hottest urban regions in relation to their surroundings, rose by 8.07°C, from 35.51°C in 1995 to 43.58°C in 2025. The highest rises in maximum UHI were seen between 1995 and 2005 (+2.82°C) and between 2005 and 2015 (+2.83°C), suggesting that urbanization and impervious surface development peaked during these times of rapid warming. These findings demonstrate the increasing severity of the UHI problem, especially in densely populated areas where local warming is made worse by the interaction of anthropogenic heat, poor vegetation cover, and high thermal conductivity surfaces.
The mean UHI also showed a significant upward trend, rising by 13.76°C from 21.40°C in 1995 to 35.16°C in 2025. The mean UHI increased most between 1995 and 2005 (+6.82°C) and between 2005 and 2015 (+5.76°C), but it increased less between 2015 and 2025 (+1.18°C) (
Figure 6,
Table 10). This pattern shows that, although the UHI increased most quickly during earlier stages of urban growth, the rate of increase has somewhat slowed in recent years. This could be because urban growth has reached saturation or because small mitigating measures, like more vegetation or water features in urban planning, have been put in place.
In general, the temporal evaluation of UHI values shows how closely urbanization, changes in land cover, and surface warming are related. Urban thermal environments are geographically variable, with some regions suffering intense warmth and others showing progressive warming, as evidenced by the reported increases in both minimum and maximum UHI. These results highlight the urgent need for sustainable urban planning techniques that include water-sensitive design, green infrastructure, and reflective building materials to improve thermal comfort, lessen the negative effects of rising urban temperatures on the environment and human health, and mitigate UHI effects.
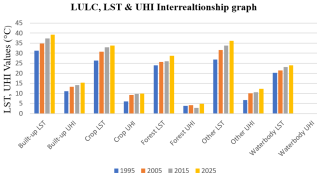
3.6. Interrelationship between LULC, LST, and UHI (1995–2025)
Figure 7. Relationship between LULC dynamics and thermal characteristics (LST and UHI) from 1995 to 2025.
Table 11. LST and UHI per LULC Classes (1995–2025).
LULC Type | 1995 | 2005 | 2015 | 2025 |
LST | UHI | LST | UHI | LST | UHI | LST | UHI |
Built-up | 31.3 | 11.1 | 34.8 | 13.3 | 37.3 | 14.1 | 39.22 | 15.32 |
Croplands | 26.3 | 6.1 | 30.7 | 9.2 | 32.9 | 9.7 | 33.85 | 9.95 |
Forest Lands | 24.0 | 3.8 | 25.7 | 4.2 | 26.0 | 2.8 | 28.75 | 4.85 |
Other Lands | 26.9 | 6.7 | 31.6 | 10.1 | 33.8 | 10.6 | 36.21 | 12.31 |
Waterbody | 20.2 | 0 | 21.5 | 0 | 23.2 | 0 | 23.90 | 0 |
Strong spatiotemporal correlations between landscape modification and surface thermal responses are revealed by analyzing the interaction between LULC dynamics, LST, and UHI intensity from 1995 to 2025. The trends show that the study area's surface heating patterns have been greatly impacted by increasing urbanization and land conversion.
From 31.3°C in 1995 to 39.22°C in 2025, built-up areas continuously reported the greatest LST values across all four study periods (
Figure 7;
Table 11). The UHI intensity rose from 11.1°C to 15.32°C within the same time frame, which is consistent with this dramatic increase. The prominent fact that impermeable materials like asphalt, concrete, and roofing absorb and retain more solar radiation than natural surfaces is supported by the significant positive correlation between built-up expansion and surface heating. Urban heat island impacts were exacerbated by the growth of built-up surfaces and the density of impermeable cover as urbanization expanded. These results are in line with other research that links rapid land conversion and a reduction in plant cover to rising urban temperatures.
Over time, croplands also showed a gradual increase in LST and UHI values. With UHI intensities increasing from 6.1°C to 9.95°C, croplands warmed from 26.3°C in 1995 to 33.85°C in 2025 (
Figure 7;
Table 11). The rising trend is probably due to increased agricultural intensification, soil exposure, and seasonal vegetation variations, even though croplands are typically colder than urban areas. In comparison to forested areas, higher surface temperatures may be caused by reduced soil moisture during dry spells and more bare-field exposure.
Conversely, among terrestrial categories, forest lands consistently showed the lowest LST, with mean temperatures rising slightly from 24.0°C to 28.75°C between 1995 and 2025 (
Figure 7;
Table 11). The related UHI values stayed comparatively low (3.8–4.85°C), demonstrating the important cooling function of vegetation. Through evapotranspiration, shade, and better soil moisture retention, forests reduce heat. Forests continue to be the most effective natural buffer against rising surface temperatures despite gradual warming, underscoring the significance of protecting and restoring green spaces.
Significant thermal sensitivity was shown by the "other lands" category, which includes bare land, degraded areas, and poorly vegetated surfaces. While UHI strengthened from 6.7°C to 12.31°C, LST rose from 26.9°C in 1995 to 36.21°C in 2025 (
Figure 7;
Table 11). The vulnerability of degraded land surfaces, which lack vegetative cover to control heat, is highlighted by these places' high thermal reactivity. These results imply that plant loss and land degradation significantly enhance surface heating and should be taken into account in mitigation plans.
Waterbodies were used as the reference baseline for UHI estimates because they consistently had the lowest LST values over the course of the study. Their constant temperature range of 20.2°C to 23.90°C relates to the moderating effect of water's large heat capacity and evaporative cooling. The difference between built-up areas and water surfaces demonstrates the increasing thermal inequality in the landscape and emphasizes the extent of anthropogenic heat changes.
Surface warming has been greatly worsened by the conversion of vegetated areas and crops into built-up and degraded areas, as evidenced by the observed LULC shifts, rising LST, and growing UHI. Urban growth is changing local microclimates, raising heat exposure, and endangering ecological and human health. In order to lessen future heat stress, these findings emphasize the significance of integrated land management strategies such as urban greening, forest preservation, sustainable land use planning, and climate-resilient urban design.
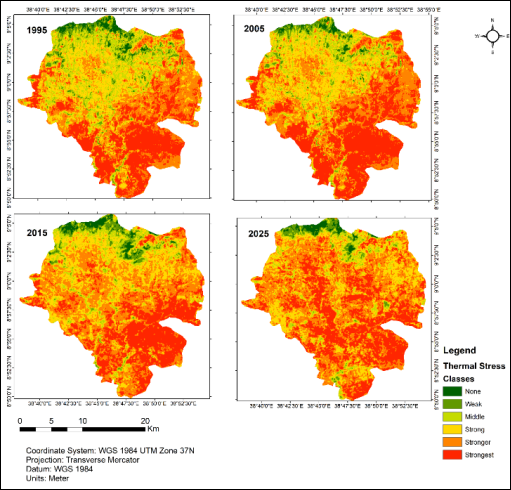
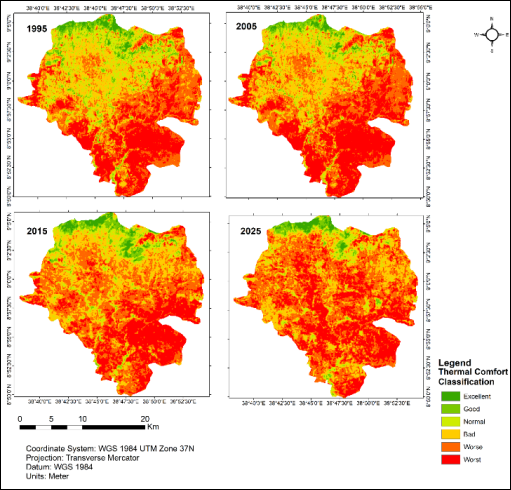
3.7. Spatial Distribution and Classification of Urban Thermal Stress Using UTFVI
The analysis reveals a clear, decades-long warming pattern across Finfinne, as shown by the urban heat stress maps from 1995 to 2025 (
Figure 8). In 1995, the city’s cooler, more comfortable zones were distinct found in the northern highlands, forested slopes, farmland, and areas near water. These regions showed minimal heat stress, reflecting healthier environmental conditions. In contrast, the early signs of concentrated urban heat were already apparent in the densely built-up environments of the city center, compact residential districts, and industrial sites, which registered noticeably higher temperatures even then. Over time, this thermal stress has intensified and spread, marking a steady rise in heat across the city.
By 2005, moderate to high UTFVI zones extended outward from the city center, agreeing with the rise in impervious surfaces and decreasing natural cover (
Figure 8). A more visible conversion happened between 2015 and 2025, when wide portions of the city changed into high UTFVI categories. The 2025 UTFVI map shows widespread thermal hotspots across dense residential zones, industrial belts, transportation corridors, and rapidly urbanizing peri-urban areas, with only distributed patches of low UTFVI persevering around forest remnants and river corridors. This spatial progress clearly reveals increasing dominance of thermally stressed landscapes and declining ecological quality across the city.
UTFVI values were classified into six UTCL classes, ranging from Excellent to Worst, as shown in
Table 12, allowing for the quantitative computation of thermal comfort conditions over time and ecologically meaningful interpretation. These classification systems are known for their robustness and transferability across various urban settings worldwide, and they have proven to be very helpful in assessments of the urban thermal environment
| [11] | Jensen, J. R. (2016). Remote sensing of the environment: An Earth resource perspective (2nd ed.). Pearson. |
| [13] | Landis, J. R., & Koch, G. G. (1977). The measurement of observer agreement for categorical data. Biometrics, 33(1), 159–174. https://doi.org/10.2307/2529310 |
| [20] | Nagasa, M. D. (2025). Integrating CA–Markov modeling, machine learning classifiers, and spatial metrics for urban sprawl analysis in Naqamte City, Ethiopia. Discov Cities, 2, 114.
https://doi.org/10.1007/s44327-025-00147-2 |
| [34] | Weng, Q., Lu, D., & Schubring, J. (2004). Estimation of land surface temperature–vegetation abundance relationship for urban heat island studies. Remote Sensing of Environment, 89(4), 467–483. https://doi.org/10.1016/j.rse.2003.11.005 |
| [37] | Valor, E., & Caselles, V. (1996). Mapping land surface emissivity from visible and infrared data. International Journal of Remote Sensing, 17(17), 3665–3682.
https://doi.org/10.1016/0034-4257(96)00039-9 |
[11, 13, 20, 34, 37]
.
The spatial and areal distribution of UTCL classes was presented in
Figure 9 and
Table 13. In 1995, thermally comfortable environments (Excellent, Good, and Normal) covered 22.0% of the city and were mainly associated with forests, croplands, water bodies, and moisture-rich landscapes (
Table 12). However, these categories declined consistently throughout the study period: Excellent decreased from 2.03% to 1.56%, Good from 5.47% to 2.59%, and Normal from 14.50% to 5.64% (
Table 12). Therefore, by 2025 only 9.79% of Finfinne reserved acceptable thermal comfort conditions, showing a marked decrease in ecologically stable and thermally comfortable environments.
The moderately stressed "Bad" category, which accounted for 24.32% of the area in 1995, 23.86% in 2005, 24.29% in 2015, and somewhat decreased to 21.42% in 2025, showed that medium-level heat stress persisted throughout significant areas of the city.
The most important transformation was observed in the highly stressed thermal categories. The “Worse” class increased markedly from 28.49% (14,846 ha) in 1995 to 39.23% (20,443 ha) in 2025, while the “Worst” category rose from 25.20% to 29.56% over the same period (
Table 12). By 2025, these two classes together accounted for 68.79% of the city area, confirming a rapid expansion and consolidation of thermally critical environments. Spatially, they were concentrated in high-density residential areas, industrial zones, the central business district, and newly urbanized peripheral neighbourhoods characterized by limited vegetation cover. This outward expansion demonstrates that heat stress has evolved from a localized urban core phenomenon into a widespread city-wide environmental challenge.
Over the past three decades, Finfinne has undergone a distinct and progressive thermal shift, as demonstrated by the combined UTFVI and UTCL investigations. The city had varied thermal characteristics in the early years (1995), with a significant percentage of thermally comfortable areas associated with vegetated and wet landscapes. Rapid urban growth and intensification of built-up area greatly increased thermal degradation during the transitional phase (2005–2015), resulting in a discernible decrease in thermally suitable zones and an increase in highly stressed situations. By 2025, high UTFVI readings and severe UTCL categories dominated the urban landscape, signifying widespread ecological stress and widespread heat risk throughout the city. Lastly, the findings support an ongoing process of thermal intensification characterized by the broad growth of heat-stressed urban surfaces and the gradual contraction of cooling environments.
Figure 8. Spatial distribution of the UTFVI for Finfinne in 1995, 2005, 2015, and 2025.
Table 12. Threshold values of the UTFVI and corresponding ecological evaluation levels.
UTFVI | UHI phenomenon | Ecological Evaluation Index (UTCL) |
< 0 | None | Excellent |
0–0.005 | Weak | Good |
0.005–0.01 | Middle | Normal |
0.010–0.015 | Strong | Bad |
0.015–0.02 | Stronger | Worse |
> 0.02 | Strongest | Worst |
Figure 9. Thermal Comfort Level of Finfinne in 1995, 2005, 2015, & 2025.
Table 13. Aerial Distribution of UTCL Classes (1995-2025).
UTCL classes | 1995 | 2005 | 2015 | 2025 |
Area (ha) | Area (%) | Area (ha) | Area (%) | Area (ha) | Area (%) | Area (ha) | Area (%) |
Excellent | 1058 | 2.0 | 990 | 1.9 | 713 | 1.4 | 598 | 1.1 |
Good | 2848 | 5.5 | 2180 | 4.2 | 1587 | 3.0 | 1349 | 2.6 |
Normal | 7554 | 14.5 | 5210 | 10.0 | 3713 | 7.1 | 2940 | 5.3 |
Bad | 12672 | 24.3 | 13034 | 23.9 | 13560 | 24.1 | 14162 | 21.2 |
Worse | 14846 | 28.5 | 15576 | 29.9 | 17015 | 32.7 | 20443 | 34.8 |
Worst | 13132 | 25.2 | 15720 | 30.2 | 16522 | 31.7 | 18403 | 35.0 |
Total | 52110 | 100% | 52110 | 100% | 52110 | 100% | 52110 | 100% |
3.8. Statistical Relationships Between LULC, LST, UHI, and UTFVI
Strong and consistent relations among LULC dynamics, LST, UHI intensity, and the UTFVI in Finfinne are shown by the statistical and spatial analyses. Finfinne has seen substantial thermal extension as a result of progressive urban expansion and related ecological transformation.
Table 14's regression outputs demonstrate how much urbanization controls the city's thermal environment.
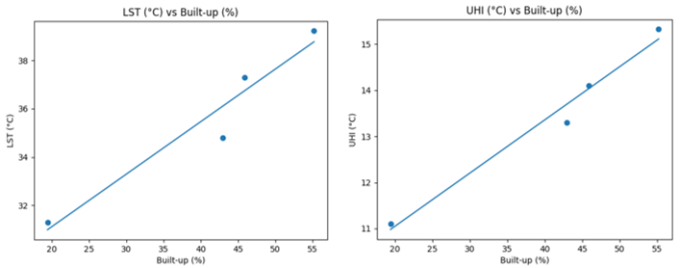
There is a positive relationship between Built-up land and both LST and UHI intensity. Increases in impervious surface area clarify 93.5% of the variability in LST (R² = 0.935; r = 0.97) and 97.7% of changes in UHI intensity (R² = 0.977; r = 0.99) over the study period, as presented in
Table 14. This confirms that the expansion of built-up areas significantly enhances surface heating and strengthens UHI development by suppressing evapotranspiration, increasing heat storage capacity, and altering the surface energy balance. Likewise, LST and UHI exhibit a near-perfect statistical coupling (R² = 0.986; r = 0.99), demonstrating that intensifying surface heating directly translates into stronger UHI magnitudes.
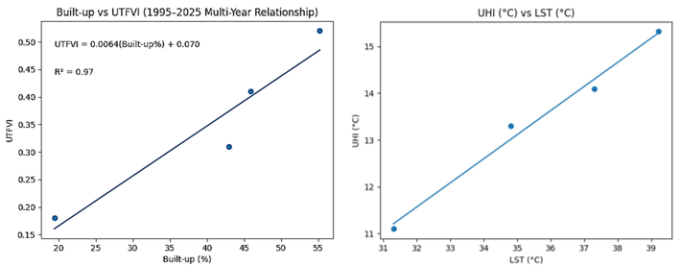
UTFVI results further reinforce these relationships by linking thermal behavior with ecological condition. Built-up proportion shows a strong positive association with UTFVI (R² = 0.909; r = 0.953), indicating that increasing urbanization elevates urban thermal stress and ecological degradation (
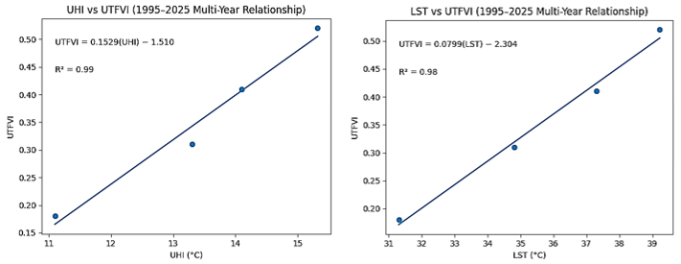
Table 14). While UHI also shows a very significant statistical correlation with UTFVI (R² = 0.976; r = 0.988), LST shows an even stronger relationship with UTFVI (R² = 0.991; r = 0.995), indicating that UTFVI is sensitive to both surface warming and UHI intensity (
Table 14).
Figures 10-12 provide a graphic representation of these interactions, showing a constant correlation between rising UTFVI levels and growing built-up, LST, and UHI values.
Spatially, areas classified under high UTFVI categories (“Bad,” “Worse,” and “Worst”) coincide with zones of elevated LST and intensified UHI, particularly within dense built-up cores and rapidly urbanizing peri-urban regions. Conversely, areas classified under “Excellent,” “Good,” and “Normal” UTFVI conditions correspond to forested landscapes, well-vegetated croplands, and water bodies, which consistently recorded low temperatures and minimal UHI intensity. The spatial and statistical consistency observed between the parameters further validates UTFVI as a reliable ecological thermal stress indicator.
In general, the statistical data (
Table 14) and graphical interpretations (
Figures 10-12) show that the main cause of rising LST, intensifying UHI effects, and increasing UTFVI-based thermal stress in Finfinne is rapid land transformation, particularly the conversion of vegetated and permeable surfaces into impervious urban land. In order to reduce future heat risk and maintain urban ecological resilience, these findings emphasize the critical need for climate-sensitive urban planning, the development of urban green and blue infrastructure, and the application of nature-based cooling techniques.
Table 14. Correlation between LULC, LST, UHI, and UTFVI (1995-2025).
Relationship | Regression Model | R² | Pearson r | Significance |
BU (%) → LST | LST = 0.2172(BU%) + 26.782 | 0.935 | 0.97 | p < 0.05 |
BU (%) → UHI | UHI = 0.1153(BU%) + 8.745 | 0.977 | 0.99 | p < 0.05 |
LST → UHI | UHI = 0.5154(LST) − 4.923 | 0.986 | 0.99 | p < 0.01 |
BU (%) → UTFVI | UTFVI = 0.0091(BU%) + -0.015 | 0.909 | 0.953 | p < 0.05 (modelled) |
LST → UTFVI | UTFVI = 0.0421(LST) + -1.147 | 0.991 | 0.995 | p < 0.05 (modelled) |
UHI → UTFVI | UTFVI = 0.0805(UHI) + -0.729 | 0.976 | 0.988 | p < 0.05 (modelled) |
These values are computed directly from
Table 2 &
Table 11.
Figure 10. Correlation between LST vs Built-up and UHI vs Built-up (1995-2025).
Figure 11. Correlation between Built-up vs. UTFVI and UHI Vs LST (1995-2025).
Figure 12. Correlation b/n UHI Vs UTFVI and LST Vs UTFVI (1995-2025).
4. Discussion
The analysis of LULC transition, LST increase, UHI and UTFVI dynamics in Finfinne from 1995 to 2025 reveals significant interaction among these factors. Rapid urban growth has led to the conversion of natural landscapes into impermeable surfaces, altering the urban thermal environment. This aligns with established theories on urbanization's impact on surface energy balance, involving increased anthropogenic heat, reduced evapotranspiration, and heightened heat retention in construction materials
| [24] | Sekertekin, A., & Bonafoni, S. (2020). Land surface temperature retrieval from Landsat 5, 7, and 8 over rural areas: Assessment of different retrieval algorithms and emissivity models and toolbox implementation. Remote Sensing, 12(2), 294.
https://doi.org/10.3390/rs12020294 |
| [33] | Weng, Q. (2009). Thermal infrared remote sensing for urban climate and environmental studies: Methods, applications, and trends. ISPRS Journal of Photogrammetry and Remote Sensing, 64(4), 335–344. https://doi.org/10.56261/jars.v9i1.168598 |
[24, 33]
. The findings corroborate prior research indicating that land conversion is a major driver of urban thermal amplification in rapidly growing African cities
| [30] | Thuo, A. D. M. (2014). Urbanization in Nairobi’s rural–urban fringe: Consequences of land-use conversion. Acta Horticulturae, 1021, 27–38.
https://doi.org/10.17660/ActaHortic.2014.1021.16 |
| [36] | Yue, W., Xu, J., Tan, W., & Xu, L. (2007). The relationship between land surface temperature and NDVI with remote sensing: Application to Shanghai Landsat 7ETM+ data. International Journal of Remote Sensing, 28(15), 3205–3226.
https://doi.org/10.1080/01431160500306906 |
[30, 36]
.
4.1. Urban Expansion as the Dominant Driver of LULC Change
The marked increase in built-up area from 19.4% in 1995 to 55.2% in 2025 clearly illustrates the rapid spatial expansion of Finfinne’s urban footprint (
Table 2). Over the 30-year period, this growth occurred largely at the expense of croplands and forest lands, with approximately 12,260 ha of croplands and 6,843 ha of forest converted into built-up surfaces. Such extensive land transformation reflects the combined influence of population growth, rising housing demand, infrastructure development, and economic expansion processes that typify rapid urbanization.
The scale and pattern of built-up expansion in Finfinne closely correspond with findings from other Ethiopian cities. Studies conducted in Addis Ababa have reported substantial conversion of croplands and vegetated areas into impervious surfaces, particularly within peri-urban zones where development pressure is most intense
| [20] | Nagasa, M. D. (2025). Integrating CA–Markov modeling, machine learning classifiers, and spatial metrics for urban sprawl analysis in Naqamte City, Ethiopia. Discov Cities, 2, 114.
https://doi.org/10.1007/s44327-025-00147-2 |
| [23] | Qin, Z., Karnieli, A., & Berliner, P. (2001). A mono-window algorithm for retrieving land surface temperature from Landsat TM data and its application to the Israel–Egypt border region. International Journal of Remote Sensing, 22(18), 3719–3746.
https://doi.org/10.1080/01431160010006971 |
[20, 23]
. These studies documented built-up area increases exceeding 40% over similar timeframes, suggesting that Finfinne’s growth trajectory is embedded within a broader national urbanization process rather than representing an isolated case.
Comparable LULC transitions have also been observed in other Ethiopian urban centers. In Mekelle,
identified widespread conversion of agricultural land to built-up areas between 1990 and 2020, driven primarily by population growth and infrastructure expansion. Similarly, research in Adama and Hawassa shows that urban growth has largely occurred at the expense of croplands, wetlands, and open spaces
| [8] | Demisse, S., Hishe, S., & Getahun, K. (2024). LULC dynamics and the effects of urban green spaces in cooling and mitigating microclimate change and urban heat island effects: A case study in Addis Ababa City, Ethiopia. Water and Climate Change. https://doi.org/10.2166/wcc.2024.662 |
[8]
. These consistent cropland-to-built-up and forest-to-built-up transitions highlight the vulnerability of peri-urban agricultural landscapes across Ethiopian cities.
At the global scale, analogous LULC dynamics are well documented in rapidly growing cities across Asia, Africa, and Latin America, where urban expansion typically replaces vegetated and agricultural land with impervious surfaces
| [34] | Weng, Q., Lu, D., & Schubring, J. (2004). Estimation of land surface temperature–vegetation abundance relationship for urban heat island studies. Remote Sensing of Environment, 89(4), 467–483. https://doi.org/10.1016/j.rse.2003.11.005 |
| [36] | Yue, W., Xu, J., Tan, W., & Xu, L. (2007). The relationship between land surface temperature and NDVI with remote sensing: Application to Shanghai Landsat 7ETM+ data. International Journal of Remote Sensing, 28(15), 3205–3226.
https://doi.org/10.1080/01431160500306906 |
[34, 36]
. The transition matrices further indicate that Finfinne’s peri-urban fringe is the most dynamic zone of change, mirroring patterns observed in other East African cities such as Nairobi, Kampala, and Kigali. Beyond reducing local food production capacity, the loss of croplands also diminishes evapotranspirative cooling, thereby intensifying surface thermal stress and posing significant challenges for urban sustainability.
4.2. Rising Land Surface Temperature Driven by Surface Modification
Finfinne experienced a pronounced increase in mean LST, rising from 28.24°C in 1995 to 35.65°C in 2025. This net increase of 7.41°C over three decades reflects the combined effects of rapid urban expansion and broader regional climate warming. Built-up areas consistently recorded the highest LST values throughout the study period, reaching a mean of 39.22°C in 2025. This persistent thermal dominance is largely attributable to the prevalence of heat-absorbing materials such as asphalt and concrete, reduced vegetation cover, and enhanced heat storage associated with impervious surfaces.
LST variations across LULC classes followed well-established thermal patterns. Water bodies and forest lands consistently exhibited the lowest LST values, underscoring the cooling roles of surface moisture, evapotranspiration, and canopy shading. However, the increase in forest LST from approximately 24°C in 1995 to 28.75°C in 2025 indicates that even relatively undisturbed land-cover types are affected by background warming. This suggests that Finfinne’s thermal environment is shaped by both local land-cover change and broader climate-induced temperature increases.
Temporally, the most substantial rise in mean LST occurred between 1995 and 2005 (+3.99°C), coinciding with a period of intense horizontal urban expansion. In contrast, the smaller increase between 2015 and 2025 (+0.66°C) may reflect partial saturation of developable land and a gradual shift toward vertical urban growth. While such structural changes may slow the rate of surface warming, they do not fully offset the heat retention effects of extensive impervious cover.
The magnitude of LST increase observed is consistent with previous studies in Finfinne and other Ethiopian cities.
| [20] | Nagasa, M. D. (2025). Integrating CA–Markov modeling, machine learning classifiers, and spatial metrics for urban sprawl analysis in Naqamte City, Ethiopia. Discov Cities, 2, 114.
https://doi.org/10.1007/s44327-025-00147-2 |
[20]
reported an 8–9°C increase in mean LST in Addis Ababa over three decades, and 7.8°C rise in daily maximum LST between 1990 and 2021.
| [23] | Qin, Z., Karnieli, A., & Berliner, P. (2001). A mono-window algorithm for retrieving land surface temperature from Landsat TM data and its application to the Israel–Egypt border region. International Journal of Remote Sensing, 22(18), 3719–3746.
https://doi.org/10.1080/01431160010006971 |
[23]
further identified strong positive correlations between impervious surface density and LST hotspots. Similar thermal patterns have been reported in Mekelle, Adama, and Hawassa
| [8] | Demisse, S., Hishe, S., & Getahun, K. (2024). LULC dynamics and the effects of urban green spaces in cooling and mitigating microclimate change and urban heat island effects: A case study in Addis Ababa City, Ethiopia. Water and Climate Change. https://doi.org/10.2166/wcc.2024.662 |
| [9] | Dissanayake, D., Morimoto, T., Murayama, Y., & Ranagalage, M. (2019). The impact of landscape composition on urban heat island intensity in Addis Ababa using Landsat data (1986–2016). Abstracts of the International Cartographic Association, 1(63). https://doi.org/10.5194/ica-abs-1-63-2019 |
| [30] | Thuo, A. D. M. (2014). Urbanization in Nairobi’s rural–urban fringe: Consequences of land-use conversion. Acta Horticulturae, 1021, 27–38.
https://doi.org/10.17660/ActaHortic.2014.1021.16 |
[8, 9, 30]
. At the global scale, Finfinne’s LST patterns align with observations from tropical and subtropical cities, reinforcing the universal link between urbanization, land-cover change, and surface warming
| [24] | Sekertekin, A., & Bonafoni, S. (2020). Land surface temperature retrieval from Landsat 5, 7, and 8 over rural areas: Assessment of different retrieval algorithms and emissivity models and toolbox implementation. Remote Sensing, 12(2), 294.
https://doi.org/10.3390/rs12020294 |
| [33] | Weng, Q. (2009). Thermal infrared remote sensing for urban climate and environmental studies: Methods, applications, and trends. ISPRS Journal of Photogrammetry and Remote Sensing, 64(4), 335–344. https://doi.org/10.56261/jars.v9i1.168598 |
| [34] | Weng, Q., Lu, D., & Schubring, J. (2004). Estimation of land surface temperature–vegetation abundance relationship for urban heat island studies. Remote Sensing of Environment, 89(4), 467–483. https://doi.org/10.1016/j.rse.2003.11.005 |
[24, 33, 34]
.
4.3. Intensification of UHI Effects Across the City
UHI intensity in Finfinne increased markedly from 21.40°C in 1995 to 35.16°C in 2025, representing an overall amplification of 13.76°C over three decades. This pronounced escalation is closely linked to sustained expansion of impervious built-up surfaces and the progressive loss of vegetated land, which are widely recognized as dominant drivers of UHI intensification in rapidly urbanizing environments
| [33] | Weng, Q. (2009). Thermal infrared remote sensing for urban climate and environmental studies: Methods, applications, and trends. ISPRS Journal of Photogrammetry and Remote Sensing, 64(4), 335–344. https://doi.org/10.56261/jars.v9i1.168598 |
| [34] | Weng, Q., Lu, D., & Schubring, J. (2004). Estimation of land surface temperature–vegetation abundance relationship for urban heat island studies. Remote Sensing of Environment, 89(4), 467–483. https://doi.org/10.1016/j.rse.2003.11.005 |
[33, 34]
. Spatially, the highest UHI intensities were consistently concentrated in dense residential areas, industrial zones, and rapidly expanding peri-urban fringes, reflecting thermal patterns reported in other tropical and subtropical cities
.
These findings align well with previous Ethiopian studies. In Finfinne,
| [23] | Qin, Z., Karnieli, A., & Berliner, P. (2001). A mono-window algorithm for retrieving land surface temperature from Landsat TM data and its application to the Israel–Egypt border region. International Journal of Remote Sensing, 22(18), 3719–3746.
https://doi.org/10.1080/01431160010006971 |
[23]
documented strong surface heat exposure associated with continuous urban expansion, with built-up areas exhibiting the highest thermal anomalies. Similar UHI patterns have been observed in Hawassa, Bahir Dar, and Adama, where croplands, wetlands, and vegetated surfaces were progressively converted into urban settlements, leading to intensified surface heating
| [8] | Demisse, S., Hishe, S., & Getahun, K. (2024). LULC dynamics and the effects of urban green spaces in cooling and mitigating microclimate change and urban heat island effects: A case study in Addis Ababa City, Ethiopia. Water and Climate Change. https://doi.org/10.2166/wcc.2024.662 |
| [9] | Dissanayake, D., Morimoto, T., Murayama, Y., & Ranagalage, M. (2019). The impact of landscape composition on urban heat island intensity in Addis Ababa using Landsat data (1986–2016). Abstracts of the International Cartographic Association, 1(63). https://doi.org/10.5194/ica-abs-1-63-2019 |
| [30] | Thuo, A. D. M. (2014). Urbanization in Nairobi’s rural–urban fringe: Consequences of land-use conversion. Acta Horticulturae, 1021, 27–38.
https://doi.org/10.17660/ActaHortic.2014.1021.16 |
[8, 9, 30]
. The 30-year temporal coverage of the present study provides robust evidence of the cumulative and long-term effects of land-cover change compounded by regional climate warming.
Temporally, the most rapid UHI intensification occurred between 1995 and 2015, coinciding with accelerated horizontal urban expansion and extensive vegetation loss, a trend also highlighted by
| [8] | Demisse, S., Hishe, S., & Getahun, K. (2024). LULC dynamics and the effects of urban green spaces in cooling and mitigating microclimate change and urban heat island effects: A case study in Addis Ababa City, Ethiopia. Water and Climate Change. https://doi.org/10.2166/wcc.2024.662 |
[8]
. Although the rate of UHI growth slowed after 2015 likely due to partial stabilization of lateral expansion and increased urban densification overall heat accumulation remains high because of the continued dominance of impervious surfaces and limited development of cooling green infrastructure
| [23] | Qin, Z., Karnieli, A., & Berliner, P. (2001). A mono-window algorithm for retrieving land surface temperature from Landsat TM data and its application to the Israel–Egypt border region. International Journal of Remote Sensing, 22(18), 3719–3746.
https://doi.org/10.1080/01431160010006971 |
[23]
. Comparable UHI dynamics have been reported in Mekelle, Hawassa, and Addis Ababa, reinforcing that Finfinne follows a broader national and global urban thermal trajectory
| [20] | Nagasa, M. D. (2025). Integrating CA–Markov modeling, machine learning classifiers, and spatial metrics for urban sprawl analysis in Naqamte City, Ethiopia. Discov Cities, 2, 114.
https://doi.org/10.1007/s44327-025-00147-2 |
| [36] | Yue, W., Xu, J., Tan, W., & Xu, L. (2007). The relationship between land surface temperature and NDVI with remote sensing: Application to Shanghai Landsat 7ETM+ data. International Journal of Remote Sensing, 28(15), 3205–3226.
https://doi.org/10.1080/01431160500306906 |
[20, 36]
.
4.4. Relationship Between Urbanization and Climate Warming
A key contribution of this study lies in integrating LULC dynamics, LST trends, and UHI intensification within the broader context of regional climate warming. The results reveal a consistent rise in LST and UHI values across all land-cover classes, including forests and water bodies, indicating that background atmospheric warming is elevating baseline surface temperatures, while urban land transformation further amplifies localized heating. This interaction demonstrates that land-cover change and climate warming operate concurrently, with urban expansion intensifying heat accumulation through reduced albedo, diminished vegetation cover, lower evapotranspiration, and increased anthropogenic heat emissions
| [24] | Sekertekin, A., & Bonafoni, S. (2020). Land surface temperature retrieval from Landsat 5, 7, and 8 over rural areas: Assessment of different retrieval algorithms and emissivity models and toolbox implementation. Remote Sensing, 12(2), 294.
https://doi.org/10.3390/rs12020294 |
| [33] | Weng, Q. (2009). Thermal infrared remote sensing for urban climate and environmental studies: Methods, applications, and trends. ISPRS Journal of Photogrammetry and Remote Sensing, 64(4), 335–344. https://doi.org/10.56261/jars.v9i1.168598 |
| [34] | Weng, Q., Lu, D., & Schubring, J. (2004). Estimation of land surface temperature–vegetation abundance relationship for urban heat island studies. Remote Sensing of Environment, 89(4), 467–483. https://doi.org/10.1016/j.rse.2003.11.005 |
[24, 33, 34]
.
These findings are consistent with global evidence showing that rapidly urbanizing cities experience compounded warming effects, whereby regional climate change establishes a warmer thermal baseline and urban microclimates exacerbate it through structural and surface modifications
| [36] | Yue, W., Xu, J., Tan, W., & Xu, L. (2007). The relationship between land surface temperature and NDVI with remote sensing: Application to Shanghai Landsat 7ETM+ data. International Journal of Remote Sensing, 28(15), 3205–3226.
https://doi.org/10.1080/01431160500306906 |
[36]
. In Finfinne, this dual influence is reflected in the progressive intensification of surface heating and the spatial expansion of thermally stressed zones, even within land-cover types traditionally associated with cooler conditions.
The study therefore demonstrates that urbanization accelerates thermal stress beyond levels attributable to climate change alone. If current development trajectories continue without targeted mitigation, the combined effects of land transformation and climatic warming are likely to increase heat-related health risks, elevate energy demand for cooling, and reduce overall urban livability
| [24] | Sekertekin, A., & Bonafoni, S. (2020). Land surface temperature retrieval from Landsat 5, 7, and 8 over rural areas: Assessment of different retrieval algorithms and emissivity models and toolbox implementation. Remote Sensing, 12(2), 294.
https://doi.org/10.3390/rs12020294 |
| [34] | Weng, Q., Lu, D., & Schubring, J. (2004). Estimation of land surface temperature–vegetation abundance relationship for urban heat island studies. Remote Sensing of Environment, 89(4), 467–483. https://doi.org/10.1016/j.rse.2003.11.005 |
[24, 34]
. These findings underscore the urgent need for climate-responsive urban planning, integration of blue–green infrastructure, and proactive adaptation strategies to reduce cumulative thermal impacts in Finfinne.
4.5. Cooling Role of Vegetation and Water Bodies
The results of this study demonstrate that forest lands and water bodies consistently exhibited the lowest land surface temperature (LST) and Urban Heat Island (UHI) values throughout all study periods, reaffirming their critical role in moderating Finfinne’s urban thermal environment. These findings are consistent with previous studies from Ethiopian cities, where vegetated and water-covered surfaces were shown to exert strong cooling effects. Research in Addis Ababa
| [20] | Nagasa, M. D. (2025). Integrating CA–Markov modeling, machine learning classifiers, and spatial metrics for urban sprawl analysis in Naqamte City, Ethiopia. Discov Cities, 2, 114.
https://doi.org/10.1007/s44327-025-00147-2 |
[20]
, Mekelle
, and Hawassa
| [8] | Demisse, S., Hishe, S., & Getahun, K. (2024). LULC dynamics and the effects of urban green spaces in cooling and mitigating microclimate change and urban heat island effects: A case study in Addis Ababa City, Ethiopia. Water and Climate Change. https://doi.org/10.2166/wcc.2024.662 |
[8]
similarly reported significantly lower surface temperatures in areas dominated by forests, croplands, riparian vegetation, and lakes.
The observed cooling effect is explained by well-established biophysical processes, including evapotranspiration, canopy shading, higher surface moisture, and reduced heat storage in vegetated and water-dominated landscapes. These mechanisms collectively lower surface temperatures and mitigate UHI intensity. Globally, comparable findings have been widely documented, confirming the effectiveness of green and blue infrastructure in reducing urban thermal stress
| [24] | Sekertekin, A., & Bonafoni, S. (2020). Land surface temperature retrieval from Landsat 5, 7, and 8 over rural areas: Assessment of different retrieval algorithms and emissivity models and toolbox implementation. Remote Sensing, 12(2), 294.
https://doi.org/10.3390/rs12020294 |
| [34] | Weng, Q., Lu, D., & Schubring, J. (2004). Estimation of land surface temperature–vegetation abundance relationship for urban heat island studies. Remote Sensing of Environment, 89(4), 467–483. https://doi.org/10.1016/j.rse.2003.11.005 |
[24, 34]
.
The strong agreement between this study, national research, and international literature highlights the importance of conserving and expanding green and blue spaces as cost-effective, sustainable strategies for mitigating urban warming and enhancing climate resilience in rapidly growing cities such as Finfinne.
4.6. UTFVI-Based Ecological Conditions and Human Thermal Stress
The temporal evolution of the UTFVI and UTCL clearly indicates a marked deterioration of Finfinne’s thermal environmental quality between 1995 and 2025. The continuous decline in areas classified as “Excellent,” “Good,” and “Normal” thermal comfort, together with the rapid expansion of “Worse” and “Worst” categories, reflects increasing ecological stress and an intensifying urban heat burden across the city (
Table 12). This shift is strongly associated with rapid urban expansion, widespread loss of vegetated land, and the proliferation of impervious materials, which suppress evapotranspiration, enhance heat storage, and amplify sensible heat flux.
These findings are consistent with previous Ethiopian urban climate studies. In Addis Ababa,
| [20] | Nagasa, M. D. (2025). Integrating CA–Markov modeling, machine learning classifiers, and spatial metrics for urban sprawl analysis in Naqamte City, Ethiopia. Discov Cities, 2, 114.
https://doi.org/10.1007/s44327-025-00147-2 |
[20]
showed that continuous expansion of impervious surfaces led to significant increases in land surface temperature (LST), with thermally stressed zones expanding outward from the urban core.
| [23] | Qin, Z., Karnieli, A., & Berliner, P. (2001). A mono-window algorithm for retrieving land surface temperature from Landsat TM data and its application to the Israel–Egypt border region. International Journal of Remote Sensing, 22(18), 3719–3746.
https://doi.org/10.1080/01431160010006971 |
[23]
further demonstrated strong positive correlations between built-up land cover and surface heat hotspots, reinforcing the role of land-cover modification as a dominant driver of urban warming. Similar trends have been reported in Mekelle, where
documented rising LST and UHI intensity following the conversion of croplands and natural vegetation into urban land. Studies in Bahir Dar, and Hawassa likewise identified rapid urban expansion as the primary factor driving thermal amplification and ecological degradation
| [8] | Demisse, S., Hishe, S., & Getahun, K. (2024). LULC dynamics and the effects of urban green spaces in cooling and mitigating microclimate change and urban heat island effects: A case study in Addis Ababa City, Ethiopia. Water and Climate Change. https://doi.org/10.2166/wcc.2024.662 |
[8]
.
At the global scale, the Finfinne results align closely with established urban climate theory and remote sensing–based studies. Classical frameworks emphasize that urban surfaces absorb and retain more heat than natural landscapes, elevating surface and air temperatures
| [24] | Sekertekin, A., & Bonafoni, S. (2020). Land surface temperature retrieval from Landsat 5, 7, and 8 over rural areas: Assessment of different retrieval algorithms and emissivity models and toolbox implementation. Remote Sensing, 12(2), 294.
https://doi.org/10.3390/rs12020294 |
| [33] | Weng, Q. (2009). Thermal infrared remote sensing for urban climate and environmental studies: Methods, applications, and trends. ISPRS Journal of Photogrammetry and Remote Sensing, 64(4), 335–344. https://doi.org/10.56261/jars.v9i1.168598 |
[24, 33]
. Empirical evidence worldwide further confirms that vegetation loss and built-up expansion intensify thermal stress
| [34] | Weng, Q., Lu, D., & Schubring, J. (2004). Estimation of land surface temperature–vegetation abundance relationship for urban heat island studies. Remote Sensing of Environment, 89(4), 467–483. https://doi.org/10.1016/j.rse.2003.11.005 |
| [36] | Yue, W., Xu, J., Tan, W., & Xu, L. (2007). The relationship between land surface temperature and NDVI with remote sensing: Application to Shanghai Landsat 7ETM+ data. International Journal of Remote Sensing, 28(15), 3205–3226.
https://doi.org/10.1080/01431160500306906 |
[34, 36]
. Comparable patterns have been observed in rapidly growing cities in Africa and Asia, including Nairobi, Kampala, Kigali, and several Chinese and Southeast Asian cities, where rising UTFVI values signal declining urban ecological quality under accelerated urbanization
| [18] | Moisa, Y., & Gemeda, D. (2022). Land use/cover dynamics and urban heat island effects in Addis Ababa. (Cited in discussion; details not provided).
https://doi.org/10.1007/s10661-022-10414 |
| [21] | Negesse, M. D., Hishe, S., & Getahun, K. (2024). Urban land use, land cover change, and urban microclimate dynamics in Finfinne, Ethiopia. Discover Environment, 2, 71.
https://doi.org/10.1007/s44274-024-00105-6 |
| [31] | U.S. Geological Survey (USGS). (2019). Landsat Data Users Handbook. USGS. https://doi.org/10.1016/j.rse.2019.111214 |
[18, 21, 31]
.
4.7. Relationship among UTFVI, LULC, LST, and UHI
The findings of this study demonstrate that rapid LULC transitions particularly the expansion of built-up areas at the expense of vegetated and permeable surfaces have fundamentally altered the urban thermal environment of Finfinne over the past three decades. The very strong statistical relationships observed between the proportion of built-up land, LST, UHI intensity, and the UTFVI confirm that urbanization is the dominant driver of thermal intensification in the city. Regression results indicate that increases in impervious surfaces explain most of the variability in both LST and UHI, clearly demonstrating that the replacement of natural land covers with concrete, asphalt, and other heat-retaining materials directly leads to elevated surface temperatures, stronger UHI formation, and heightened urban thermal stress.
The strong coupling between LST and UHI further highlights that localized surface warming rapidly translates into atmospheric heat accumulation and persistent heat island development. This relationship reflects well-established urban heat dynamics, whereby reduced evapotranspiration, diminished shading, high thermal inertia of construction materials, anthropogenic heat emissions, and limited urban ventilation collectively intensify warming. The notably high regression coefficients linking LST, UHI, and UTFVI also indicate that UTFVI is a highly sensitive ecological heat stress indicator in Finfinne, effectively capturing the environmental consequences of thermal amplification. These results are consistent with findings from other Ethiopian cities, including Jimma, Bedelle, Bonga, and Sokorru, where increasing built-up density and loss of green spaces resulted in higher LST and UHI values.
Spatial analysis further reinforces these statistical relationships. Areas characterized by high built-up density consistently exhibit the highest surface temperatures, strongest UHI effects, and the most severe UTFVI categories (“Bad,” “Worse,” and “Worst”), signaling pronounced ecological degradation and elevated thermal discomfort risk. Conversely, forest patches, vegetated lands, and water bodies correspond with low LST, weak UHI signatures, and favorable UTFVI classes (“Excellent,” “Good,” and “Normal”), underscoring their role as natural cooling systems within the urban landscape. Similar spatial and statistical patterns have been documented in Addis Ababa
| [10] | Estoque, R. C., & Murayama, Y. (2017). Landscape pattern and ecosystem service value changes: Implications for environmental sustainability. Sustainability, 9(6), 1–19.
https://doi.org/10.1016/j.landurbplan.2013.04.008 |
| [20] | Nagasa, M. D. (2025). Integrating CA–Markov modeling, machine learning classifiers, and spatial metrics for urban sprawl analysis in Naqamte City, Ethiopia. Discov Cities, 2, 114.
https://doi.org/10.1007/s44327-025-00147-2 |
| [23] | Qin, Z., Karnieli, A., & Berliner, P. (2001). A mono-window algorithm for retrieving land surface temperature from Landsat TM data and its application to the Israel–Egypt border region. International Journal of Remote Sensing, 22(18), 3719–3746.
https://doi.org/10.1080/01431160010006971 |
[10, 20, 23]
and Hawassa, as well. Collectively, these findings highlight the central role of LULC change in amplifying urban thermal environments and degrading ecological comfort, reflecting globally observed urban heat dynamics.
4.8. Contribution of the Present Study
Unlike many previous Ethiopian studies that focused either on LULC change or on short-term UHI/LST dynamics, this study provides a comprehensive 30-year integrated assessment that consistently links multi-decadal LULC transitions with the evolution of LST, UHI, and UTFVI in Finfinne. By employing a methodologically harmonized framework across Landsat missions and developing detailed transition matrices, the study not only quantifies the magnitude of change but also identifies specific conversion pathways particularly cropland-to-built-up and forest-to-built-up transitions that are directly responsible for thermal intensification. This explicit attribution addresses a key limitation in earlier works that often-reported thermal change without connecting it to precise land-cover processes.
Furthermore, the combined interpretation of LULC dynamics, LST patterns, UHI intensity, and UTFVI-based thermal stress provides a more holistic understanding of urban thermal risk than previous localized or short-interval assessments. The extended temporal coverage captures both the rapid expansion phases and periods of relative stabilization, offering deeper insights into the trajectory of urban thermal evolution in Finfinne. The strong consistency of the present results with national and international findings reinforces the reliability of the analysis, while the integrated approach significantly advances knowledge on how sustained urban growth shapes long-term thermal environments in rapidly developing African cities.
4.9. Implications for Urban Planning and Climate Resilience
The integrated assessment of LULC change, LST, UHI intensity, and UTFVI demonstrates that Finfinne’s urban thermal environment will worsen if current development trends continue without climate-responsive planning. Rapid conversion of croplands, forests, and other vegetated surfaces into impervious built-up areas highlights the urgent need to protect remaining green spaces, conserve peri-urban ecosystems, and restrict expansion into ecologically sensitive zones. Failure to act will intensify thermal stress, degrade ecological quality, and increase vulnerability to climate extremes.
The concentration of high LST, strong UHI, and severe UTFVI levels in the urban core and fast-growing peri-urban areas calls for proactive heat-mitigation strategies. Priority measures include urban forestry, interconnected green and blue infrastructure, riparian restoration, cool roofing materials, permeable pavements, and climate-sensitive urban design. Institutionalizing continuous geospatial monitoring of thermal indicators and LULC dynamics is essential to guide adaptive, evidence-based planning and strengthen Finfinne’s long-term urban climate resilience.